Cities with the Highest Percentage of Population with a Degree in Computers and Mathematics in South Carolina
RELATED REPORTS & OPTIONS
Computers and Mathematics
South Carolina
Compare Cities
Map of Cities with the Highest Percentage of Population with a Degree in Computers and Mathematics in South Carolina
0.0%
50.0%
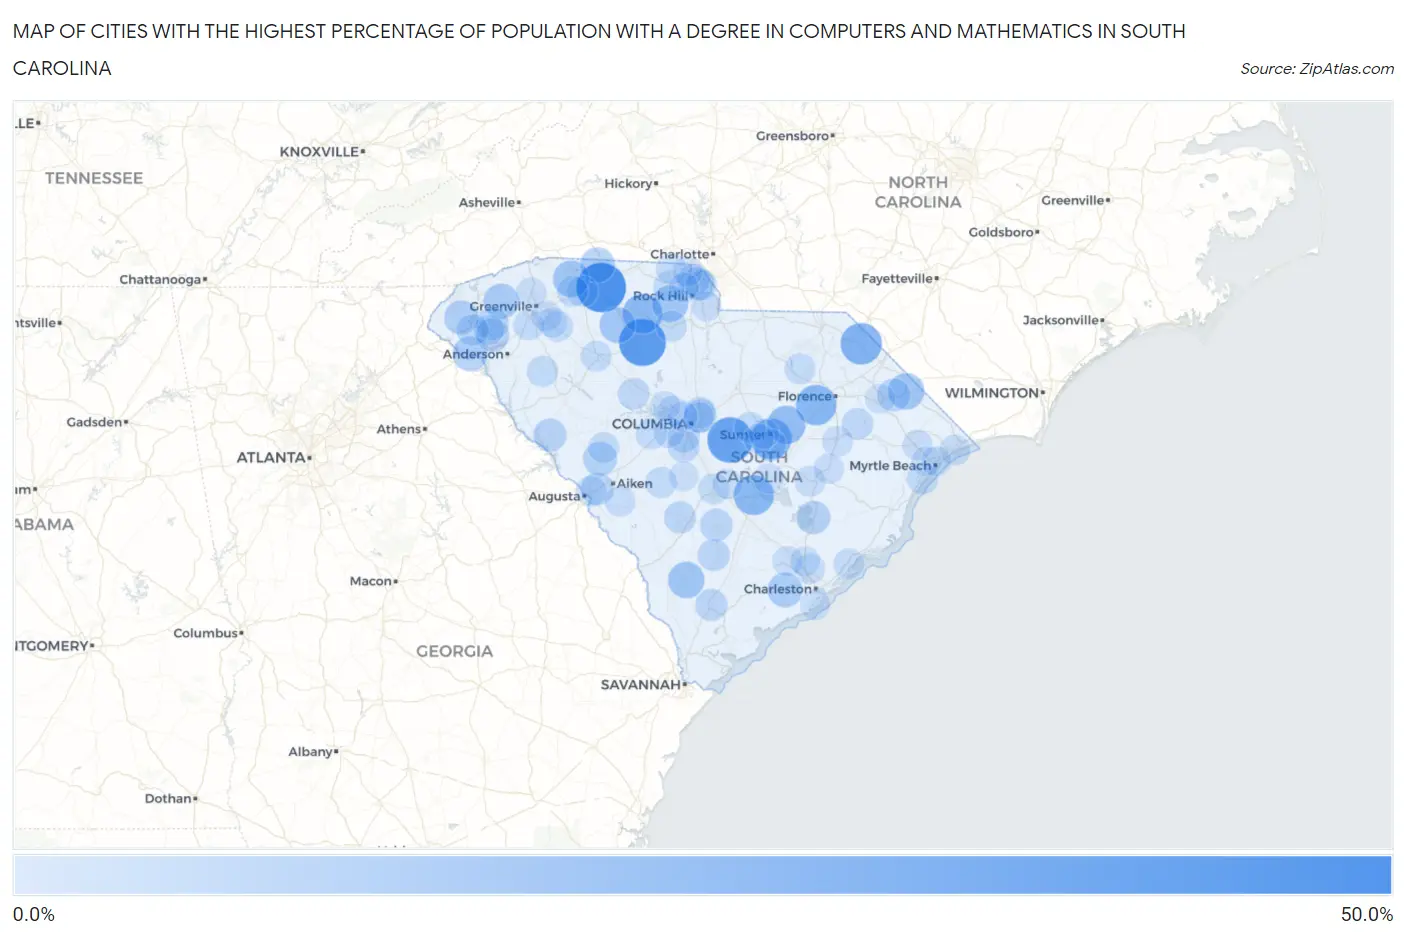
Cities with the Highest Percentage of Population with a Degree in Computers and Mathematics in South Carolina
| City | % Graduates | vs State | vs National | |
| 1. | Clifton | 50.0% | 3.7%(+46.3)#1 | 4.9%(+45.1)#99 |
| 2. | Carlisle | 43.6% | 3.7%(+39.8)#2 | 4.9%(+38.7)#143 |
| 3. | Eastover | 40.0% | 3.7%(+36.3)#3 | 4.9%(+35.1)#162 |
| 4. | Conestee | 36.4% | 3.7%(+32.6)#4 | 4.9%(+31.5)#202 |
| 5. | Clio | 30.5% | 3.7%(+26.8)#5 | 4.9%(+25.6)#283 |
| 6. | South Sumter | 29.1% | 3.7%(+25.3)#6 | 4.9%(+24.2)#303 |
| 7. | Timmonsville | 28.0% | 3.7%(+24.3)#7 | 4.9%(+23.1)#328 |
| 8. | Beech Island | 27.8% | 3.7%(+24.1)#8 | 4.9%(+22.9)#335 |
| 9. | Santee | 27.5% | 3.7%(+23.7)#9 | 4.9%(+22.6)#344 |
| 10. | Lockhart | 26.3% | 3.7%(+22.6)#10 | 4.9%(+21.4)#374 |
| 11. | Homewood | 25.4% | 3.7%(+21.7)#11 | 4.9%(+20.5)#398 |
| 12. | Mayesville | 23.4% | 3.7%(+19.7)#12 | 4.9%(+18.5)#465 |
| 13. | Inman | 19.0% | 3.7%(+15.2)#13 | 4.9%(+14.1)#676 |
| 14. | Varnville | 18.8% | 3.7%(+15.0)#14 | 4.9%(+13.9)#683 |
| 15. | Mcconnells | 18.5% | 3.7%(+14.8)#15 | 4.9%(+13.6)#709 |
| 16. | Nichols | 18.5% | 3.7%(+14.8)#16 | 4.9%(+13.6)#714 |
| 17. | Unity | 18.3% | 3.7%(+14.6)#17 | 4.9%(+13.4)#725 |
| 18. | Buffalo | 17.9% | 3.7%(+14.2)#18 | 4.9%(+13.1)#749 |
| 19. | North Santee | 17.1% | 3.7%(+13.3)#19 | 4.9%(+12.2)#830 |
| 20. | Pickens | 16.1% | 3.7%(+12.3)#20 | 4.9%(+11.2)#926 |
| 21. | Chesnee | 15.4% | 3.7%(+11.6)#21 | 4.9%(+10.5)#990 |
| 22. | Fair Play | 15.2% | 3.7%(+11.4)#22 | 4.9%(+10.3)#1,026 |
| 23. | Ravenel | 14.9% | 3.7%(+11.2)#23 | 4.9%(+10.0)#1,051 |
| 24. | Walhalla | 13.8% | 3.7%(+10.0)#24 | 4.9%(+8.88)#1,193 |
| 25. | Trenton | 12.9% | 3.7%(+9.11)#25 | 4.9%(+7.96)#1,363 |
| 26. | Pendleton | 11.9% | 3.7%(+8.11)#26 | 4.9%(+6.96)#1,556 |
| 27. | Bonneau | 11.7% | 3.7%(+7.92)#27 | 4.9%(+6.77)#1,611 |
| 28. | Mccormick | 11.5% | 3.7%(+7.74)#28 | 4.9%(+6.60)#1,652 |
| 29. | Arcadia Lakes | 11.5% | 3.7%(+7.73)#29 | 4.9%(+6.58)#1,656 |
| 30. | Riverview | 11.0% | 3.7%(+7.23)#30 | 4.9%(+6.08)#1,791 |
| 31. | Mullins | 10.7% | 3.7%(+6.93)#31 | 4.9%(+5.79)#1,880 |
| 32. | Burnettown | 10.1% | 3.7%(+6.30)#32 | 4.9%(+5.16)#2,104 |
| 33. | Branchville | 10.0% | 3.7%(+6.25)#33 | 4.9%(+5.11)#2,124 |
| 34. | Central | 10.0% | 3.7%(+6.21)#34 | 4.9%(+5.06)#2,172 |
| 35. | Lakewood | 9.4% | 3.7%(+5.67)#35 | 4.9%(+4.52)#2,412 |
| 36. | Tega Cay | 9.3% | 3.7%(+5.52)#36 | 4.9%(+4.38)#2,482 |
| 37. | Pine Ridge | 9.3% | 3.7%(+5.52)#37 | 4.9%(+4.38)#2,484 |
| 38. | Arkwright | 9.2% | 3.7%(+5.50)#38 | 4.9%(+4.35)#2,492 |
| 39. | Yemassee | 9.2% | 3.7%(+5.45)#39 | 4.9%(+4.30)#2,519 |
| 40. | Williams | 9.1% | 3.7%(+5.34)#40 | 4.9%(+4.20)#2,586 |
| 41. | Wyboo | 8.9% | 3.7%(+5.13)#41 | 4.9%(+3.98)#2,694 |
| 42. | Denmark | 8.7% | 3.7%(+5.00)#42 | 4.9%(+3.85)#2,766 |
| 43. | Gaston | 8.5% | 3.7%(+4.79)#43 | 4.9%(+3.64)#2,879 |
| 44. | Seneca | 8.2% | 3.7%(+4.46)#44 | 4.9%(+3.32)#3,076 |
| 45. | Pamplico | 7.8% | 3.7%(+4.09)#45 | 4.9%(+2.95)#3,333 |
| 46. | Prosperity | 7.8% | 3.7%(+4.08)#46 | 4.9%(+2.94)#3,351 |
| 47. | Dentsville | 7.7% | 3.7%(+3.91)#47 | 4.9%(+2.77)#3,488 |
| 48. | Camp Croft | 7.5% | 3.7%(+3.77)#48 | 4.9%(+2.62)#3,586 |
| 49. | Chester | 7.2% | 3.7%(+3.44)#49 | 4.9%(+2.30)#3,827 |
| 50. | Stateburg | 7.2% | 3.7%(+3.40)#50 | 4.9%(+2.26)#3,850 |
| 51. | Salley | 7.1% | 3.7%(+3.39)#51 | 4.9%(+2.25)#3,894 |
| 52. | Garden City | 7.1% | 3.7%(+3.37)#52 | 4.9%(+2.23)#3,916 |
| 53. | North Hartsville | 7.1% | 3.7%(+3.30)#53 | 4.9%(+2.16)#3,980 |
| 54. | Brookdale | 7.0% | 3.7%(+3.25)#54 | 4.9%(+2.10)#4,028 |
| 55. | Gilbert | 6.9% | 3.7%(+3.19)#55 | 4.9%(+2.05)#4,090 |
| 56. | Arcadia | 6.9% | 3.7%(+3.15)#56 | 4.9%(+2.00)#4,123 |
| 57. | Clearwater | 6.9% | 3.7%(+3.11)#57 | 4.9%(+1.97)#4,167 |
| 58. | York | 6.8% | 3.7%(+3.04)#58 | 4.9%(+1.89)#4,228 |
| 59. | Fort Mill | 6.7% | 3.7%(+2.98)#59 | 4.9%(+1.83)#4,288 |
| 60. | Donalds | 6.7% | 3.7%(+2.92)#60 | 4.9%(+1.77)#4,362 |
| 61. | Johnston | 6.6% | 3.7%(+2.85)#61 | 4.9%(+1.70)#4,436 |
| 62. | Fountain Inn | 6.6% | 3.7%(+2.85)#62 | 4.9%(+1.70)#4,438 |
| 63. | Wellford | 6.4% | 3.7%(+2.67)#63 | 4.9%(+1.53)#4,643 |
| 64. | Clinton | 6.4% | 3.7%(+2.66)#64 | 4.9%(+1.52)#4,651 |
| 65. | Piedmont | 6.3% | 3.7%(+2.59)#65 | 4.9%(+1.45)#4,743 |
| 66. | Awendaw | 6.2% | 3.7%(+2.50)#66 | 4.9%(+1.36)#4,830 |
| 67. | Greeleyville | 6.2% | 3.7%(+2.50)#67 | 4.9%(+1.36)#4,848 |
| 68. | Atlantic Beach | 6.2% | 3.7%(+2.50)#68 | 4.9%(+1.36)#4,852 |
| 69. | Clover | 6.2% | 3.7%(+2.47)#69 | 4.9%(+1.32)#4,883 |
| 70. | Red Bank | 6.0% | 3.7%(+2.27)#70 | 4.9%(+1.12)#5,132 |
| 71. | Irmo | 5.9% | 3.7%(+2.19)#71 | 4.9%(+1.04)#5,246 |
| 72. | Sandy Springs | 5.8% | 3.7%(+2.09)#72 | 4.9%(+0.945)#5,372 |
| 73. | Lake City | 5.6% | 3.7%(+1.87)#73 | 4.9%(+0.725)#5,644 |
| 74. | New Ellenton | 5.6% | 3.7%(+1.81)#74 | 4.9%(+0.662)#5,741 |
| 75. | Travelers Rest | 5.5% | 3.7%(+1.77)#75 | 4.9%(+0.628)#5,822 |
| 76. | Chickasaw Point | 5.5% | 3.7%(+1.76)#76 | 4.9%(+0.611)#5,848 |
| 77. | Mauldin | 5.5% | 3.7%(+1.70)#77 | 4.9%(+0.558)#5,928 |
| 78. | Forest Acres | 5.4% | 3.7%(+1.66)#78 | 4.9%(+0.515)#5,973 |
| 79. | Summerton | 5.3% | 3.7%(+1.60)#79 | 4.9%(+0.454)#6,088 |
| 80. | Clemson | 5.3% | 3.7%(+1.59)#80 | 4.9%(+0.445)#6,097 |
| 81. | Hanahan | 5.3% | 3.7%(+1.55)#81 | 4.9%(+0.402)#6,156 |
| 82. | Kingstree | 5.3% | 3.7%(+1.50)#82 | 4.9%(+0.360)#6,252 |
| 83. | Lake Wylie | 5.2% | 3.7%(+1.44)#83 | 4.9%(+0.291)#6,367 |
| 84. | St Andrews | 5.2% | 3.7%(+1.43)#84 | 4.9%(+0.285)#6,372 |
| 85. | Lake Murray Of Richland | 5.2% | 3.7%(+1.43)#85 | 4.9%(+0.282)#6,378 |
| 86. | Catawba | 5.2% | 3.7%(+1.41)#86 | 4.9%(+0.267)#6,407 |
| 87. | Conway | 5.0% | 3.7%(+1.25)#87 | 4.9%(+0.101)#6,702 |
| 88. | Summerville | 4.9% | 3.7%(+1.15)#88 | 4.9%(+0.005)#6,852 |
| 89. | Harbor Island | 4.9% | 3.7%(+1.12)#89 | 4.9%(-0.027)#6,944 |
| 90. | Cameron | 4.8% | 3.7%(+1.07)#90 | 4.9%(-0.075)#7,024 |
| 91. | Forestbrook | 4.7% | 3.7%(+0.998)#91 | 4.9%(-0.146)#7,173 |
| 92. | Sumter | 4.6% | 3.7%(+0.874)#92 | 4.9%(-0.271)#7,428 |
| 93. | Newport | 4.6% | 3.7%(+0.866)#93 | 4.9%(-0.279)#7,438 |
| 94. | Marion | 4.6% | 3.7%(+0.858)#94 | 4.9%(-0.286)#7,461 |
| 95. | North | 4.5% | 3.7%(+0.796)#95 | 4.9%(-0.349)#7,576 |
| 96. | Goose Creek | 4.5% | 3.7%(+0.753)#96 | 4.9%(-0.392)#7,676 |
| 97. | Folly Beach | 4.5% | 3.7%(+0.749)#97 | 4.9%(-0.395)#7,681 |
| 98. | Myrtle Beach | 4.5% | 3.7%(+0.705)#98 | 4.9%(-0.440)#7,762 |
| 99. | Cane Savannah | 4.4% | 3.7%(+0.659)#99 | 4.9%(-0.486)#7,862 |
| 100. | Simpsonville | 4.4% | 3.7%(+0.656)#100 | 4.9%(-0.488)#7,868 |
Common Questions
What are the Top 10 Cities with the Highest Percentage of Population with a Degree in Computers and Mathematics in South Carolina?
Top 10 Cities with the Highest Percentage of Population with a Degree in Computers and Mathematics in South Carolina are:
#1
50.0%
#2
43.6%
#3
40.0%
#4
30.5%
#5
29.1%
#6
28.0%
#7
27.5%
#8
26.3%
#9
23.4%
#10
19.0%
What city has the Highest Percentage of Population with a Degree in Computers and Mathematics in South Carolina?
Clifton has the Highest Percentage of Population with a Degree in Computers and Mathematics in South Carolina with 50.0%.
What is the Percentage of Population with a Degree in Computers and Mathematics in the State of South Carolina?
Percentage of Population with a Degree in Computers and Mathematics in South Carolina is 3.7%.
What is the Percentage of Population with a Degree in Computers and Mathematics in the United States?
Percentage of Population with a Degree in Computers and Mathematics in the United States is 4.9%.