Coyne Center, IL
Coyne Center Map
Coyne Center Overview
948
TOTAL POPULATION
443
MALE POPULATION
505
FEMALE POPULATION
87.72
MALES / 100 FEMALES
114.00
FEMALES / 100 MALES
52.5
MEDIAN AGE
2.8
AVG FAMILY SIZE
2.5
AVG HOUSEHOLD SIZE
$36,259
PER CAPITA INCOME
$133,529
AVG FAMILY INCOME
$116,310
AVG HOUSEHOLD INCOME
0.30
INEQUALITY / GINI INDEX
401
LABOR FORCE [ PEOPLE ]
56.4%
PERCENT IN LABOR FORCE
1.7%
UNEMPLOYMENT RATE
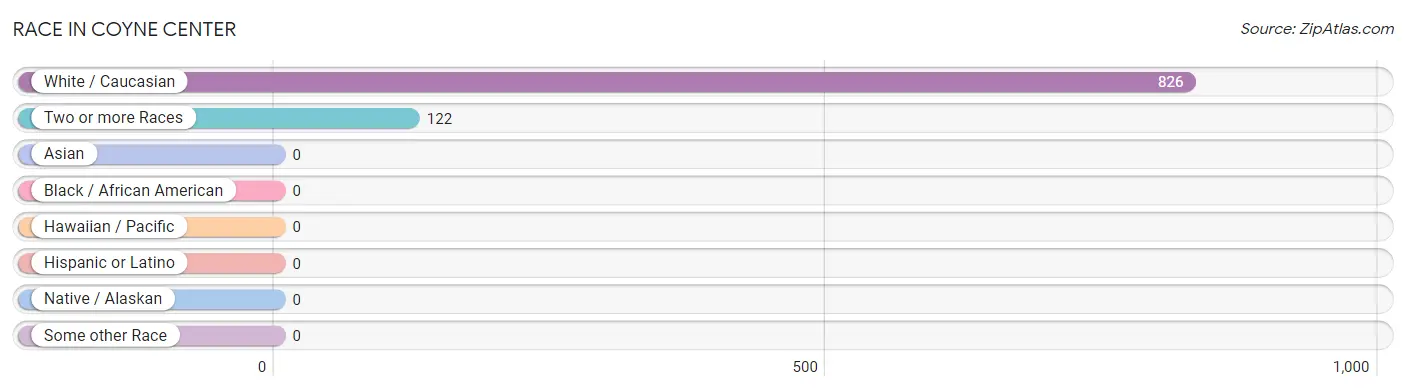
Race in Coyne Center
The most populous races in Coyne Center are White / Caucasian (826 | 87.1%), and Two or more Races (122 | 12.9%).
| Race | # Population | % Population |
| Asian | 0 | 0.0% |
| Black / African American | 0 | 0.0% |
| Hawaiian / Pacific | 0 | 0.0% |
| Hispanic or Latino | 0 | 0.0% |
| Native / Alaskan | 0 | 0.0% |
| White / Caucasian | 826 | 87.1% |
| Two or more Races | 122 | 12.9% |
| Some other Race | 0 | 0.0% |
| Total | 948 | 100.0% |
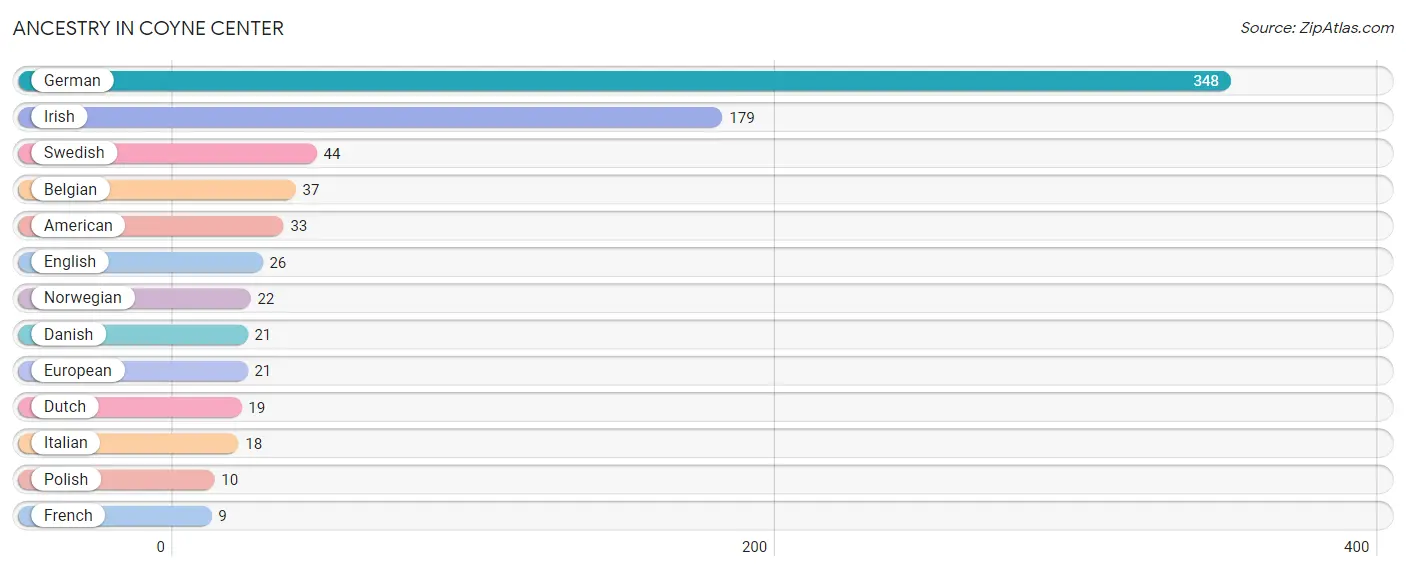
Ancestry in Coyne Center
The most populous ancestries reported in Coyne Center are German (348 | 36.7%), Irish (179 | 18.9%), Swedish (44 | 4.6%), Belgian (37 | 3.9%), and American (33 | 3.5%), together accounting for 67.6% of all Coyne Center residents.
| Ancestry | # Population | % Population |
| American | 33 | 3.5% |
| Belgian | 37 | 3.9% |
| Danish | 21 | 2.2% |
| Dutch | 19 | 2.0% |
| English | 26 | 2.7% |
| European | 21 | 2.2% |
| French | 9 | 0.9% |
| German | 348 | 36.7% |
| Irish | 179 | 18.9% |
| Italian | 18 | 1.9% |
| Norwegian | 22 | 2.3% |
| Polish | 10 | 1.1% |
| Swedish | 44 | 4.6% | View All 13 Rows |
Immigrants in Coyne Center

| Immigration Origin | # Population | % Population | View All 0 Rows |
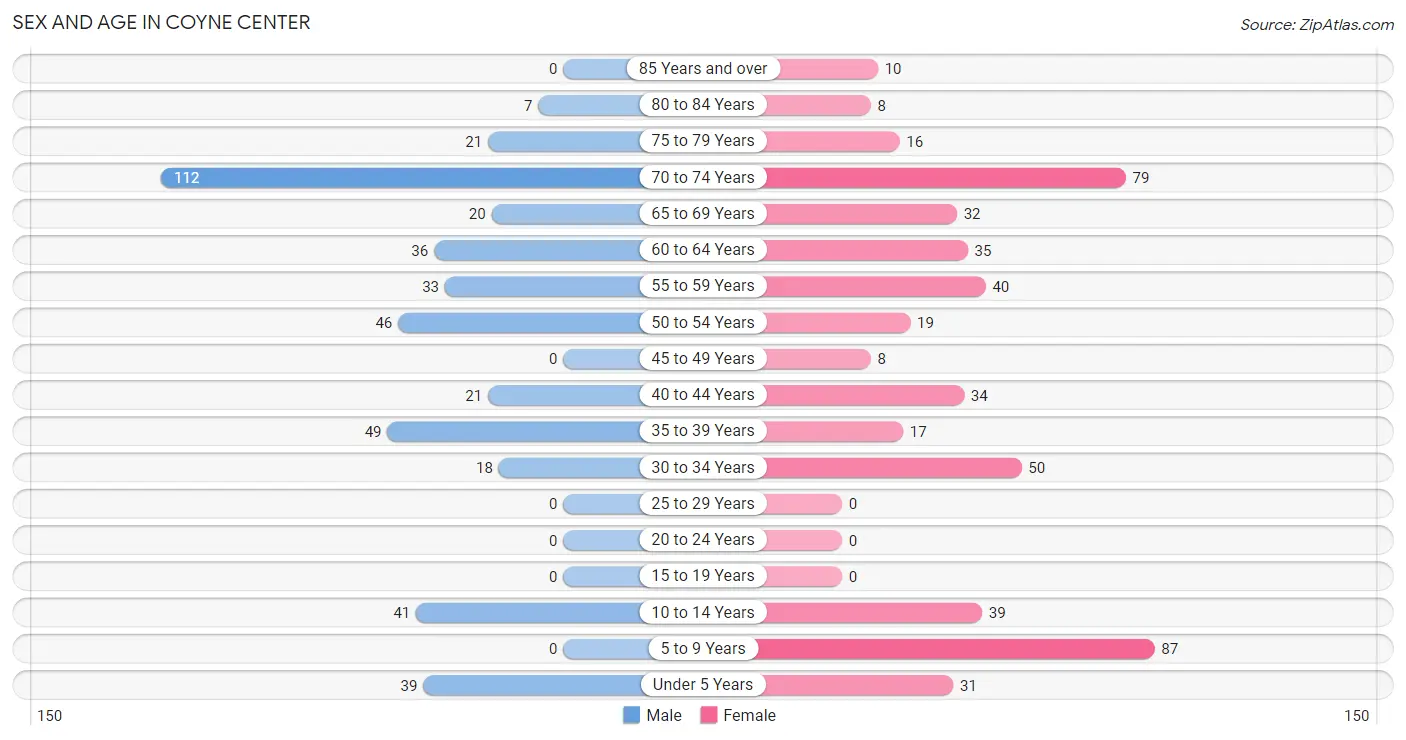
Sex and Age in Coyne Center
Sex and Age in Coyne Center
The most populous age groups in Coyne Center are 70 to 74 Years (112 | 25.3%) for men and 5 to 9 Years (87 | 17.2%) for women.
| Age Bracket | Male | Female |
| Under 5 Years | 39 (8.8%) | 31 (6.1%) |
| 5 to 9 Years | 0 (0.0%) | 87 (17.2%) |
| 10 to 14 Years | 41 (9.3%) | 39 (7.7%) |
| 15 to 19 Years | 0 (0.0%) | 0 (0.0%) |
| 20 to 24 Years | 0 (0.0%) | 0 (0.0%) |
| 25 to 29 Years | 0 (0.0%) | 0 (0.0%) |
| 30 to 34 Years | 18 (4.1%) | 50 (9.9%) |
| 35 to 39 Years | 49 (11.1%) | 17 (3.4%) |
| 40 to 44 Years | 21 (4.7%) | 34 (6.7%) |
| 45 to 49 Years | 0 (0.0%) | 8 (1.6%) |
| 50 to 54 Years | 46 (10.4%) | 19 (3.8%) |
| 55 to 59 Years | 33 (7.4%) | 40 (7.9%) |
| 60 to 64 Years | 36 (8.1%) | 35 (6.9%) |
| 65 to 69 Years | 20 (4.5%) | 32 (6.3%) |
| 70 to 74 Years | 112 (25.3%) | 79 (15.6%) |
| 75 to 79 Years | 21 (4.7%) | 16 (3.2%) |
| 80 to 84 Years | 7 (1.6%) | 8 (1.6%) |
| 85 Years and over | 0 (0.0%) | 10 (2.0%) |
| Total | 443 (100.0%) | 505 (100.0%) |
Families and Households in Coyne Center
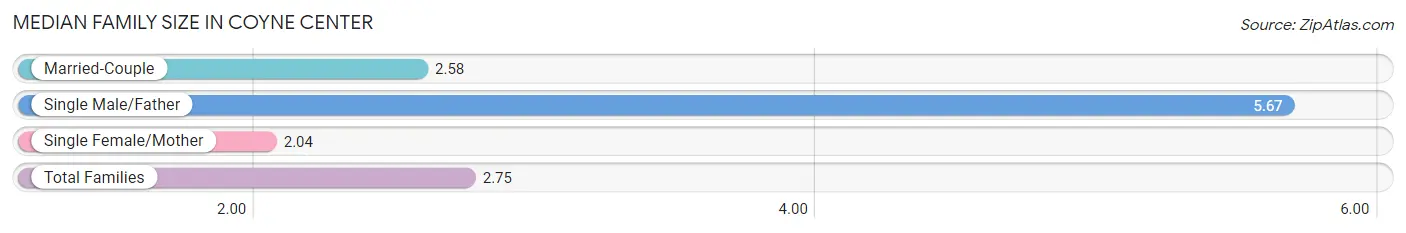
Median Family Size in Coyne Center
The median family size in Coyne Center is 2.75 persons per family, with single male/father families (21 | 6.6%) accounting for the largest median family size of 5.67 persons per family. On the other hand, single female/mother families (24 | 7.5%) represent the smallest median family size with 2.04 persons per family.
| Family Type | # Families | Family Size |
| Married-Couple | 273 (85.9%) | 2.58 |
| Single Male/Father | 21 (6.6%) | 5.67 |
| Single Female/Mother | 24 (7.5%) | 2.04 |
| Total Families | 318 (100.0%) | 2.75 |
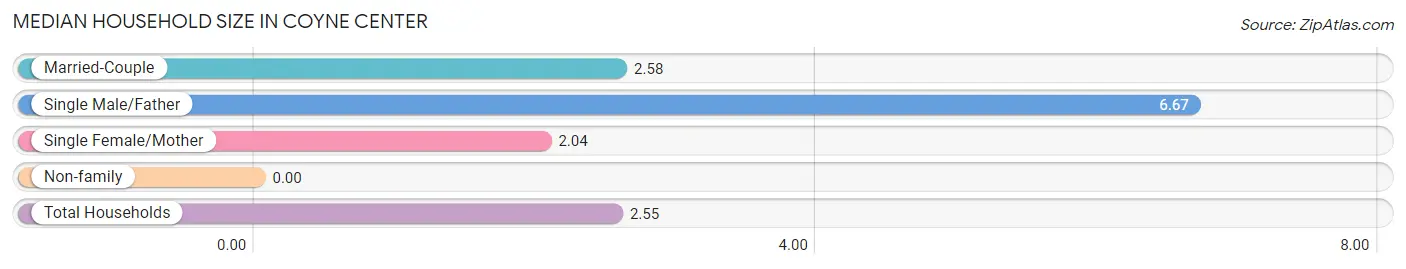
Median Household Size in Coyne Center
| Household Type | # Households | Household Size |
| Married-Couple | 273 (73.4%) | 2.58 |
| Single Male/Father | 21 (5.7%) | 6.67 |
| Single Female/Mother | 24 (6.5%) | 2.04 |
| Non-family | 54 (14.5%) | - |
| Total Households | 372 (100.0%) | 2.55 |
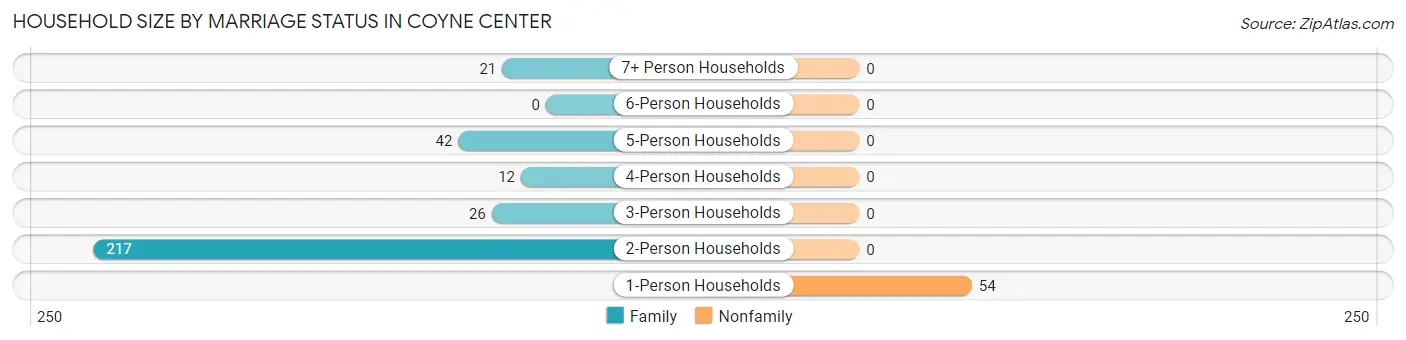
Household Size by Marriage Status in Coyne Center
Out of a total of 372 households in Coyne Center, 318 (85.5%) are family households, while 54 (14.5%) are nonfamily households. The most numerous type of family households are 2-person households, comprising 217, and the most common type of nonfamily households are 1-person households, comprising 54.
| Household Size | Family Households | Nonfamily Households |
| 1-Person Households | - | 54 (14.5%) |
| 2-Person Households | 217 (58.3%) | 0 (0.0%) |
| 3-Person Households | 26 (7.0%) | 0 (0.0%) |
| 4-Person Households | 12 (3.2%) | 0 (0.0%) |
| 5-Person Households | 42 (11.3%) | 0 (0.0%) |
| 6-Person Households | 0 (0.0%) | 0 (0.0%) |
| 7+ Person Households | 21 (5.7%) | 0 (0.0%) |
| Total | 318 (85.5%) | 54 (14.5%) |
Female Fertility in Coyne Center
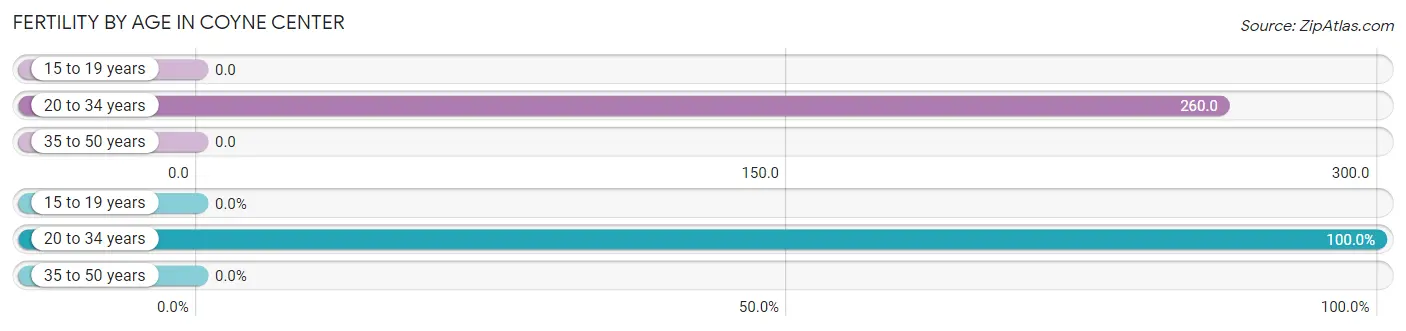
Fertility by Age in Coyne Center
Average fertility rate in Coyne Center is 119.0 births per 1,000 women. Women in the age bracket of 20 to 34 years have the highest fertility rate with 260.0 births per 1,000 women. Women in the age bracket of 20 to 34 years acount for 100.0% of all women with births.
| Age Bracket | Women with Births | Births / 1,000 Women |
| 15 to 19 years | 0 (0.0%) | 0.0 |
| 20 to 34 years | 13 (100.0%) | 260.0 |
| 35 to 50 years | 0 (0.0%) | 0.0 |
| Total | 13 (100.0%) | 119.0 |
Fertility by Age by Marriage Status in Coyne Center
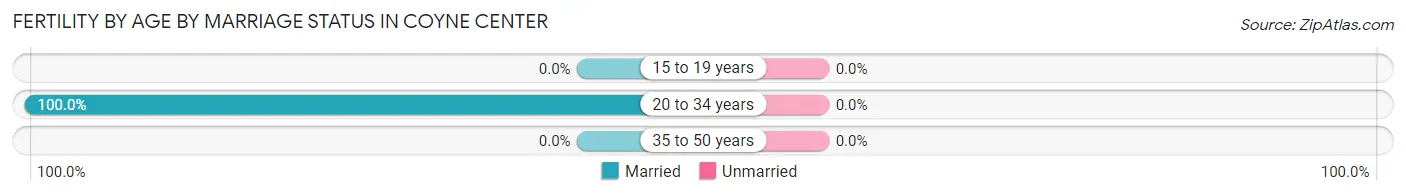
| Age Bracket | Married | Unmarried |
| 15 to 19 years | 0 (0.0%) | 0 (0.0%) |
| 20 to 34 years | 13 (100.0%) | 0 (0.0%) |
| 35 to 50 years | 0 (0.0%) | 0 (0.0%) |
| Total | 13 (100.0%) | 0 (0.0%) |
Fertility by Education in Coyne Center
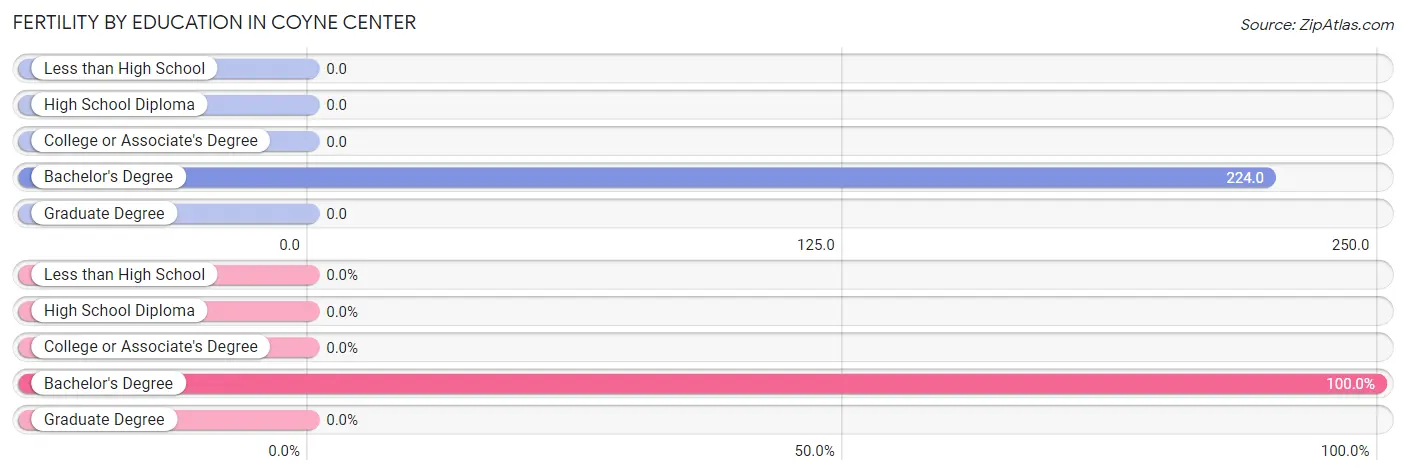
| Educational Attainment | Women with Births | Births / 1,000 Women |
| Less than High School | 0 (0.0%) | 0.0 |
| High School Diploma | 0 (0.0%) | 0.0 |
| College or Associate's Degree | 0 (0.0%) | 0.0 |
| Bachelor's Degree | 13 (100.0%) | 224.0 |
| Graduate Degree | 0 (0.0%) | 0.0 |
| Total | 13 (100.0%) | 119.0 |
Fertility by Education by Marriage Status in Coyne Center
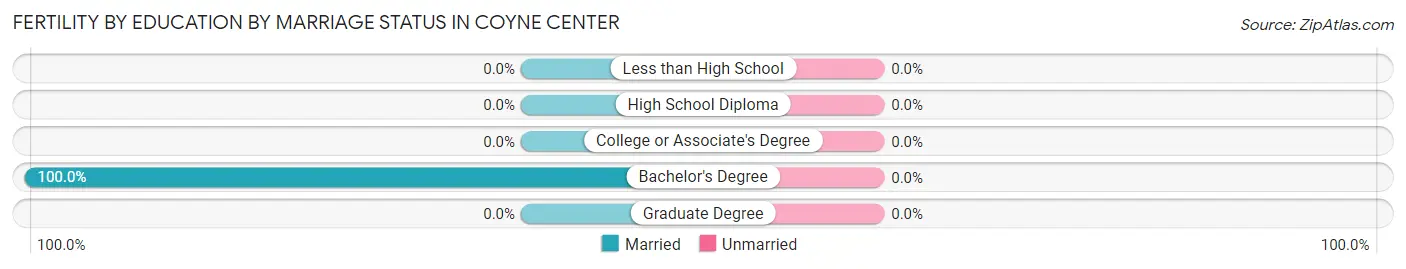
| Educational Attainment | Married | Unmarried |
| Less than High School | 0 (0.0%) | 0 (0.0%) |
| High School Diploma | 0 (0.0%) | 0 (0.0%) |
| College or Associate's Degree | 0 (0.0%) | 0 (0.0%) |
| Bachelor's Degree | 13 (100.0%) | 0 (0.0%) |
| Graduate Degree | 0 (0.0%) | 0 (0.0%) |
| Total | 13 (100.0%) | 0 (0.0%) |
Income in Coyne Center
Income Overview in Coyne Center
Per Capita Income in Coyne Center is $36,259, while median incomes of families and households are $133,529 and $116,310 respectively.
| Characteristic | Number | Measure |
| Per Capita Income | 948 | $36,259 |
| Median Family Income | 318 | $133,529 |
| Mean Family Income | 318 | $111,018 |
| Median Household Income | 372 | $116,310 |
| Mean Household Income | 372 | $100,727 |
| Income Deficit | 318 | $0 |
| Wage / Income Gap (%) | 948 | 0.00% |
| Wage / Income Gap ($) | 948 | 100.00¢ per $1 |
| Gini / Inequality Index | 948 | 0.30 |
Earnings by Sex in Coyne Center
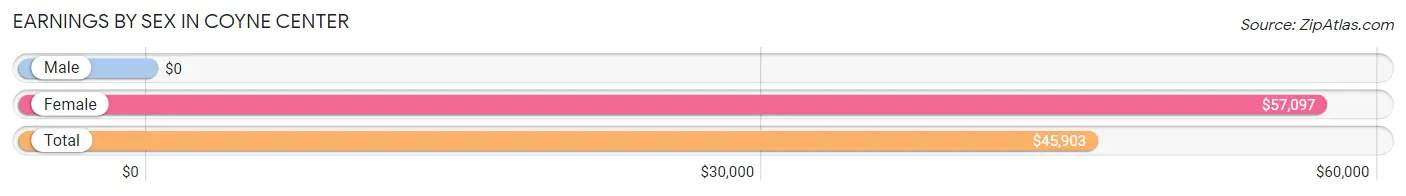
| Sex | Number | Average Earnings |
| Male | 287 (57.1%) | $0 |
| Female | 216 (42.9%) | $57,097 |
| Total | 503 (100.0%) | $45,903 |
Earnings by Sex by Income Bracket in Coyne Center
The most common earnings brackets in Coyne Center are $15,000 to $17,499 for men (112 | 39.0%) and $75,000 to $99,999 for women (68 | 31.5%).
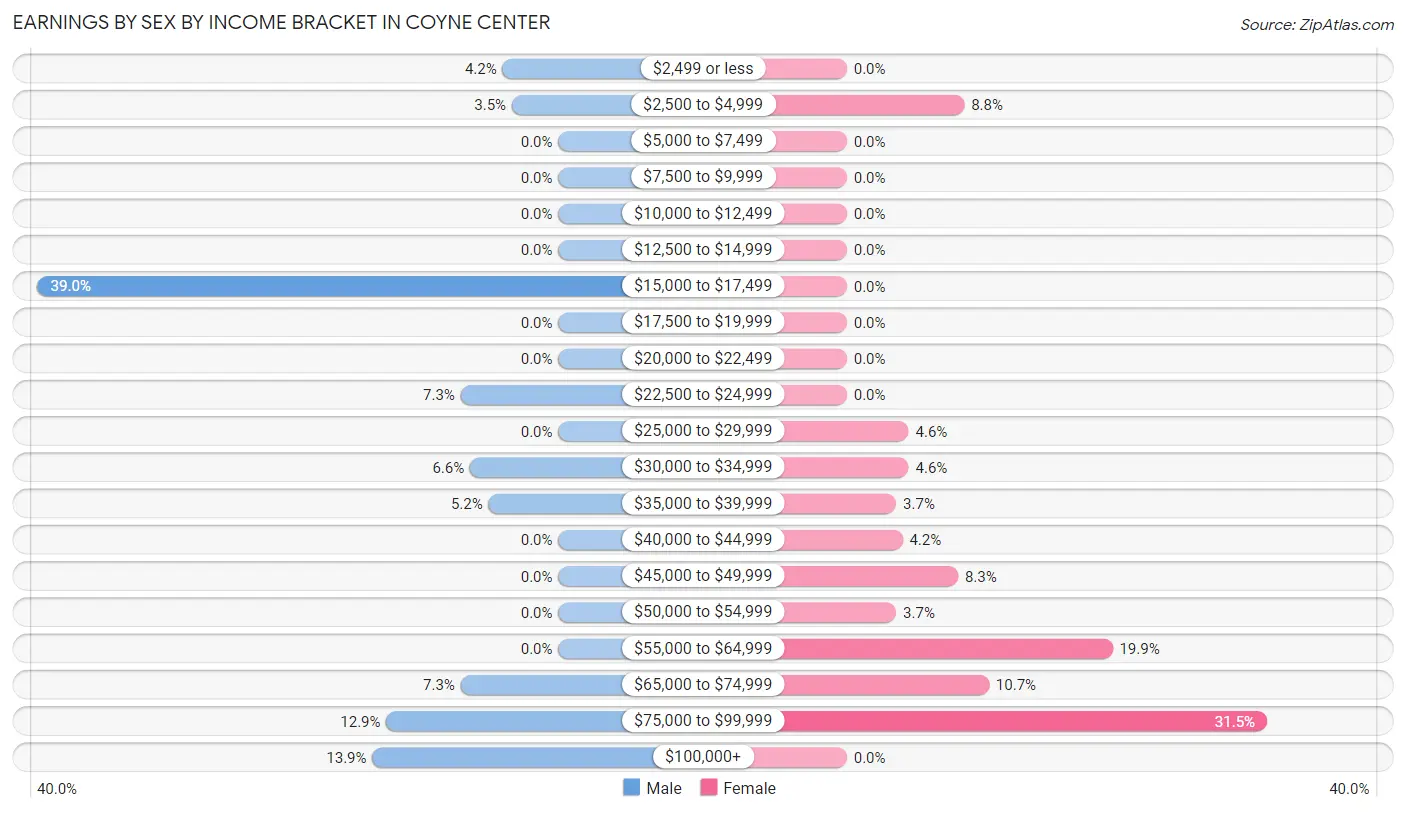
| Income | Male | Female |
| $2,499 or less | 12 (4.2%) | 0 (0.0%) |
| $2,500 to $4,999 | 10 (3.5%) | 19 (8.8%) |
| $5,000 to $7,499 | 0 (0.0%) | 0 (0.0%) |
| $7,500 to $9,999 | 0 (0.0%) | 0 (0.0%) |
| $10,000 to $12,499 | 0 (0.0%) | 0 (0.0%) |
| $12,500 to $14,999 | 0 (0.0%) | 0 (0.0%) |
| $15,000 to $17,499 | 112 (39.0%) | 0 (0.0%) |
| $17,500 to $19,999 | 0 (0.0%) | 0 (0.0%) |
| $20,000 to $22,499 | 0 (0.0%) | 0 (0.0%) |
| $22,500 to $24,999 | 21 (7.3%) | 0 (0.0%) |
| $25,000 to $29,999 | 0 (0.0%) | 10 (4.6%) |
| $30,000 to $34,999 | 19 (6.6%) | 10 (4.6%) |
| $35,000 to $39,999 | 15 (5.2%) | 8 (3.7%) |
| $40,000 to $44,999 | 0 (0.0%) | 9 (4.2%) |
| $45,000 to $49,999 | 0 (0.0%) | 18 (8.3%) |
| $50,000 to $54,999 | 0 (0.0%) | 8 (3.7%) |
| $55,000 to $64,999 | 0 (0.0%) | 43 (19.9%) |
| $65,000 to $74,999 | 21 (7.3%) | 23 (10.6%) |
| $75,000 to $99,999 | 37 (12.9%) | 68 (31.5%) |
| $100,000+ | 40 (13.9%) | 0 (0.0%) |
| Total | 287 (100.0%) | 216 (100.0%) |
Earnings by Sex by Educational Attainment in Coyne Center
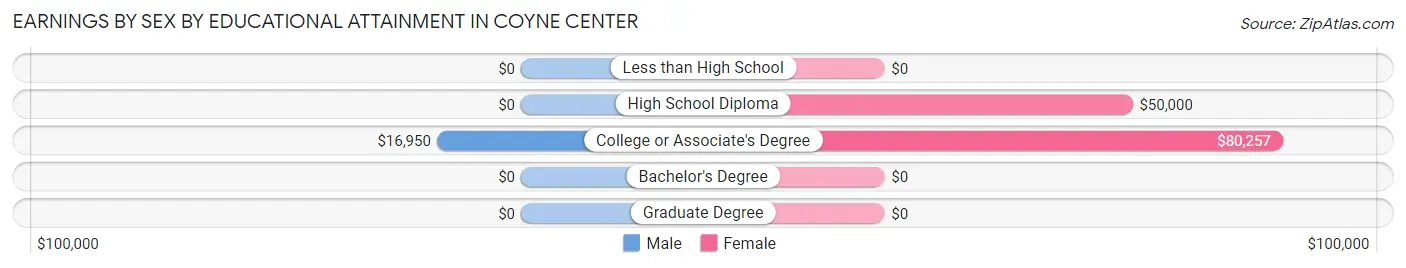
| Educational Attainment | Male Income | Female Income |
| Less than High School | - | - |
| High School Diploma | - | - |
| College or Associate's Degree | $16,950 | $80,257 |
| Bachelor's Degree | - | - |
| Graduate Degree | - | - |
| Total | - | - |
Family Income in Coyne Center
Family Income Brackets in Coyne Center
According to the Coyne Center family income data, there are 197 families falling into the $100,000 to $149,999 income range, which is the most common income bracket and makes up 62.0% of all families.
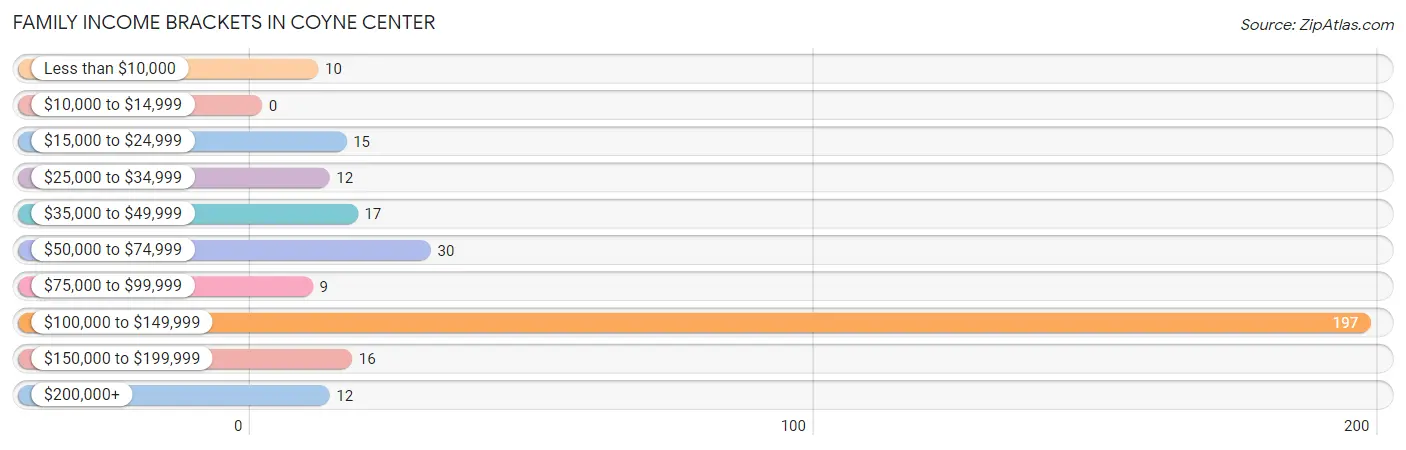
| Income Bracket | # Families | % Families |
| Less than $10,000 | 10 | 3.1% |
| $10,000 to $14,999 | 0 | 0.0% |
| $15,000 to $24,999 | 15 | 4.7% |
| $25,000 to $34,999 | 12 | 3.8% |
| $35,000 to $49,999 | 17 | 5.3% |
| $50,000 to $74,999 | 30 | 9.4% |
| $75,000 to $99,999 | 9 | 2.8% |
| $100,000 to $149,999 | 197 | 61.9% |
| $150,000 to $199,999 | 16 | 5.0% |
| $200,000+ | 12 | 3.8% |
Family Income by Famaliy Size in Coyne Center
2-person families (217 | 68.2%) account for the highest median family income in Coyne Center with $142,588 per family, while 2-person families (217 | 68.2%) have the highest median income of $71,294 per family member.
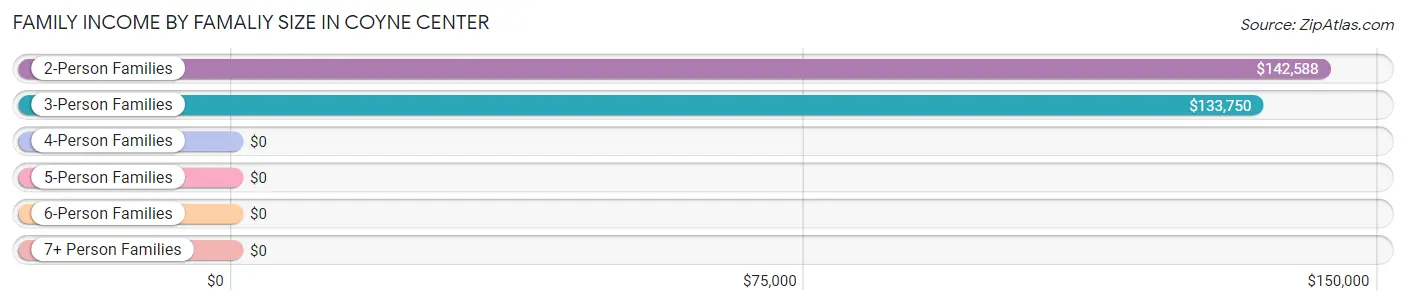
| Income Bracket | # Families | Median Income |
| 2-Person Families | 217 (68.2%) | $142,588 |
| 3-Person Families | 26 (8.2%) | $133,750 |
| 4-Person Families | 12 (3.8%) | $0 |
| 5-Person Families | 42 (13.2%) | $0 |
| 6-Person Families | 21 (6.6%) | $0 |
| 7+ Person Families | 0 (0.0%) | $0 |
| Total | 318 (100.0%) | $133,529 |
Family Income by Number of Earners in Coyne Center
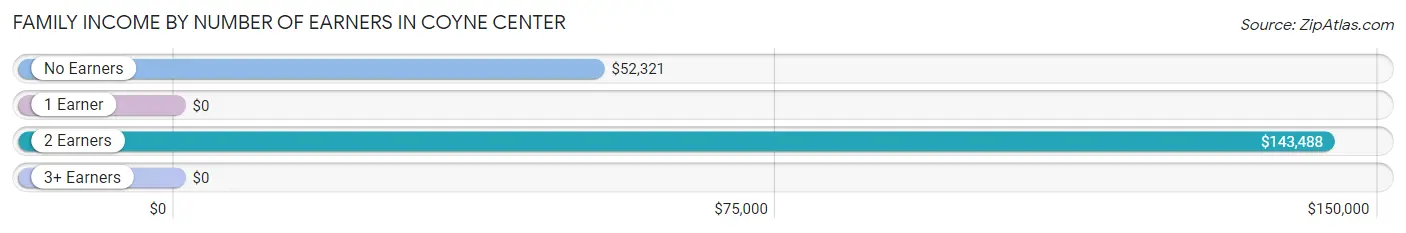
| Number of Earners | # Families | Median Income |
| No Earners | 27 (8.5%) | $52,321 |
| 1 Earner | 93 (29.2%) | $0 |
| 2 Earners | 177 (55.7%) | $143,488 |
| 3+ Earners | 21 (6.6%) | $0 |
| Total | 318 (100.0%) | $133,529 |
Household Income in Coyne Center
Household Income Brackets in Coyne Center
With 197 households falling in the category, the $100,000 to $149,999 income range is the most frequent in Coyne Center, accounting for 53.0% of all households.
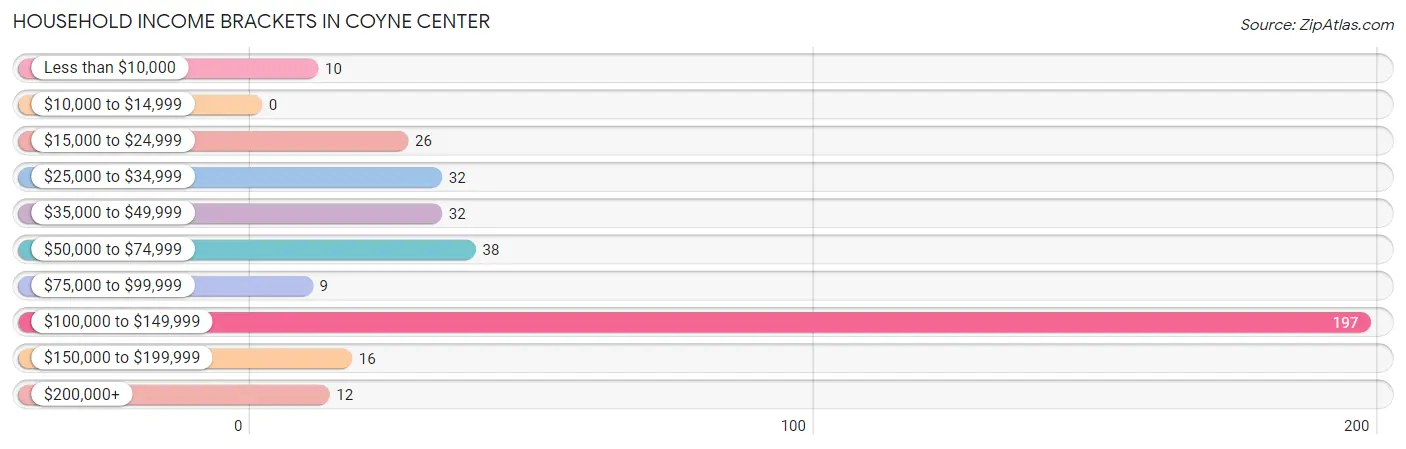
| Income Bracket | # Households | % Households |
| Less than $10,000 | 10 | 2.7% |
| $10,000 to $14,999 | 0 | 0.0% |
| $15,000 to $24,999 | 26 | 7.0% |
| $25,000 to $34,999 | 32 | 8.6% |
| $35,000 to $49,999 | 32 | 8.6% |
| $50,000 to $74,999 | 38 | 10.2% |
| $75,000 to $99,999 | 9 | 2.4% |
| $100,000 to $149,999 | 197 | 53.0% |
| $150,000 to $199,999 | 16 | 4.3% |
| $200,000+ | 12 | 3.2% |
Household Income by Householder Age in Coyne Center
The median household income in Coyne Center is $116,310, with the highest median household income of $142,856 found in the 65+ years age bracket for the primary householder. A total of 187 households (50.3%) fall into this category.
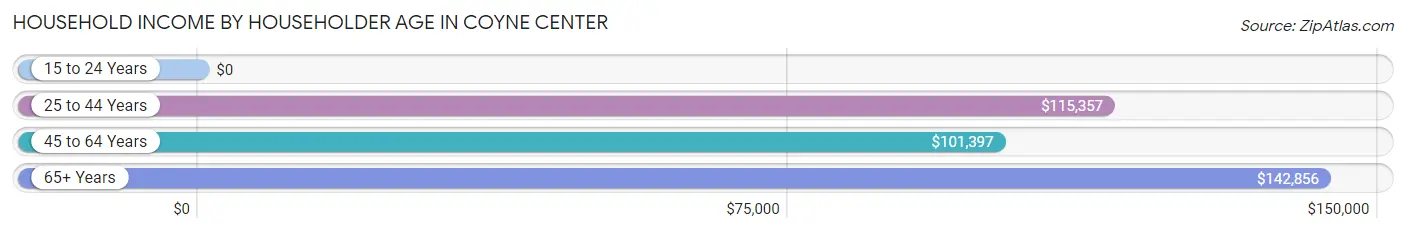
| Income Bracket | # Households | Median Income |
| 15 to 24 Years | 0 (0.0%) | $0 |
| 25 to 44 Years | 76 (20.4%) | $115,357 |
| 45 to 64 Years | 109 (29.3%) | $101,397 |
| 65+ Years | 187 (50.3%) | $142,856 |
| Total | 372 (100.0%) | $116,310 |
Poverty in Coyne Center
Income Below Poverty by Sex and Age in Coyne Center
With 9.7% poverty level for males and 12.3% for females among the residents of Coyne Center, 45 to 54 year old males and 5 year old females are the most vulnerable to poverty, with 21 males (45.7%) and 13 females (100.0%) in their respective age groups living below the poverty level.
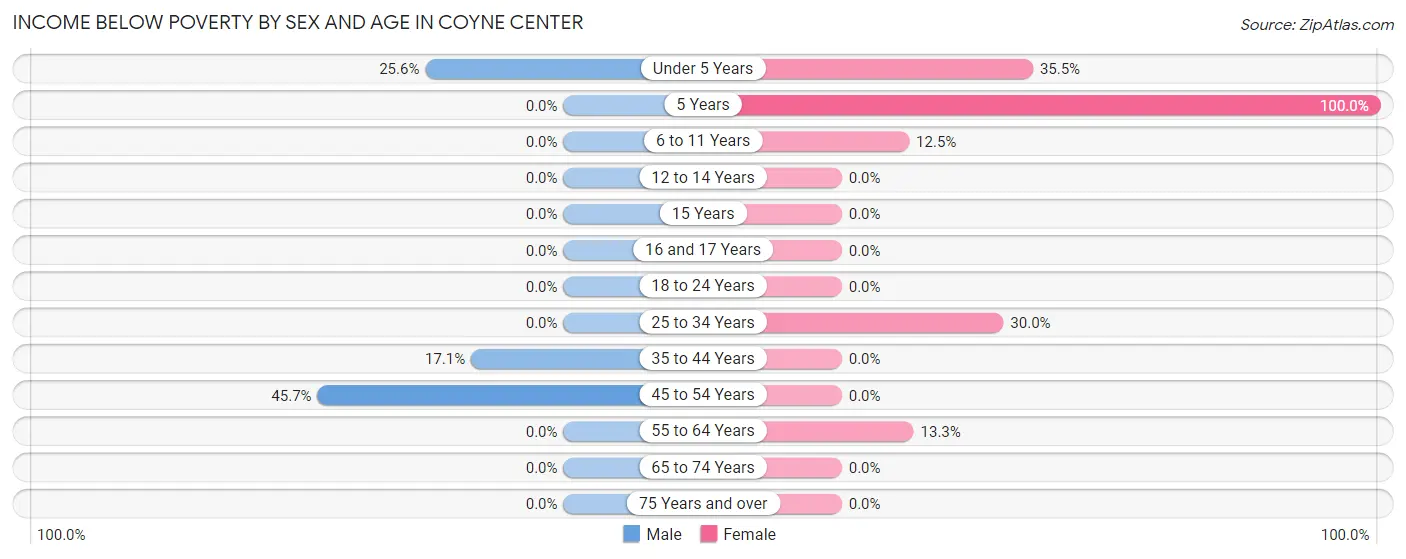
| Age Bracket | Male | Female |
| Under 5 Years | 10 (25.6%) | 11 (35.5%) |
| 5 Years | 0 (0.0%) | 13 (100.0%) |
| 6 to 11 Years | 0 (0.0%) | 13 (12.5%) |
| 12 to 14 Years | 0 (0.0%) | 0 (0.0%) |
| 15 Years | 0 (0.0%) | 0 (0.0%) |
| 16 and 17 Years | 0 (0.0%) | 0 (0.0%) |
| 18 to 24 Years | 0 (0.0%) | 0 (0.0%) |
| 25 to 34 Years | 0 (0.0%) | 15 (30.0%) |
| 35 to 44 Years | 12 (17.1%) | 0 (0.0%) |
| 45 to 54 Years | 21 (45.7%) | 0 (0.0%) |
| 55 to 64 Years | 0 (0.0%) | 10 (13.3%) |
| 65 to 74 Years | 0 (0.0%) | 0 (0.0%) |
| 75 Years and over | 0 (0.0%) | 0 (0.0%) |
| Total | 43 (9.7%) | 62 (12.3%) |
Income Above Poverty by Sex and Age in Coyne Center
According to the poverty statistics in Coyne Center, males aged 6 to 11 years and females aged 12 to 14 years are the age groups that are most secure financially, with 100.0% of males and 100.0% of females in these age groups living above the poverty line.
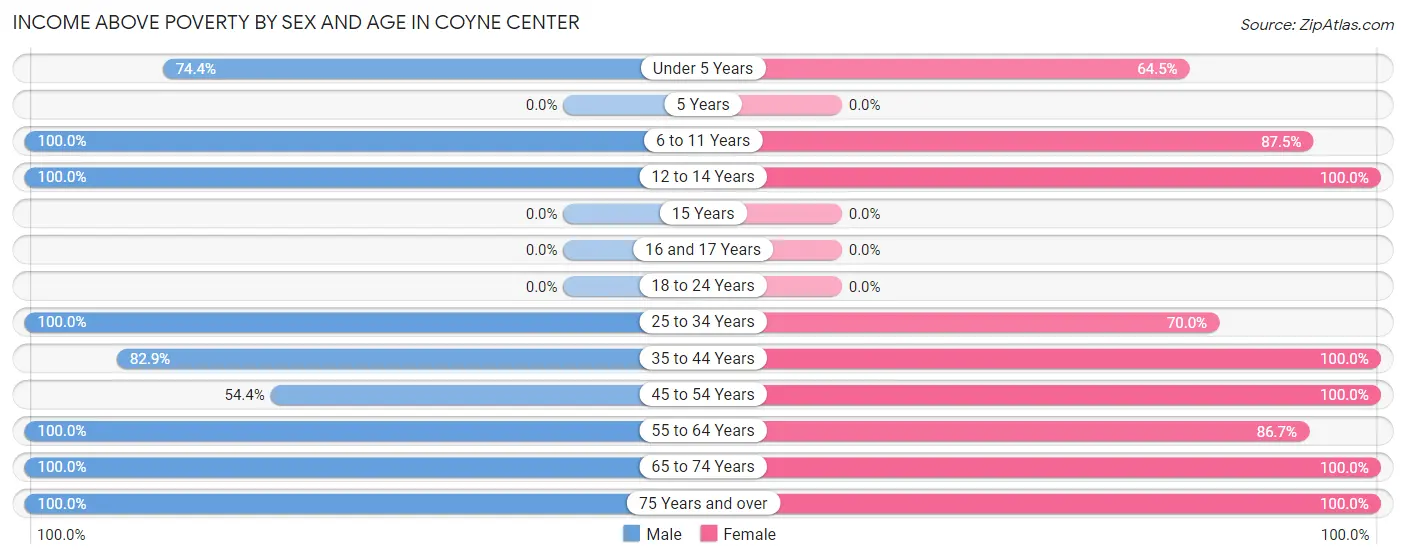
| Age Bracket | Male | Female |
| Under 5 Years | 29 (74.4%) | 20 (64.5%) |
| 5 Years | 0 (0.0%) | 0 (0.0%) |
| 6 to 11 Years | 17 (100.0%) | 91 (87.5%) |
| 12 to 14 Years | 24 (100.0%) | 9 (100.0%) |
| 15 Years | 0 (0.0%) | 0 (0.0%) |
| 16 and 17 Years | 0 (0.0%) | 0 (0.0%) |
| 18 to 24 Years | 0 (0.0%) | 0 (0.0%) |
| 25 to 34 Years | 18 (100.0%) | 35 (70.0%) |
| 35 to 44 Years | 58 (82.9%) | 51 (100.0%) |
| 45 to 54 Years | 25 (54.3%) | 27 (100.0%) |
| 55 to 64 Years | 69 (100.0%) | 65 (86.7%) |
| 65 to 74 Years | 132 (100.0%) | 111 (100.0%) |
| 75 Years and over | 28 (100.0%) | 34 (100.0%) |
| Total | 400 (90.3%) | 443 (87.7%) |
Income Below Poverty Among Married-Couple Families in Coyne Center
The poverty statistics for married-couple families in Coyne Center show that 5.5% or 15 of the total 273 families live below the poverty line. Families with 3 or 4 children have the highest poverty rate of 35.7%, comprising of 15 families. On the other hand, families with no children have the lowest poverty rate of 0.0%, which includes 0 families.
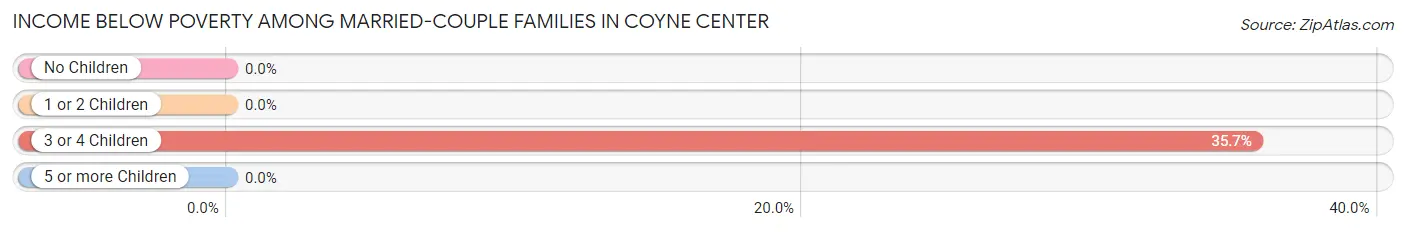
| Children | Above Poverty | Below Poverty |
| No Children | 202 (100.0%) | 0 (0.0%) |
| 1 or 2 Children | 29 (100.0%) | 0 (0.0%) |
| 3 or 4 Children | 27 (64.3%) | 15 (35.7%) |
| 5 or more Children | 0 (0.0%) | 0 (0.0%) |
| Total | 258 (94.5%) | 15 (5.5%) |
Income Below Poverty Among Single-Parent Households in Coyne Center
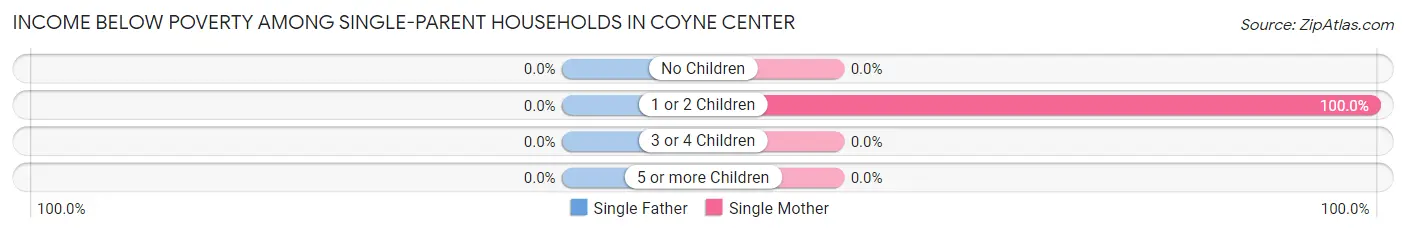
| Children | Single Father | Single Mother |
| No Children | 0 (0.0%) | 0 (0.0%) |
| 1 or 2 Children | 0 (0.0%) | 10 (100.0%) |
| 3 or 4 Children | 0 (0.0%) | 0 (0.0%) |
| 5 or more Children | 0 (0.0%) | 0 (0.0%) |
| Total | 0 (0.0%) | 10 (41.7%) |
Income Below Poverty Among Married-Couple vs Single-Parent Households in Coyne Center
The poverty data for Coyne Center shows that 15 of the married-couple family households (5.5%) and 10 of the single-parent households (22.2%) are living below the poverty level. Within the married-couple family households, those with 3 or 4 children have the highest poverty rate, with 15 households (35.7%) falling below the poverty line. Among the single-parent households, those with 1 or 2 children have the highest poverty rate, with 10 household (32.3%) living below poverty.
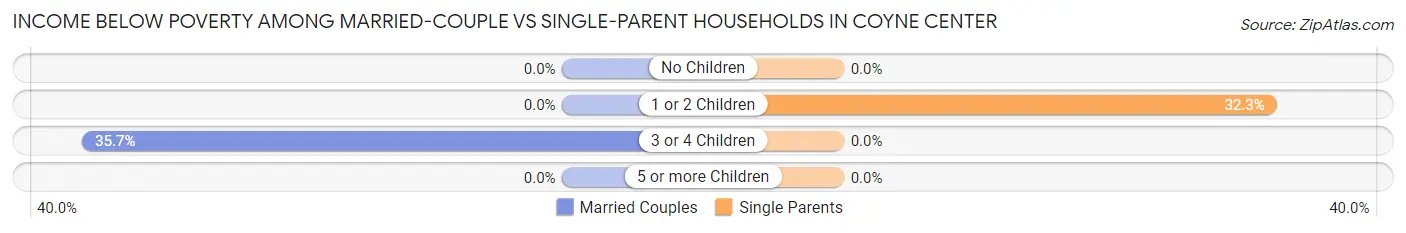
| Children | Married-Couple Families | Single-Parent Households |
| No Children | 0 (0.0%) | 0 (0.0%) |
| 1 or 2 Children | 0 (0.0%) | 10 (32.3%) |
| 3 or 4 Children | 15 (35.7%) | 0 (0.0%) |
| 5 or more Children | 0 (0.0%) | 0 (0.0%) |
| Total | 15 (5.5%) | 10 (22.2%) |
Employment Characteristics in Coyne Center
Employment by Class of Employer in Coyne Center
Among the 394 employed individuals in Coyne Center, private company employees (183 | 46.5%), not-for-profit organizations (101 | 25.6%), and self-employed (not incorporated) (52 | 13.2%) make up the most common classes of employment.
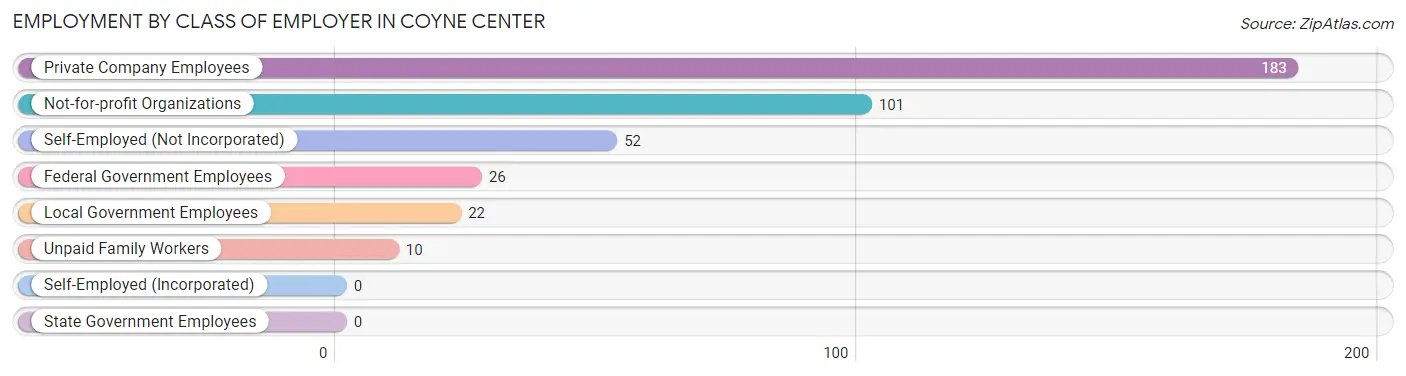
| Employer Class | # Employees | % Employees |
| Private Company Employees | 183 | 46.5% |
| Self-Employed (Incorporated) | 0 | 0.0% |
| Self-Employed (Not Incorporated) | 52 | 13.2% |
| Not-for-profit Organizations | 101 | 25.6% |
| Local Government Employees | 22 | 5.6% |
| State Government Employees | 0 | 0.0% |
| Federal Government Employees | 26 | 6.6% |
| Unpaid Family Workers | 10 | 2.5% |
| Total | 394 | 100.0% |
Employment Status by Age in Coyne Center
According to the labor force statistics for Coyne Center, out of the total population over 16 years of age (711), 56.4% or 401 individuals are in the labor force, with 1.7% or 7 of them unemployed. The age group with the highest labor force participation rate is 55 to 59 years, with 100.0% or 73 individuals in the labor force. Within the labor force, the 30 to 34 years age range has the highest percentage of unemployed individuals, with 23.3% or 7 of them being unemployed.
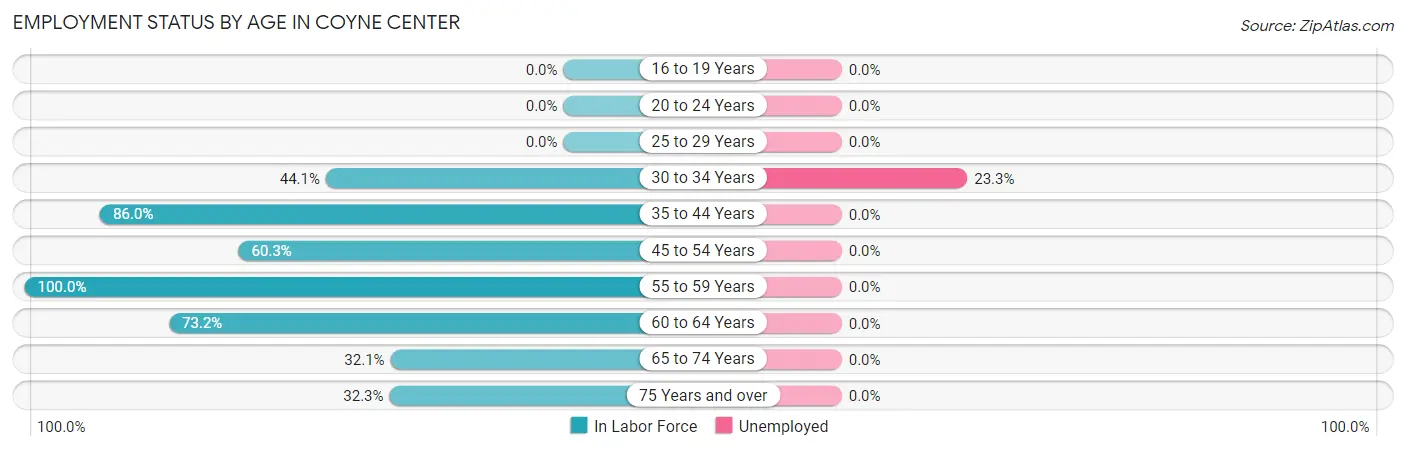
| Age Bracket | In Labor Force | Unemployed |
| 16 to 19 Years | 0 (0.0%) | 0 (0.0%) |
| 20 to 24 Years | 0 (0.0%) | 0 (0.0%) |
| 25 to 29 Years | 0 (0.0%) | 0 (0.0%) |
| 30 to 34 Years | 30 (44.1%) | 7 (23.3%) |
| 35 to 44 Years | 104 (86.0%) | 0 (0.0%) |
| 45 to 54 Years | 44 (60.3%) | 0 (0.0%) |
| 55 to 59 Years | 73 (100.0%) | 0 (0.0%) |
| 60 to 64 Years | 52 (73.2%) | 0 (0.0%) |
| 65 to 74 Years | 78 (32.1%) | 0 (0.0%) |
| 75 Years and over | 20 (32.3%) | 0 (0.0%) |
| Total | 401 (56.4%) | 7 (1.7%) |
Employment Status by Educational Attainment in Coyne Center
According to labor force statistics for Coyne Center, 74.6% of individuals (303) out of the total population between 25 and 64 years of age (406) are in the labor force, with 2.3% or 7 of them being unemployed. The group with the highest labor force participation rate are those with the educational attainment of college / associate degree, with 92.4% or 110 individuals in the labor force. Within the labor force, individuals with college / associate degree education have the highest percentage of unemployment, with 6.4% or 7 of them being unemployed.
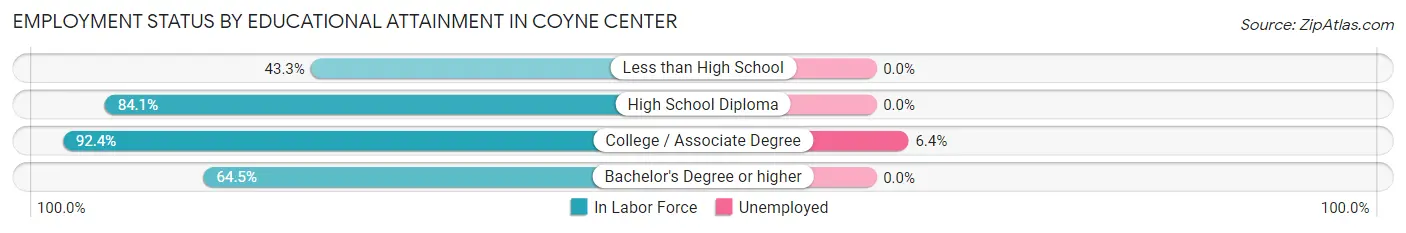
| Educational Attainment | In Labor Force | Unemployed |
| Less than High School | 29 (43.3%) | 0 (0.0%) |
| High School Diploma | 95 (84.1%) | 0 (0.0%) |
| College / Associate Degree | 110 (92.4%) | 8 (6.4%) |
| Bachelor's Degree or higher | 69 (64.5%) | 0 (0.0%) |
| Total | 303 (74.6%) | 9 (2.3%) |
Employment Occupations by Sex in Coyne Center
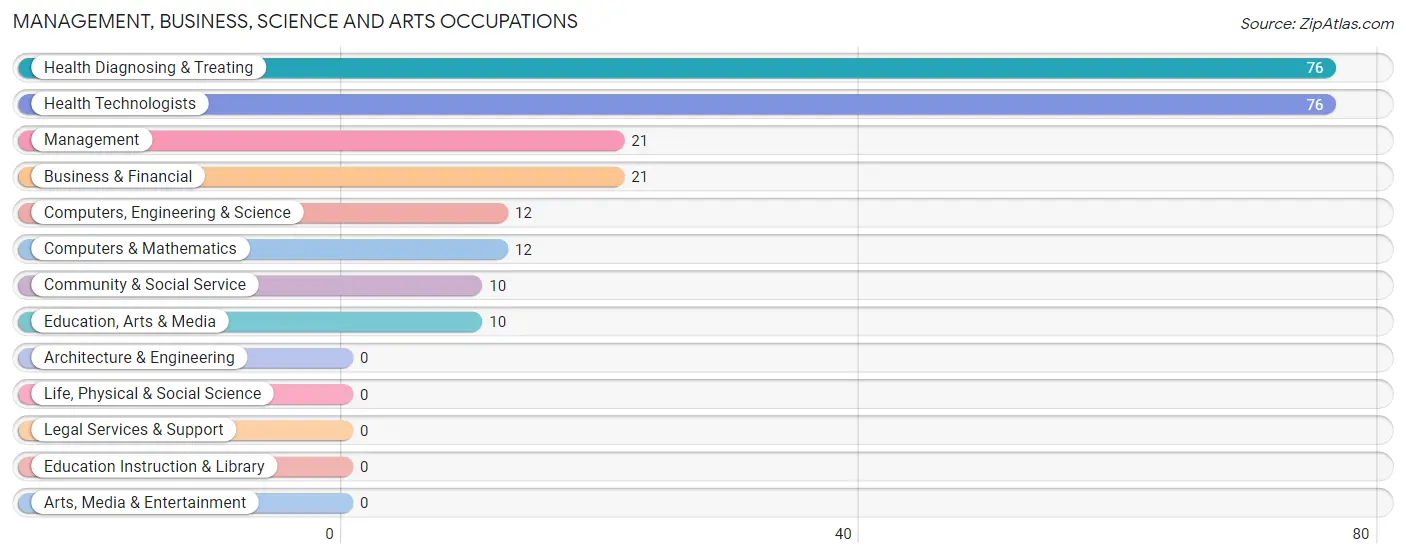
Management, Business, Science and Arts Occupations
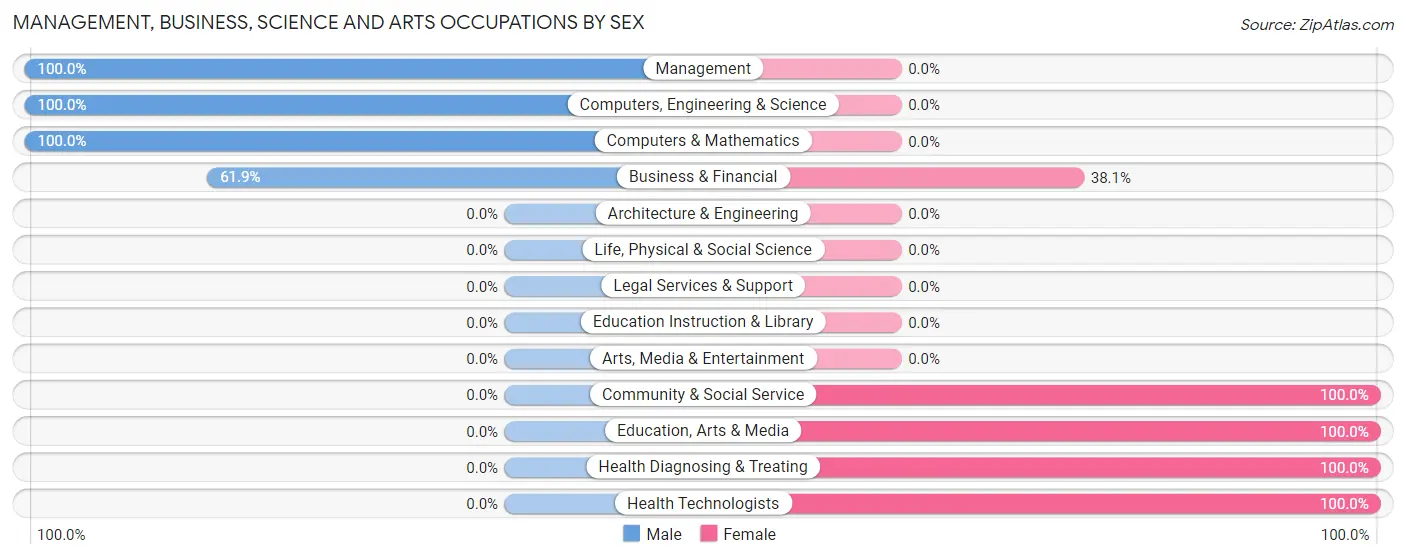
The most common Management, Business, Science and Arts occupations in Coyne Center are Health Diagnosing & Treating (76 | 19.3%), Health Technologists (76 | 19.3%), Management (21 | 5.3%), Business & Financial (21 | 5.3%), and Computers, Engineering & Science (12 | 3.0%).
Management, Business, Science and Arts Occupations by Sex
Within the Management, Business, Science and Arts occupations in Coyne Center, the most male-oriented occupations are Management (100.0%), Computers, Engineering & Science (100.0%), and Computers & Mathematics (100.0%), while the most female-oriented occupations are Community & Social Service (100.0%), Education, Arts & Media (100.0%), and Health Diagnosing & Treating (100.0%).
| Occupation | Male | Female |
| Management | 21 (100.0%) | 0 (0.0%) |
| Business & Financial | 13 (61.9%) | 8 (38.1%) |
| Computers, Engineering & Science | 12 (100.0%) | 0 (0.0%) |
| Computers & Mathematics | 12 (100.0%) | 0 (0.0%) |
| Architecture & Engineering | 0 (0.0%) | 0 (0.0%) |
| Life, Physical & Social Science | 0 (0.0%) | 0 (0.0%) |
| Community & Social Service | 0 (0.0%) | 10 (100.0%) |
| Education, Arts & Media | 0 (0.0%) | 10 (100.0%) |
| Legal Services & Support | 0 (0.0%) | 0 (0.0%) |
| Education Instruction & Library | 0 (0.0%) | 0 (0.0%) |
| Arts, Media & Entertainment | 0 (0.0%) | 0 (0.0%) |
| Health Diagnosing & Treating | 0 (0.0%) | 76 (100.0%) |
| Health Technologists | 0 (0.0%) | 76 (100.0%) |
| Total (Category) | 46 (32.9%) | 94 (67.1%) |
| Total (Overall) | 187 (47.5%) | 207 (52.5%) |
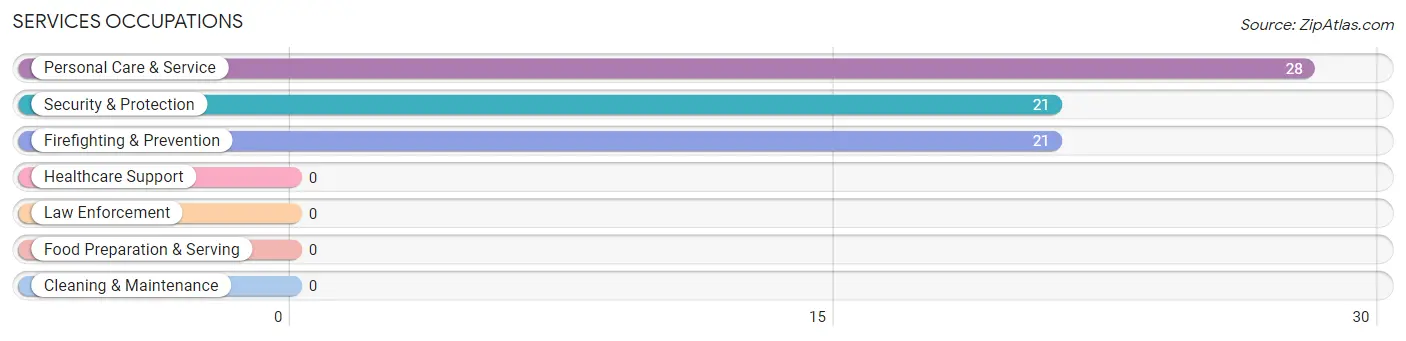
Services Occupations
The most common Services occupations in Coyne Center are Personal Care & Service (28 | 7.1%), Security & Protection (21 | 5.3%), and Firefighting & Prevention (21 | 5.3%).
Services Occupations by Sex
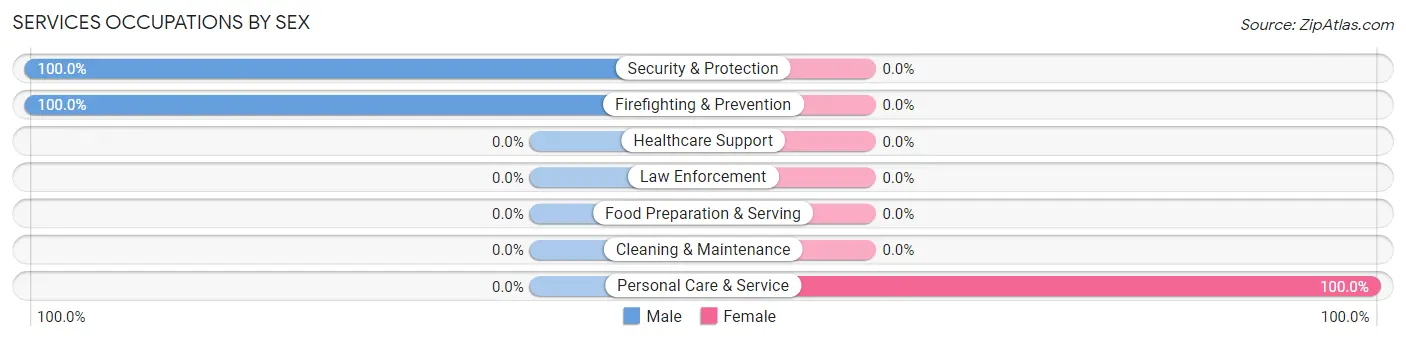
| Occupation | Male | Female |
| Healthcare Support | 0 (0.0%) | 0 (0.0%) |
| Security & Protection | 21 (100.0%) | 0 (0.0%) |
| Firefighting & Prevention | 21 (100.0%) | 0 (0.0%) |
| Law Enforcement | 0 (0.0%) | 0 (0.0%) |
| Food Preparation & Serving | 0 (0.0%) | 0 (0.0%) |
| Cleaning & Maintenance | 0 (0.0%) | 0 (0.0%) |
| Personal Care & Service | 0 (0.0%) | 28 (100.0%) |
| Total (Category) | 21 (42.9%) | 28 (57.1%) |
| Total (Overall) | 187 (47.5%) | 207 (52.5%) |
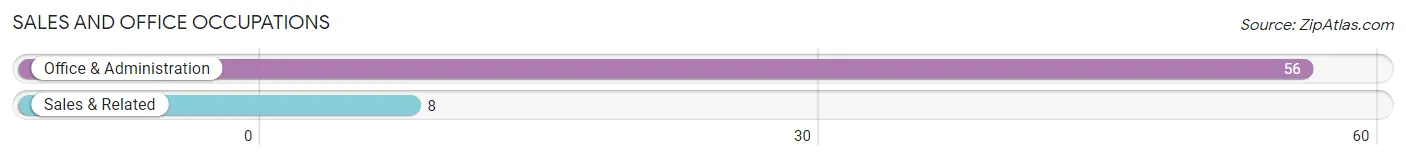
Sales and Office Occupations
The most common Sales and Office occupations in Coyne Center are Office & Administration (56 | 14.2%), and Sales & Related (8 | 2.0%).
Sales and Office Occupations by Sex
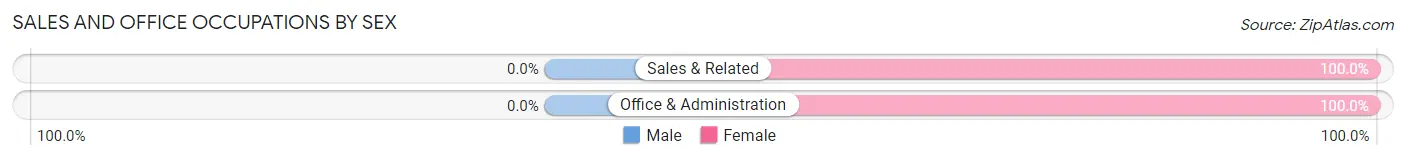
| Occupation | Male | Female |
| Sales & Related | 0 (0.0%) | 8 (100.0%) |
| Office & Administration | 0 (0.0%) | 56 (100.0%) |
| Total (Category) | 0 (0.0%) | 64 (100.0%) |
| Total (Overall) | 187 (47.5%) | 207 (52.5%) |
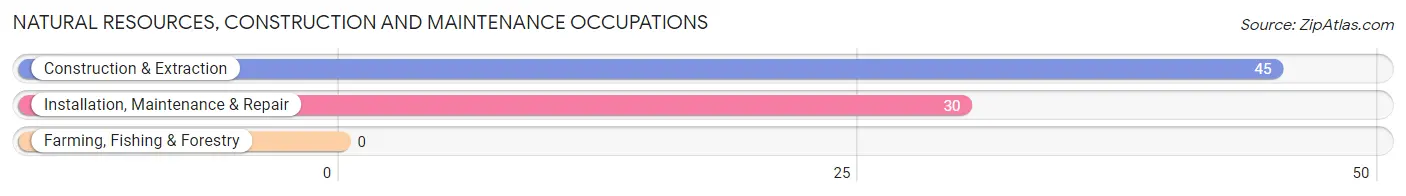
Natural Resources, Construction and Maintenance Occupations
The most common Natural Resources, Construction and Maintenance occupations in Coyne Center are Construction & Extraction (45 | 11.4%), and Installation, Maintenance & Repair (30 | 7.6%).
Natural Resources, Construction and Maintenance Occupations by Sex
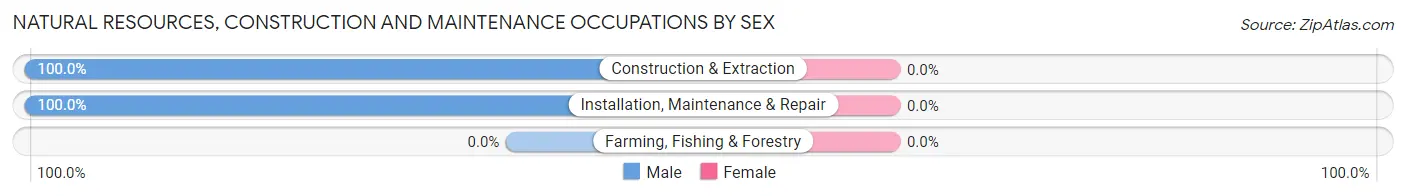
| Occupation | Male | Female |
| Farming, Fishing & Forestry | 0 (0.0%) | 0 (0.0%) |
| Construction & Extraction | 45 (100.0%) | 0 (0.0%) |
| Installation, Maintenance & Repair | 30 (100.0%) | 0 (0.0%) |
| Total (Category) | 75 (100.0%) | 0 (0.0%) |
| Total (Overall) | 187 (47.5%) | 207 (52.5%) |
Production, Transportation and Moving Occupations
The most common Production, Transportation and Moving occupations in Coyne Center are Production (33 | 8.4%), Material Moving (24 | 6.1%), and Transportation (9 | 2.3%).
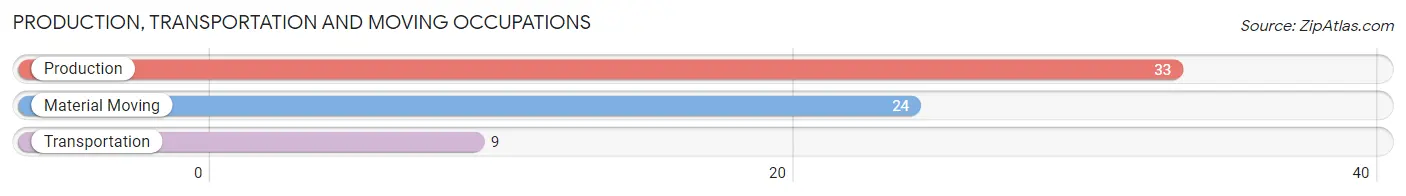
Production, Transportation and Moving Occupations by Sex
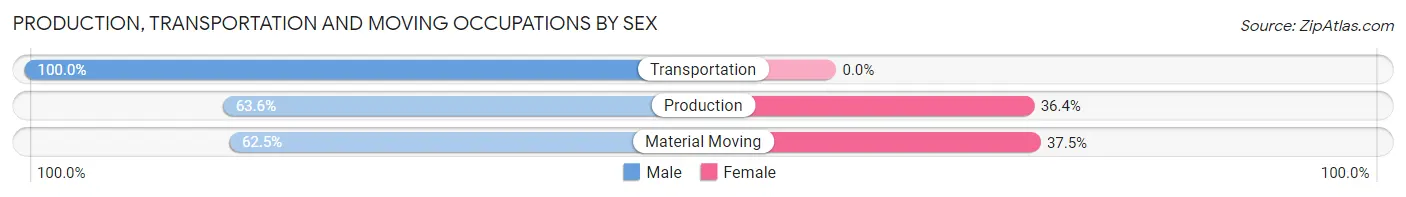
| Occupation | Male | Female |
| Production | 21 (63.6%) | 12 (36.4%) |
| Transportation | 9 (100.0%) | 0 (0.0%) |
| Material Moving | 15 (62.5%) | 9 (37.5%) |
| Total (Category) | 45 (68.2%) | 21 (31.8%) |
| Total (Overall) | 187 (47.5%) | 207 (52.5%) |
Employment Industries by Sex in Coyne Center
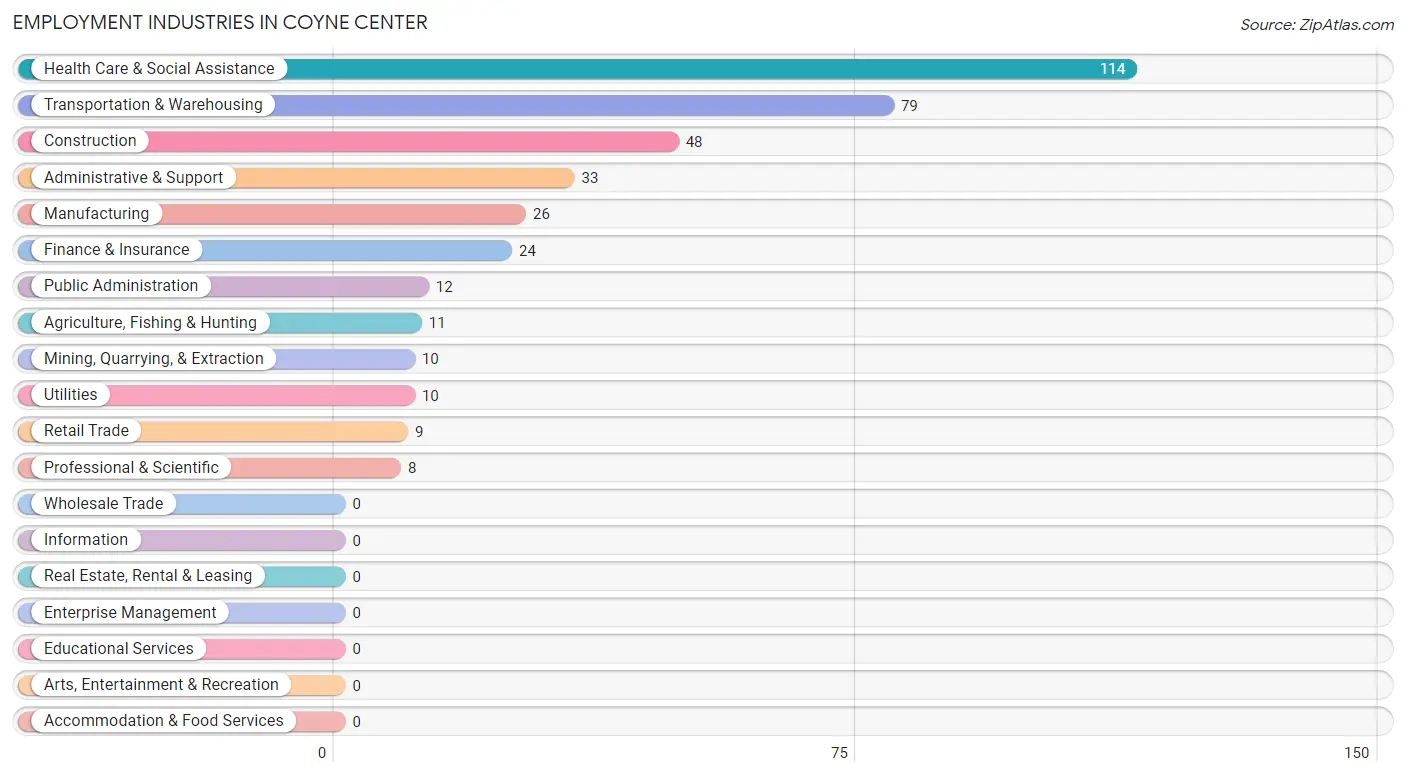
Employment Industries in Coyne Center
The major employment industries in Coyne Center include Health Care & Social Assistance (114 | 28.9%), Transportation & Warehousing (79 | 20.1%), Construction (48 | 12.2%), Administrative & Support (33 | 8.4%), and Manufacturing (26 | 6.6%).
Employment Industries by Sex in Coyne Center
The Coyne Center industries that see more men than women are Agriculture, Fishing & Hunting (100.0%), Mining, Quarrying, & Extraction (100.0%), and Construction (100.0%), whereas the industries that tend to have a higher number of women are Retail Trade (100.0%), Professional & Scientific (100.0%), and Health Care & Social Assistance (100.0%).
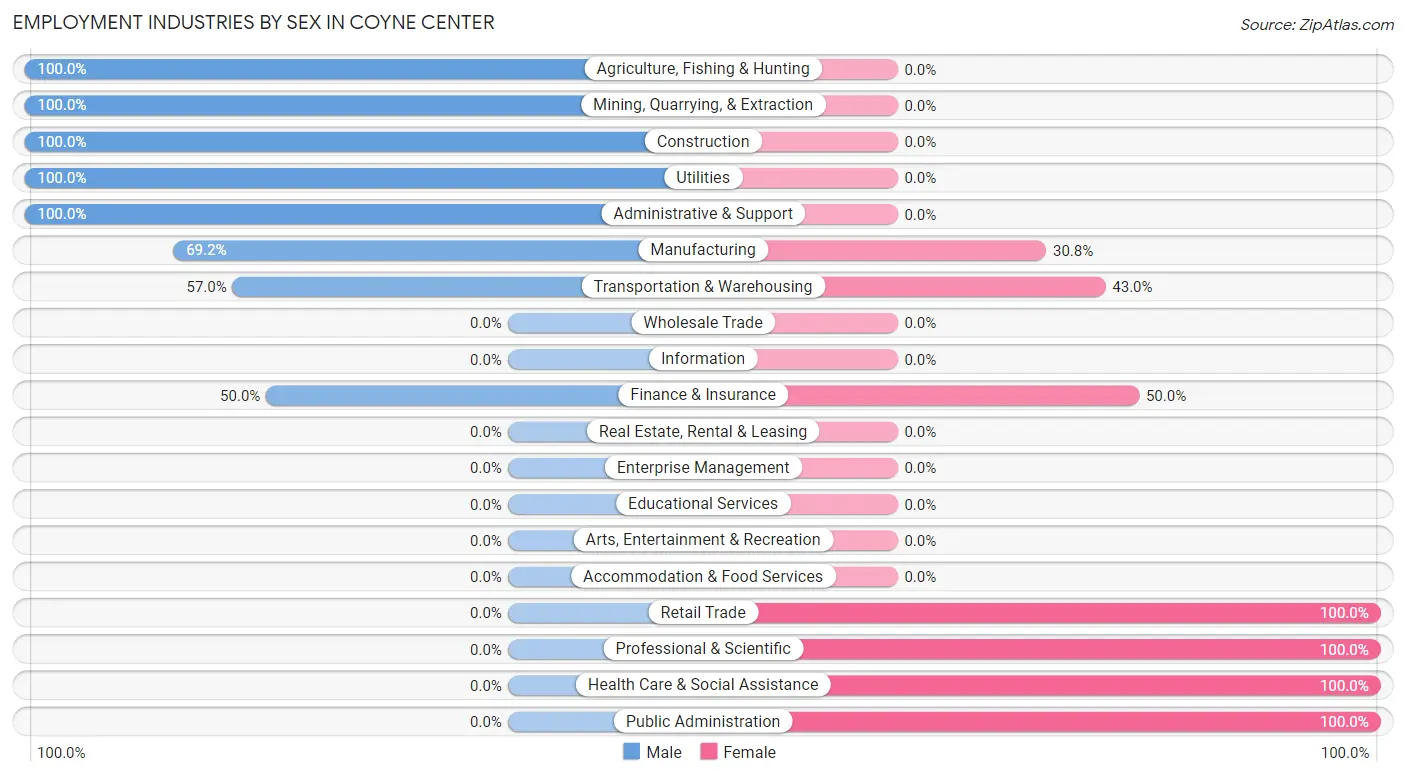
| Industry | Male | Female |
| Agriculture, Fishing & Hunting | 11 (100.0%) | 0 (0.0%) |
| Mining, Quarrying, & Extraction | 10 (100.0%) | 0 (0.0%) |
| Construction | 48 (100.0%) | 0 (0.0%) |
| Manufacturing | 18 (69.2%) | 8 (30.8%) |
| Wholesale Trade | 0 (0.0%) | 0 (0.0%) |
| Retail Trade | 0 (0.0%) | 9 (100.0%) |
| Transportation & Warehousing | 45 (57.0%) | 34 (43.0%) |
| Utilities | 10 (100.0%) | 0 (0.0%) |
| Information | 0 (0.0%) | 0 (0.0%) |
| Finance & Insurance | 12 (50.0%) | 12 (50.0%) |
| Real Estate, Rental & Leasing | 0 (0.0%) | 0 (0.0%) |
| Professional & Scientific | 0 (0.0%) | 8 (100.0%) |
| Enterprise Management | 0 (0.0%) | 0 (0.0%) |
| Administrative & Support | 33 (100.0%) | 0 (0.0%) |
| Educational Services | 0 (0.0%) | 0 (0.0%) |
| Health Care & Social Assistance | 0 (0.0%) | 114 (100.0%) |
| Arts, Entertainment & Recreation | 0 (0.0%) | 0 (0.0%) |
| Accommodation & Food Services | 0 (0.0%) | 0 (0.0%) |
| Public Administration | 0 (0.0%) | 12 (100.0%) |
| Total | 187 (47.5%) | 207 (52.5%) |
Education in Coyne Center
School Enrollment in Coyne Center
The most common levels of schooling among the 194 students in Coyne Center are middle school (80 | 41.2%), elementary school (74 | 38.1%), and nursery / preschool (18 | 9.3%).
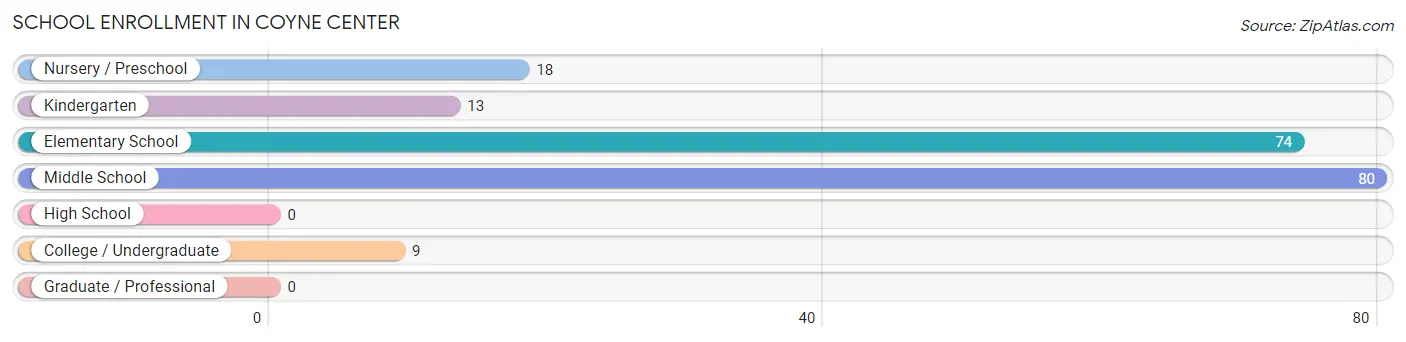
| School Level | # Students | % Students |
| Nursery / Preschool | 18 | 9.3% |
| Kindergarten | 13 | 6.7% |
| Elementary School | 74 | 38.1% |
| Middle School | 80 | 41.2% |
| High School | 0 | 0.0% |
| College / Undergraduate | 9 | 4.6% |
| Graduate / Professional | 0 | 0.0% |
| Total | 194 | 100.0% |
School Enrollment by Age by Funding Source in Coyne Center
Out of a total of 194 students who are enrolled in schools in Coyne Center, 53 (27.3%) attend a private institution, while the remaining 141 (72.7%) are enrolled in public schools. The age group of 3 to 4 year olds has the highest likelihood of being enrolled in private schools, with 18 (100.0% in the age bracket) enrolled. Conversely, the age group of 35 years and over has the lowest likelihood of being enrolled in a private school, with 9 (100.0% in the age bracket) attending a public institution.
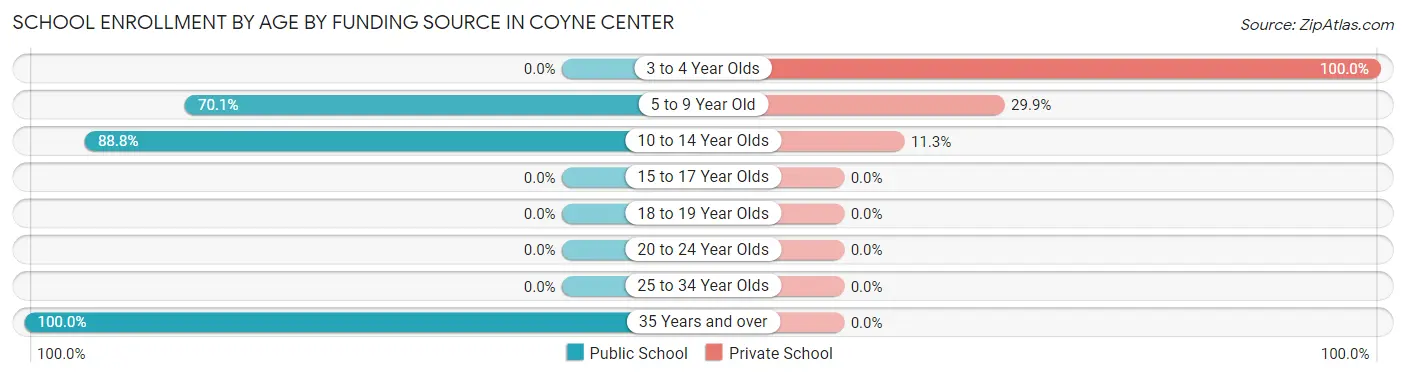
| Age Bracket | Public School | Private School |
| 3 to 4 Year Olds | 0 (0.0%) | 18 (100.0%) |
| 5 to 9 Year Old | 61 (70.1%) | 26 (29.9%) |
| 10 to 14 Year Olds | 71 (88.7%) | 9 (11.3%) |
| 15 to 17 Year Olds | 0 (0.0%) | 0 (0.0%) |
| 18 to 19 Year Olds | 0 (0.0%) | 0 (0.0%) |
| 20 to 24 Year Olds | 0 (0.0%) | 0 (0.0%) |
| 25 to 34 Year Olds | 0 (0.0%) | 0 (0.0%) |
| 35 Years and over | 9 (100.0%) | 0 (0.0%) |
| Total | 141 (72.7%) | 53 (27.3%) |
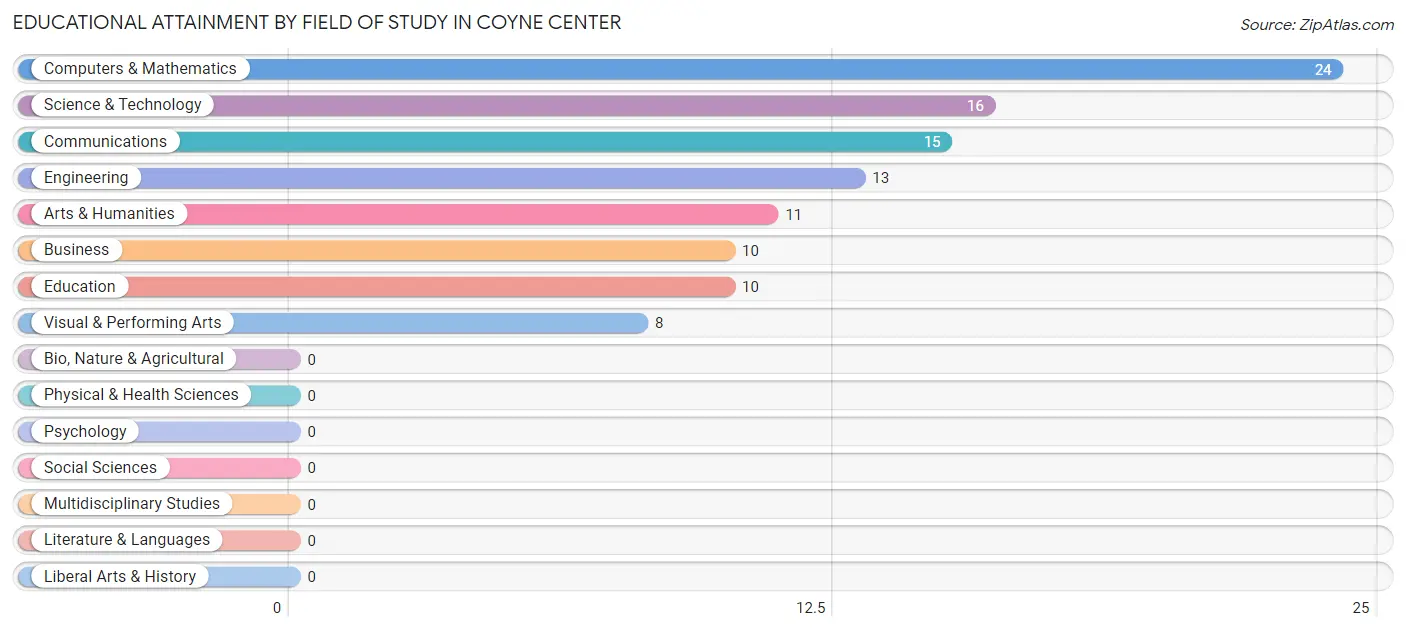
Educational Attainment by Field of Study in Coyne Center
Computers & mathematics (24 | 22.4%), science & technology (16 | 14.9%), communications (15 | 14.0%), engineering (13 | 12.1%), and arts & humanities (11 | 10.3%) are the most common fields of study among 107 individuals in Coyne Center who have obtained a bachelor's degree or higher.
| Field of Study | # Graduates | % Graduates |
| Computers & Mathematics | 24 | 22.4% |
| Bio, Nature & Agricultural | 0 | 0.0% |
| Physical & Health Sciences | 0 | 0.0% |
| Psychology | 0 | 0.0% |
| Social Sciences | 0 | 0.0% |
| Engineering | 13 | 12.1% |
| Multidisciplinary Studies | 0 | 0.0% |
| Science & Technology | 16 | 14.9% |
| Business | 10 | 9.3% |
| Education | 10 | 9.3% |
| Literature & Languages | 0 | 0.0% |
| Liberal Arts & History | 0 | 0.0% |
| Visual & Performing Arts | 8 | 7.5% |
| Communications | 15 | 14.0% |
| Arts & Humanities | 11 | 10.3% |
| Total | 107 | 100.0% |
Transportation & Commute in Coyne Center
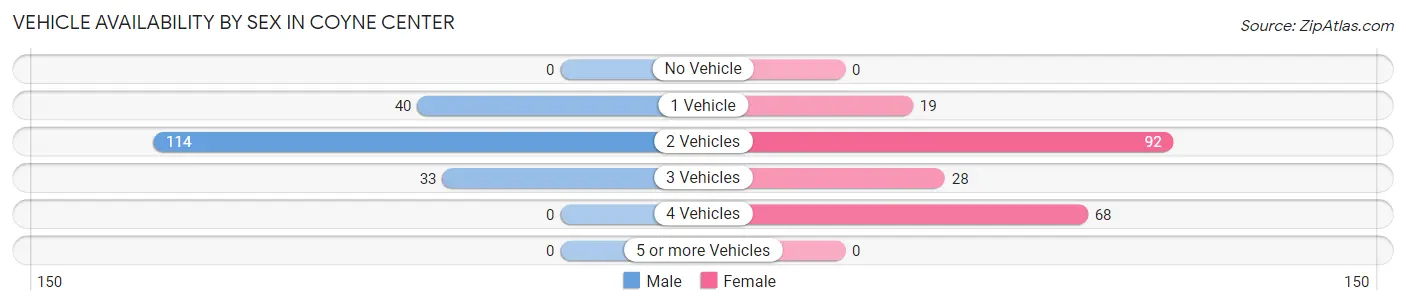
Vehicle Availability by Sex in Coyne Center
The most prevalent vehicle ownership categories in Coyne Center are males with 2 vehicles (114, accounting for 61.0%) and females with 2 vehicles (92, making up 55.1%).
| Vehicles Available | Male | Female |
| No Vehicle | 0 (0.0%) | 0 (0.0%) |
| 1 Vehicle | 40 (21.4%) | 19 (9.2%) |
| 2 Vehicles | 114 (61.0%) | 92 (44.4%) |
| 3 Vehicles | 33 (17.6%) | 28 (13.5%) |
| 4 Vehicles | 0 (0.0%) | 68 (32.9%) |
| 5 or more Vehicles | 0 (0.0%) | 0 (0.0%) |
| Total | 187 (100.0%) | 207 (100.0%) |
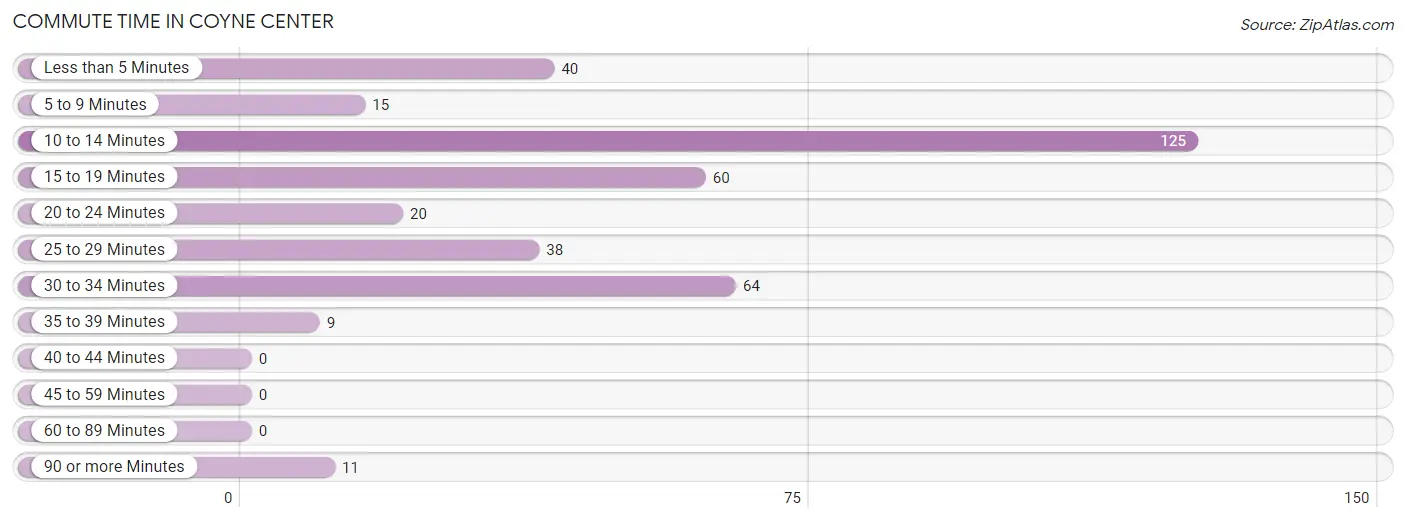
Commute Time in Coyne Center
The most frequently occuring commute durations in Coyne Center are 10 to 14 minutes (125 commuters, 32.7%), 30 to 34 minutes (64 commuters, 16.8%), and 15 to 19 minutes (60 commuters, 15.7%).
| Commute Time | # Commuters | % Commuters |
| Less than 5 Minutes | 40 | 10.5% |
| 5 to 9 Minutes | 15 | 3.9% |
| 10 to 14 Minutes | 125 | 32.7% |
| 15 to 19 Minutes | 60 | 15.7% |
| 20 to 24 Minutes | 20 | 5.2% |
| 25 to 29 Minutes | 38 | 10.0% |
| 30 to 34 Minutes | 64 | 16.8% |
| 35 to 39 Minutes | 9 | 2.4% |
| 40 to 44 Minutes | 0 | 0.0% |
| 45 to 59 Minutes | 0 | 0.0% |
| 60 to 89 Minutes | 0 | 0.0% |
| 90 or more Minutes | 11 | 2.9% |
Commute Time by Sex in Coyne Center
The most common commute times in Coyne Center are 30 to 34 minutes (56 commuters, 29.9%) for males and 10 to 14 minutes (96 commuters, 49.2%) for females.
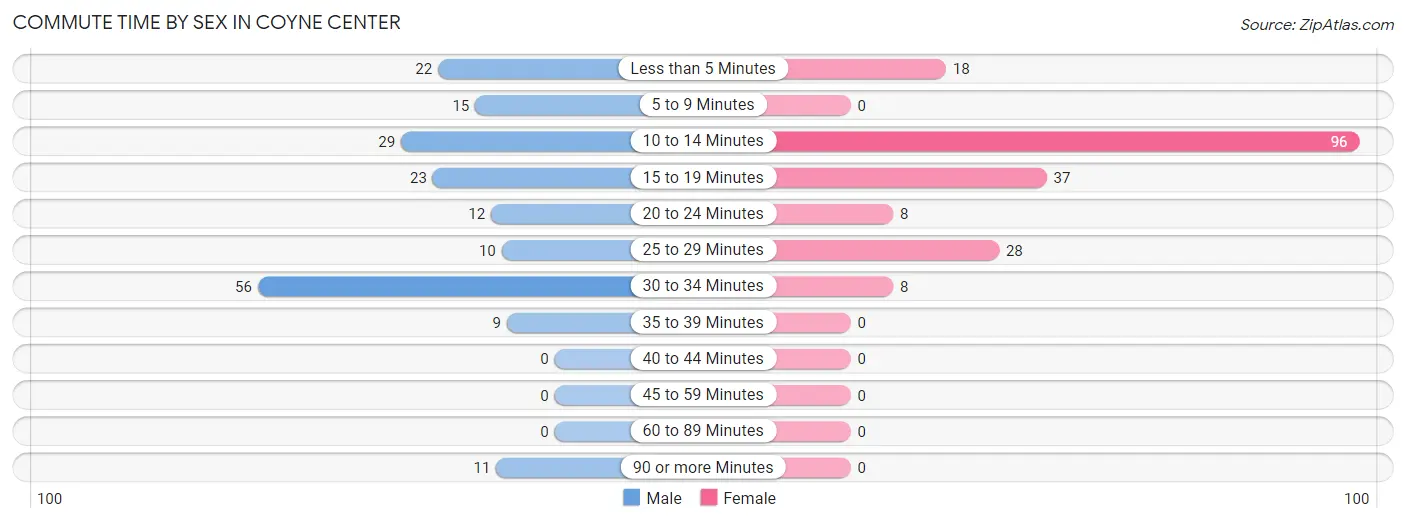
| Commute Time | Male | Female |
| Less than 5 Minutes | 22 (11.8%) | 18 (9.2%) |
| 5 to 9 Minutes | 15 (8.0%) | 0 (0.0%) |
| 10 to 14 Minutes | 29 (15.5%) | 96 (49.2%) |
| 15 to 19 Minutes | 23 (12.3%) | 37 (19.0%) |
| 20 to 24 Minutes | 12 (6.4%) | 8 (4.1%) |
| 25 to 29 Minutes | 10 (5.3%) | 28 (14.4%) |
| 30 to 34 Minutes | 56 (29.9%) | 8 (4.1%) |
| 35 to 39 Minutes | 9 (4.8%) | 0 (0.0%) |
| 40 to 44 Minutes | 0 (0.0%) | 0 (0.0%) |
| 45 to 59 Minutes | 0 (0.0%) | 0 (0.0%) |
| 60 to 89 Minutes | 0 (0.0%) | 0 (0.0%) |
| 90 or more Minutes | 11 (5.9%) | 0 (0.0%) |
Time of Departure to Work by Sex in Coyne Center
The most frequent times of departure to work in Coyne Center are 6:00 AM to 6:29 AM (55, 29.4%) for males and 4:00 PM to 11:59 PM (95, 48.7%) for females.
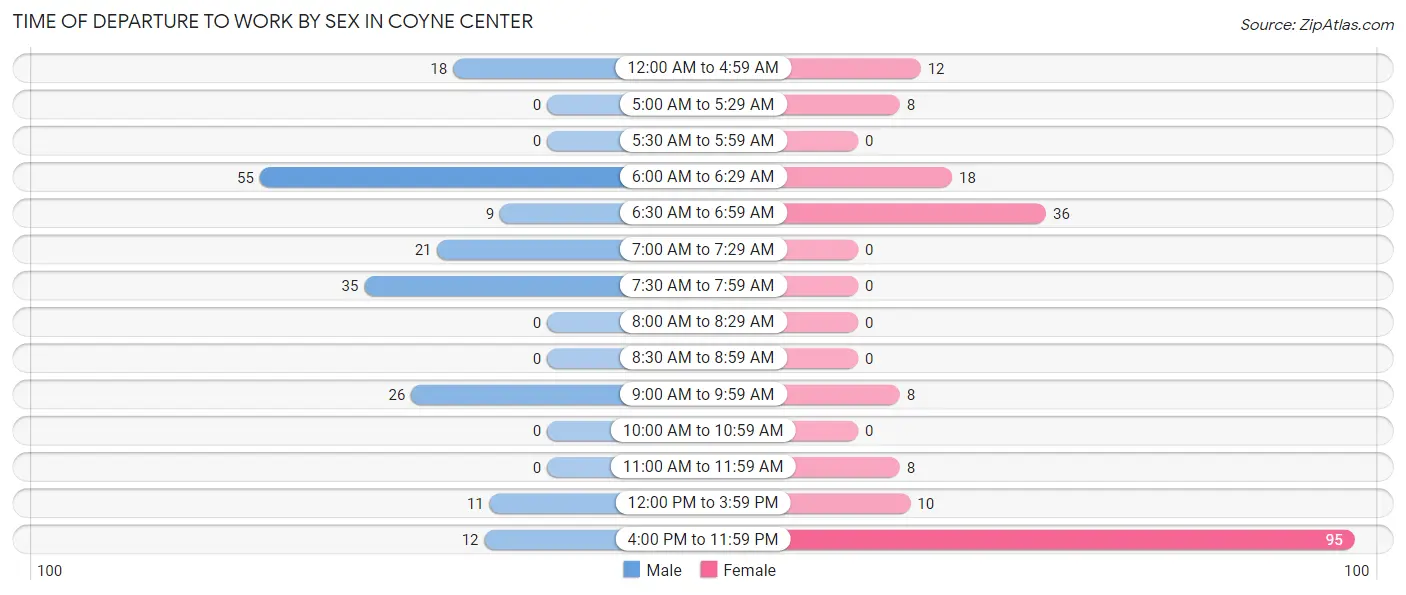
| Time of Departure | Male | Female |
| 12:00 AM to 4:59 AM | 18 (9.6%) | 12 (6.1%) |
| 5:00 AM to 5:29 AM | 0 (0.0%) | 8 (4.1%) |
| 5:30 AM to 5:59 AM | 0 (0.0%) | 0 (0.0%) |
| 6:00 AM to 6:29 AM | 55 (29.4%) | 18 (9.2%) |
| 6:30 AM to 6:59 AM | 9 (4.8%) | 36 (18.5%) |
| 7:00 AM to 7:29 AM | 21 (11.2%) | 0 (0.0%) |
| 7:30 AM to 7:59 AM | 35 (18.7%) | 0 (0.0%) |
| 8:00 AM to 8:29 AM | 0 (0.0%) | 0 (0.0%) |
| 8:30 AM to 8:59 AM | 0 (0.0%) | 0 (0.0%) |
| 9:00 AM to 9:59 AM | 26 (13.9%) | 8 (4.1%) |
| 10:00 AM to 10:59 AM | 0 (0.0%) | 0 (0.0%) |
| 11:00 AM to 11:59 AM | 0 (0.0%) | 8 (4.1%) |
| 12:00 PM to 3:59 PM | 11 (5.9%) | 10 (5.1%) |
| 4:00 PM to 11:59 PM | 12 (6.4%) | 95 (48.7%) |
| Total | 187 (100.0%) | 195 (100.0%) |
Housing Occupancy in Coyne Center
Occupancy by Ownership in Coyne Center
Of the total 372 dwellings in Coyne Center, owner-occupied units account for 344 (92.5%), while renter-occupied units make up 28 (7.5%).
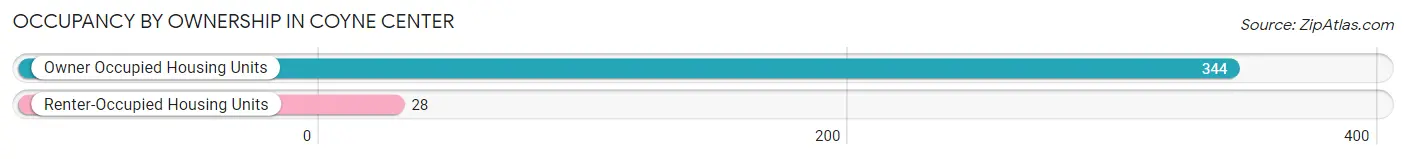
| Occupancy | # Housing Units | % Housing Units |
| Owner Occupied Housing Units | 344 | 92.5% |
| Renter-Occupied Housing Units | 28 | 7.5% |
| Total Occupied Housing Units | 372 | 100.0% |
Occupancy by Household Size in Coyne Center
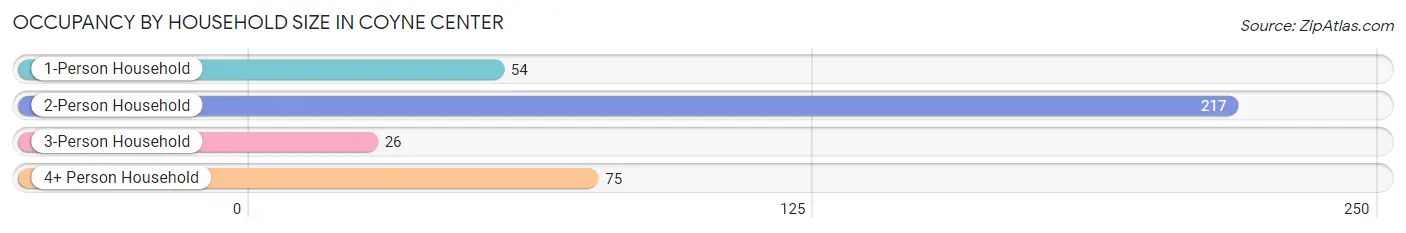
| Household Size | # Housing Units | % Housing Units |
| 1-Person Household | 54 | 14.5% |
| 2-Person Household | 217 | 58.3% |
| 3-Person Household | 26 | 7.0% |
| 4+ Person Household | 75 | 20.2% |
| Total Housing Units | 372 | 100.0% |
Occupancy by Ownership by Household Size in Coyne Center
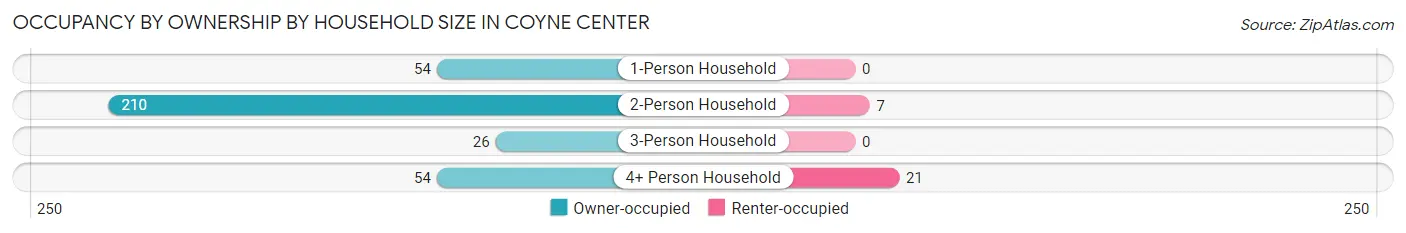
| Household Size | Owner-occupied | Renter-occupied |
| 1-Person Household | 54 (100.0%) | 0 (0.0%) |
| 2-Person Household | 210 (96.8%) | 7 (3.2%) |
| 3-Person Household | 26 (100.0%) | 0 (0.0%) |
| 4+ Person Household | 54 (72.0%) | 21 (28.0%) |
| Total Housing Units | 344 (92.5%) | 28 (7.5%) |
Occupancy by Educational Attainment in Coyne Center
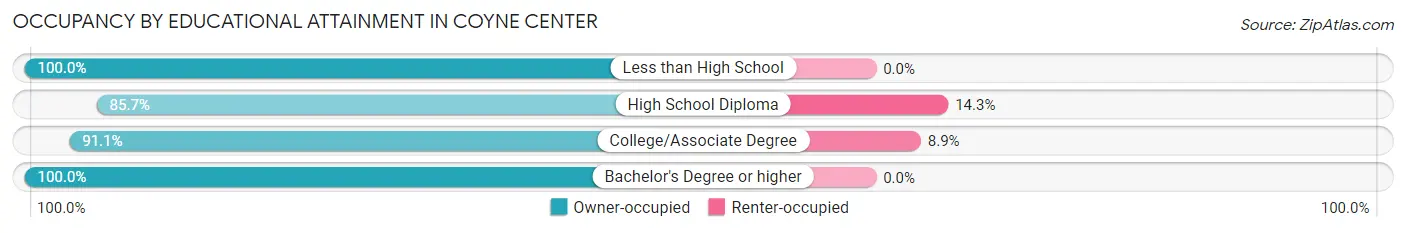
| Household Size | Owner-occupied | Renter-occupied |
| Less than High School | 22 (100.0%) | 0 (0.0%) |
| High School Diploma | 42 (85.7%) | 7 (14.3%) |
| College/Associate Degree | 216 (91.1%) | 21 (8.9%) |
| Bachelor's Degree or higher | 64 (100.0%) | 0 (0.0%) |
Occupancy by Age of Householder in Coyne Center
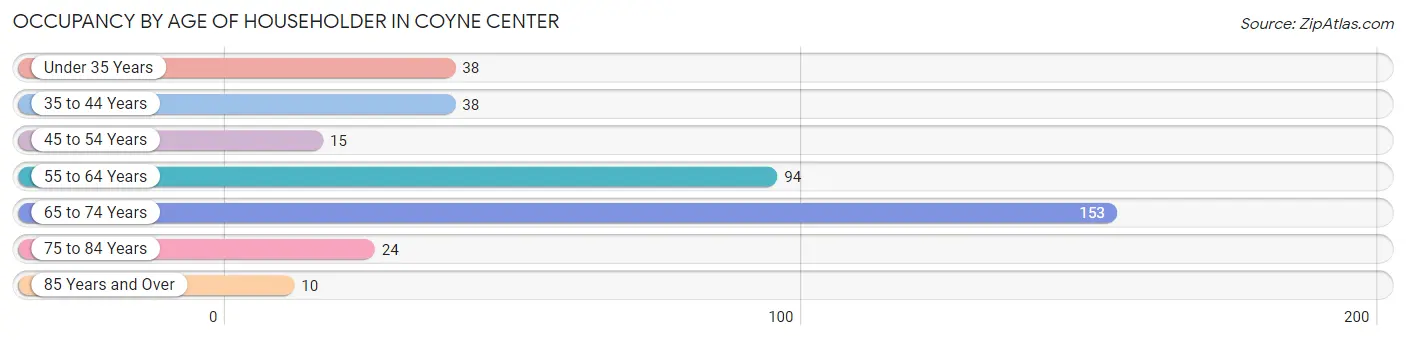
| Age Bracket | # Households | % Households |
| Under 35 Years | 38 | 10.2% |
| 35 to 44 Years | 38 | 10.2% |
| 45 to 54 Years | 15 | 4.0% |
| 55 to 64 Years | 94 | 25.3% |
| 65 to 74 Years | 153 | 41.1% |
| 75 to 84 Years | 24 | 6.5% |
| 85 Years and Over | 10 | 2.7% |
| Total | 372 | 100.0% |
Housing Finances in Coyne Center
Median Income by Occupancy in Coyne Center
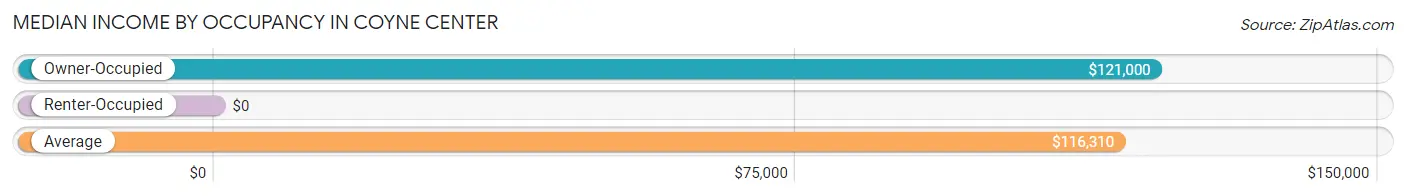
| Occupancy Type | # Households | Median Income |
| Owner-Occupied | 344 (92.5%) | $121,000 |
| Renter-Occupied | 28 (7.5%) | $0 |
| Average | 372 (100.0%) | $116,310 |
Occupancy by Householder Income Bracket in Coyne Center
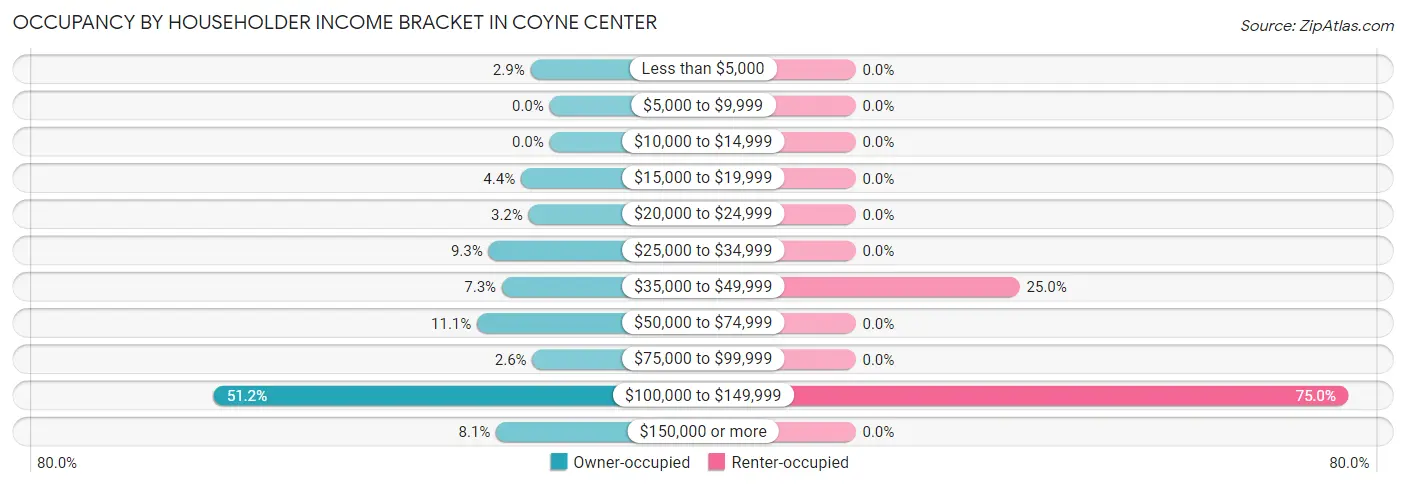
| Income Bracket | Owner-occupied | Renter-occupied |
| Less than $5,000 | 10 (2.9%) | 0 (0.0%) |
| $5,000 to $9,999 | 0 (0.0%) | 0 (0.0%) |
| $10,000 to $14,999 | 0 (0.0%) | 0 (0.0%) |
| $15,000 to $19,999 | 15 (4.4%) | 0 (0.0%) |
| $20,000 to $24,999 | 11 (3.2%) | 0 (0.0%) |
| $25,000 to $34,999 | 32 (9.3%) | 0 (0.0%) |
| $35,000 to $49,999 | 25 (7.3%) | 7 (25.0%) |
| $50,000 to $74,999 | 38 (11.1%) | 0 (0.0%) |
| $75,000 to $99,999 | 9 (2.6%) | 0 (0.0%) |
| $100,000 to $149,999 | 176 (51.2%) | 21 (75.0%) |
| $150,000 or more | 28 (8.1%) | 0 (0.0%) |
| Total | 344 (100.0%) | 28 (100.0%) |
Monthly Housing Cost Tiers in Coyne Center
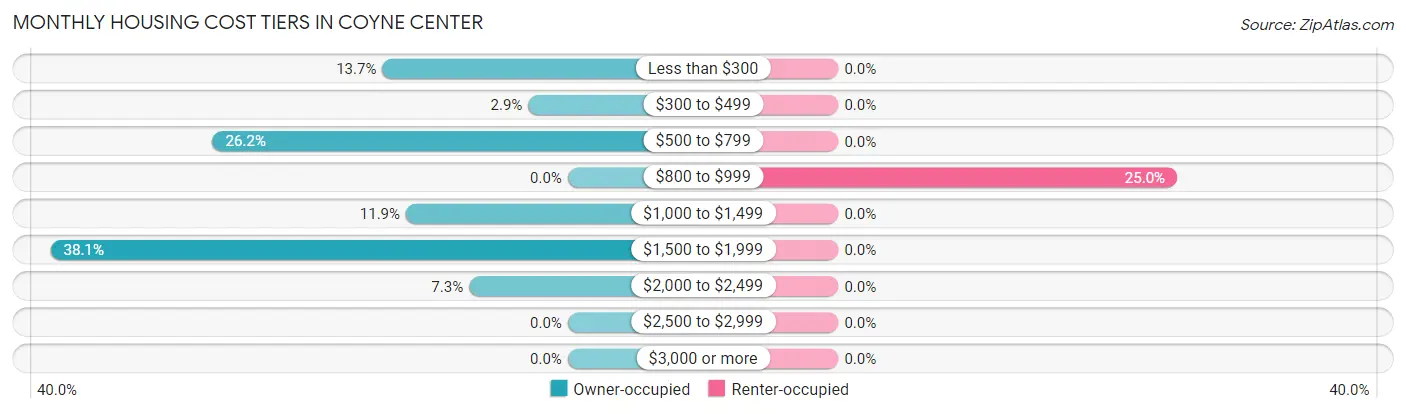
| Monthly Cost | Owner-occupied | Renter-occupied |
| Less than $300 | 47 (13.7%) | 0 (0.0%) |
| $300 to $499 | 10 (2.9%) | 0 (0.0%) |
| $500 to $799 | 90 (26.2%) | 0 (0.0%) |
| $800 to $999 | 0 (0.0%) | 7 (25.0%) |
| $1,000 to $1,499 | 41 (11.9%) | 0 (0.0%) |
| $1,500 to $1,999 | 131 (38.1%) | 0 (0.0%) |
| $2,000 to $2,499 | 25 (7.3%) | 0 (0.0%) |
| $2,500 to $2,999 | 0 (0.0%) | 0 (0.0%) |
| $3,000 or more | 0 (0.0%) | 0 (0.0%) |
| Total | 344 (100.0%) | 28 (100.0%) |
Physical Housing Characteristics in Coyne Center
Housing Structures in Coyne Center
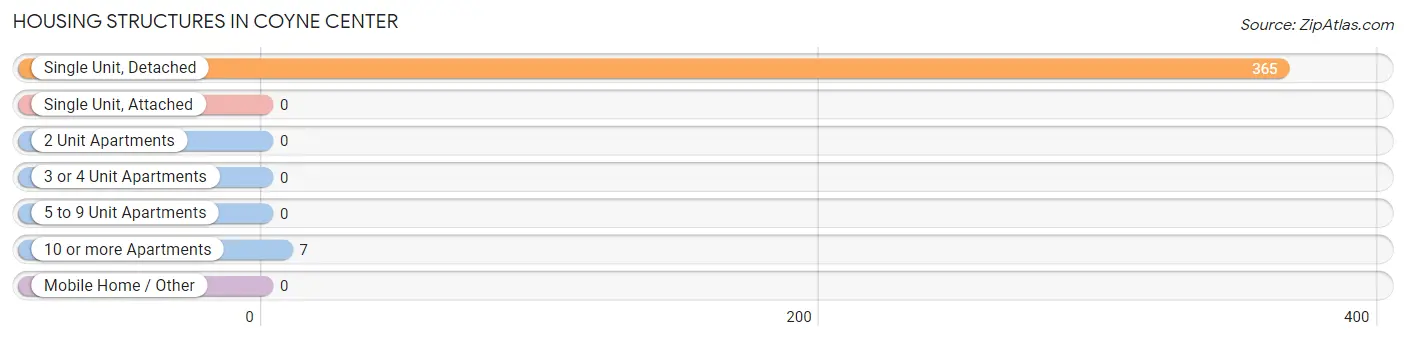
| Structure Type | # Housing Units | % Housing Units |
| Single Unit, Detached | 365 | 98.1% |
| Single Unit, Attached | 0 | 0.0% |
| 2 Unit Apartments | 0 | 0.0% |
| 3 or 4 Unit Apartments | 0 | 0.0% |
| 5 to 9 Unit Apartments | 0 | 0.0% |
| 10 or more Apartments | 7 | 1.9% |
| Mobile Home / Other | 0 | 0.0% |
| Total | 372 | 100.0% |
Housing Structures by Occupancy in Coyne Center
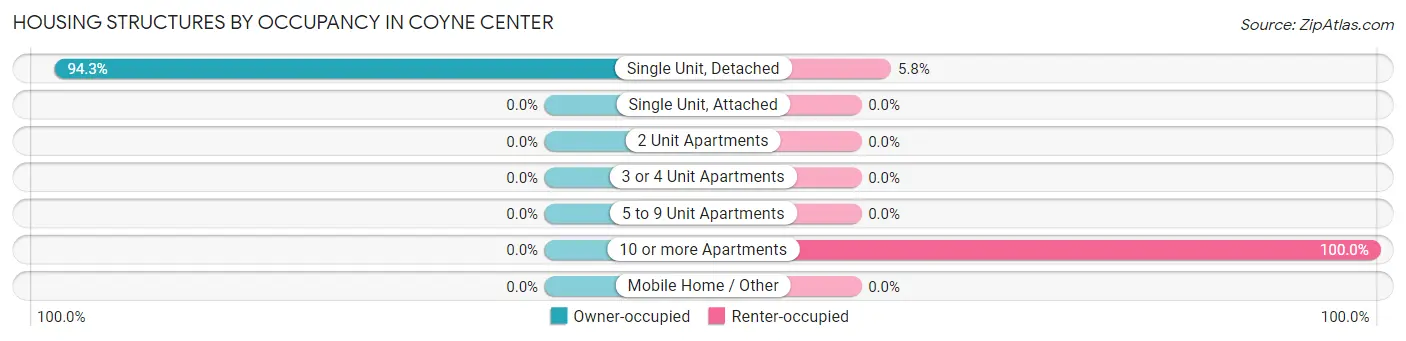
| Structure Type | Owner-occupied | Renter-occupied |
| Single Unit, Detached | 344 (94.3%) | 21 (5.8%) |
| Single Unit, Attached | 0 (0.0%) | 0 (0.0%) |
| 2 Unit Apartments | 0 (0.0%) | 0 (0.0%) |
| 3 or 4 Unit Apartments | 0 (0.0%) | 0 (0.0%) |
| 5 to 9 Unit Apartments | 0 (0.0%) | 0 (0.0%) |
| 10 or more Apartments | 0 (0.0%) | 7 (100.0%) |
| Mobile Home / Other | 0 (0.0%) | 0 (0.0%) |
| Total | 344 (92.5%) | 28 (7.5%) |
Housing Structures by Number of Rooms in Coyne Center
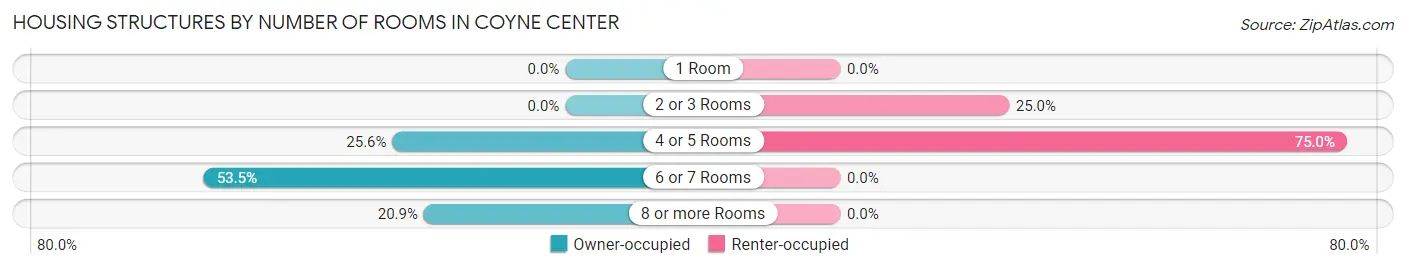
| Number of Rooms | Owner-occupied | Renter-occupied |
| 1 Room | 0 (0.0%) | 0 (0.0%) |
| 2 or 3 Rooms | 0 (0.0%) | 7 (25.0%) |
| 4 or 5 Rooms | 88 (25.6%) | 21 (75.0%) |
| 6 or 7 Rooms | 184 (53.5%) | 0 (0.0%) |
| 8 or more Rooms | 72 (20.9%) | 0 (0.0%) |
| Total | 344 (100.0%) | 28 (100.0%) |
Housing Structure by Heating Type in Coyne Center
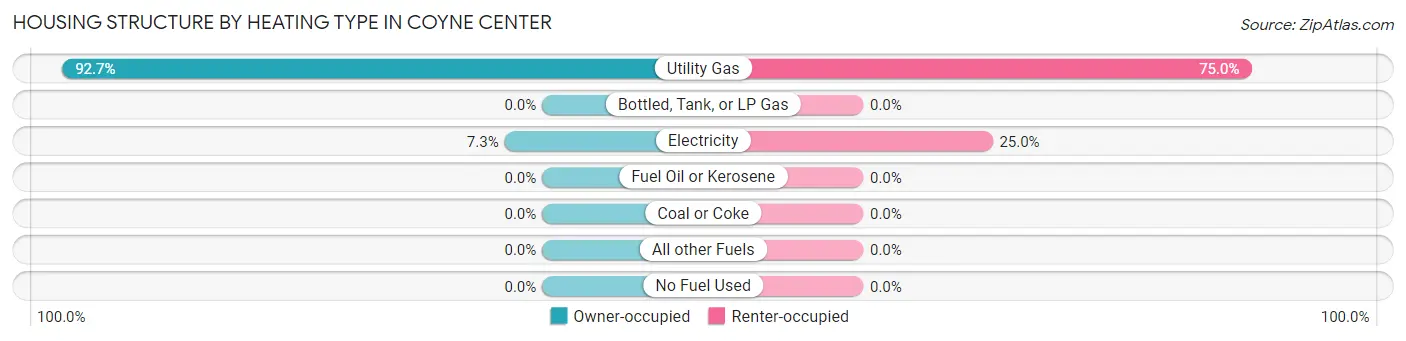
| Heating Type | Owner-occupied | Renter-occupied |
| Utility Gas | 319 (92.7%) | 21 (75.0%) |
| Bottled, Tank, or LP Gas | 0 (0.0%) | 0 (0.0%) |
| Electricity | 25 (7.3%) | 7 (25.0%) |
| Fuel Oil or Kerosene | 0 (0.0%) | 0 (0.0%) |
| Coal or Coke | 0 (0.0%) | 0 (0.0%) |
| All other Fuels | 0 (0.0%) | 0 (0.0%) |
| No Fuel Used | 0 (0.0%) | 0 (0.0%) |
| Total | 344 (100.0%) | 28 (100.0%) |
Household Vehicle Usage in Coyne Center
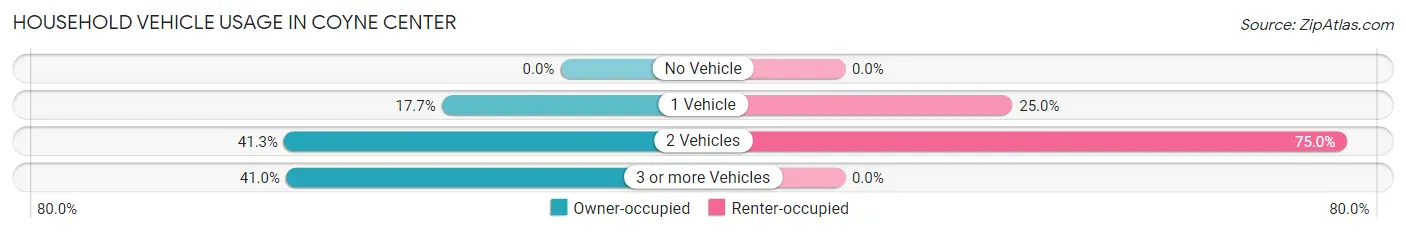
| Vehicles per Household | Owner-occupied | Renter-occupied |
| No Vehicle | 0 (0.0%) | 0 (0.0%) |
| 1 Vehicle | 61 (17.7%) | 7 (25.0%) |
| 2 Vehicles | 142 (41.3%) | 21 (75.0%) |
| 3 or more Vehicles | 141 (41.0%) | 0 (0.0%) |
| Total | 344 (100.0%) | 28 (100.0%) |
Real Estate & Mortgages in Coyne Center
Real Estate and Mortgage Overview in Coyne Center
| Characteristic | Without Mortgage | With Mortgage |
| Housing Units | 138 | 206 |
| Median Property Value | $178,600 | $220,500 |
| Median Household Income | $50,357 | $0 |
| Monthly Housing Costs | $519 | $0 |
| Real Estate Taxes | $2,387 | $0 |
Property Value by Mortgage Status in Coyne Center
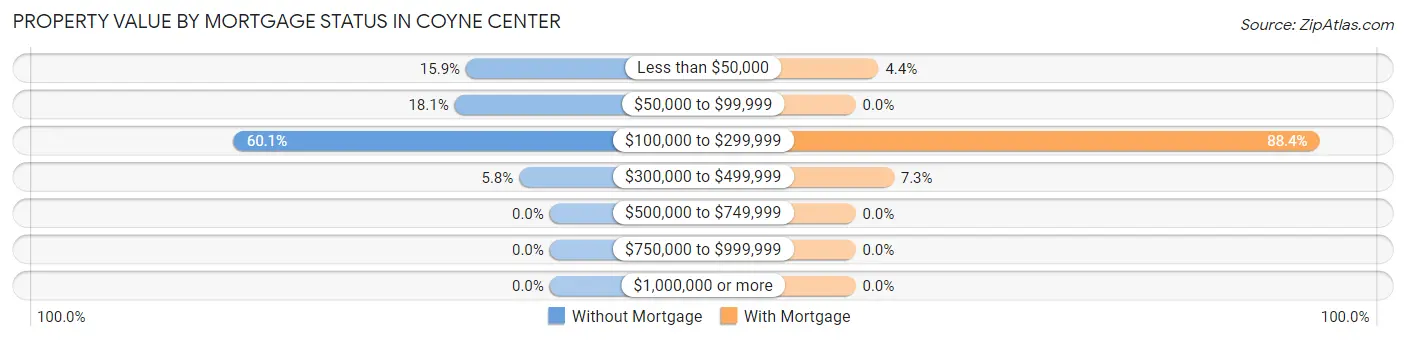
| Property Value | Without Mortgage | With Mortgage |
| Less than $50,000 | 22 (15.9%) | 9 (4.4%) |
| $50,000 to $99,999 | 25 (18.1%) | 0 (0.0%) |
| $100,000 to $299,999 | 83 (60.1%) | 182 (88.3%) |
| $300,000 to $499,999 | 8 (5.8%) | 15 (7.3%) |
| $500,000 to $749,999 | 0 (0.0%) | 0 (0.0%) |
| $750,000 to $999,999 | 0 (0.0%) | 0 (0.0%) |
| $1,000,000 or more | 0 (0.0%) | 0 (0.0%) |
| Total | 138 (100.0%) | 206 (100.0%) |
Household Income by Mortgage Status in Coyne Center
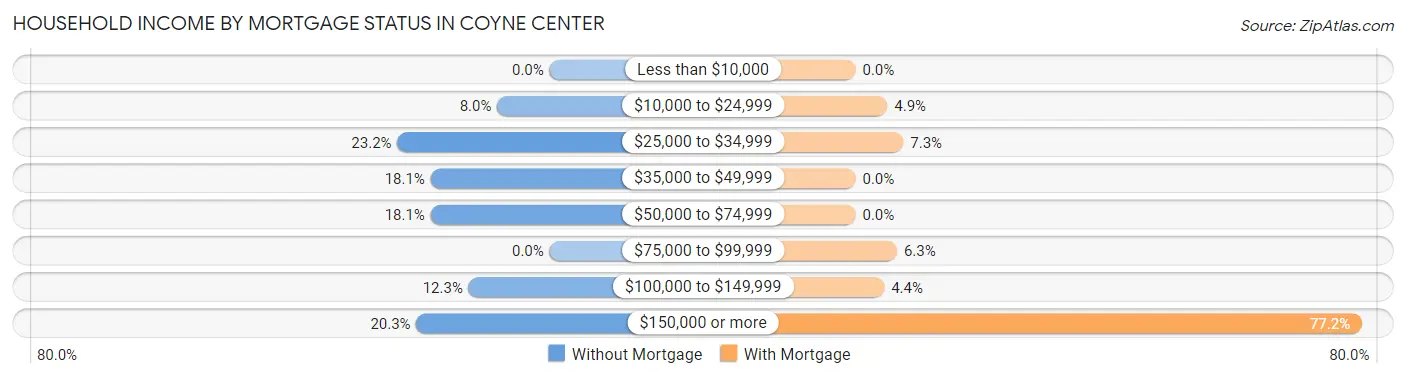
| Household Income | Without Mortgage | With Mortgage |
| Less than $10,000 | 0 (0.0%) | 0 (0.0%) |
| $10,000 to $24,999 | 11 (8.0%) | 10 (4.9%) |
| $25,000 to $34,999 | 32 (23.2%) | 15 (7.3%) |
| $35,000 to $49,999 | 25 (18.1%) | 0 (0.0%) |
| $50,000 to $74,999 | 25 (18.1%) | 0 (0.0%) |
| $75,000 to $99,999 | 0 (0.0%) | 13 (6.3%) |
| $100,000 to $149,999 | 17 (12.3%) | 9 (4.4%) |
| $150,000 or more | 28 (20.3%) | 159 (77.2%) |
| Total | 138 (100.0%) | 206 (100.0%) |
Property Value to Household Income Ratio in Coyne Center
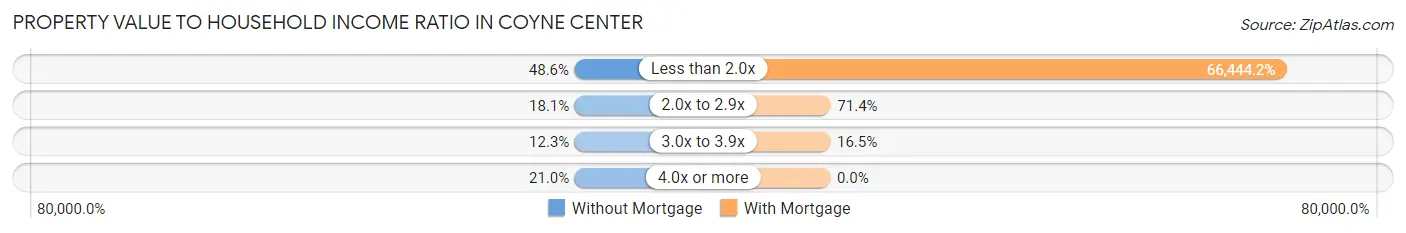
| Value-to-Income Ratio | Without Mortgage | With Mortgage |
| Less than 2.0x | 67 (48.5%) | 136,875 (66,444.2%) |
| 2.0x to 2.9x | 25 (18.1%) | 147 (71.4%) |
| 3.0x to 3.9x | 17 (12.3%) | 34 (16.5%) |
| 4.0x or more | 29 (21.0%) | 0 (0.0%) |
| Total | 138 (100.0%) | 206 (100.0%) |
Real Estate Taxes by Mortgage Status in Coyne Center
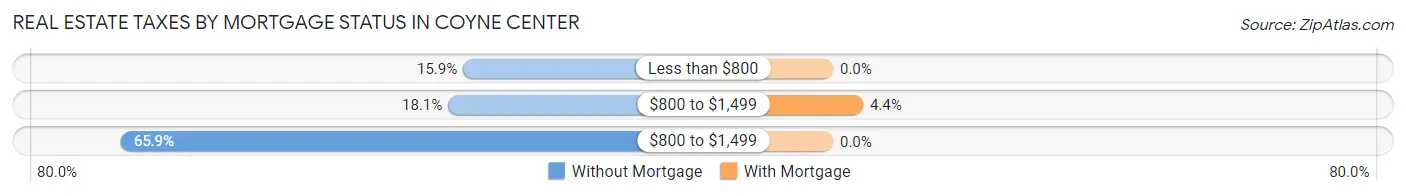
| Property Taxes | Without Mortgage | With Mortgage |
| Less than $800 | 22 (15.9%) | 0 (0.0%) |
| $800 to $1,499 | 25 (18.1%) | 9 (4.4%) |
| $800 to $1,499 | 91 (65.9%) | 0 (0.0%) |
| Total | 138 (100.0%) | 206 (100.0%) |
Health & Disability in Coyne Center
Health Insurance Coverage by Age in Coyne Center
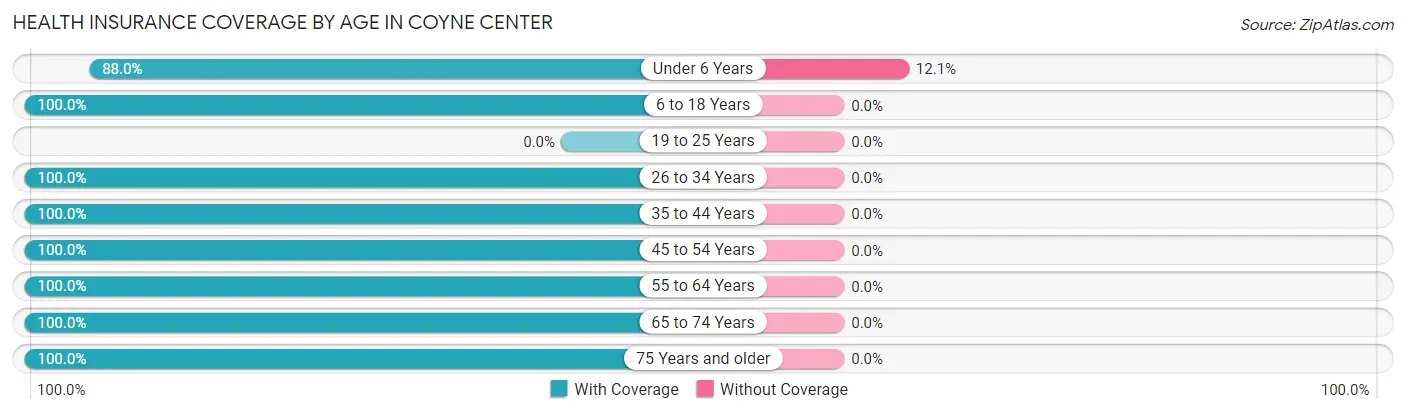
| Age Bracket | With Coverage | Without Coverage |
| Under 6 Years | 73 (87.9%) | 10 (12.0%) |
| 6 to 18 Years | 154 (100.0%) | 0 (0.0%) |
| 19 to 25 Years | 0 (0.0%) | 0 (0.0%) |
| 26 to 34 Years | 68 (100.0%) | 0 (0.0%) |
| 35 to 44 Years | 121 (100.0%) | 0 (0.0%) |
| 45 to 54 Years | 73 (100.0%) | 0 (0.0%) |
| 55 to 64 Years | 144 (100.0%) | 0 (0.0%) |
| 65 to 74 Years | 243 (100.0%) | 0 (0.0%) |
| 75 Years and older | 62 (100.0%) | 0 (0.0%) |
| Total | 938 (99.0%) | 10 (1.1%) |
Health Insurance Coverage by Citizenship Status in Coyne Center
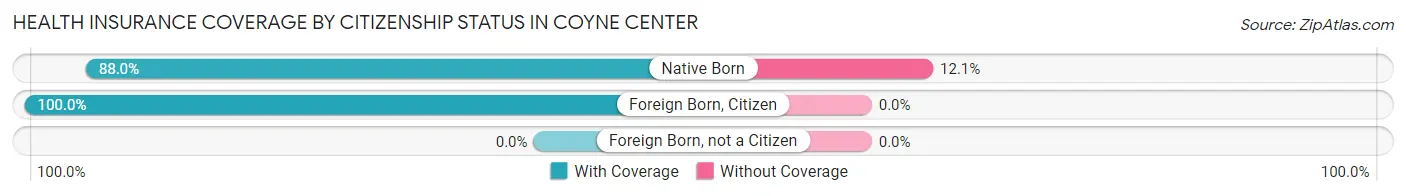
| Citizenship Status | With Coverage | Without Coverage |
| Native Born | 73 (87.9%) | 10 (12.0%) |
| Foreign Born, Citizen | 154 (100.0%) | 0 (0.0%) |
| Foreign Born, not a Citizen | 0 (0.0%) | 0 (0.0%) |
Health Insurance Coverage by Household Income in Coyne Center
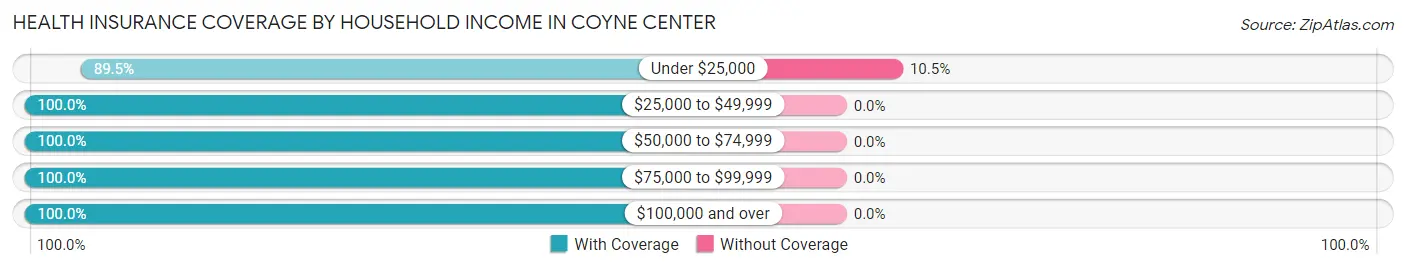
| Household Income | With Coverage | Without Coverage |
| Under $25,000 | 85 (89.5%) | 10 (10.5%) |
| $25,000 to $49,999 | 93 (100.0%) | 0 (0.0%) |
| $50,000 to $74,999 | 67 (100.0%) | 0 (0.0%) |
| $75,000 to $99,999 | 29 (100.0%) | 0 (0.0%) |
| $100,000 and over | 664 (100.0%) | 0 (0.0%) |
Public vs Private Health Insurance Coverage by Age in Coyne Center
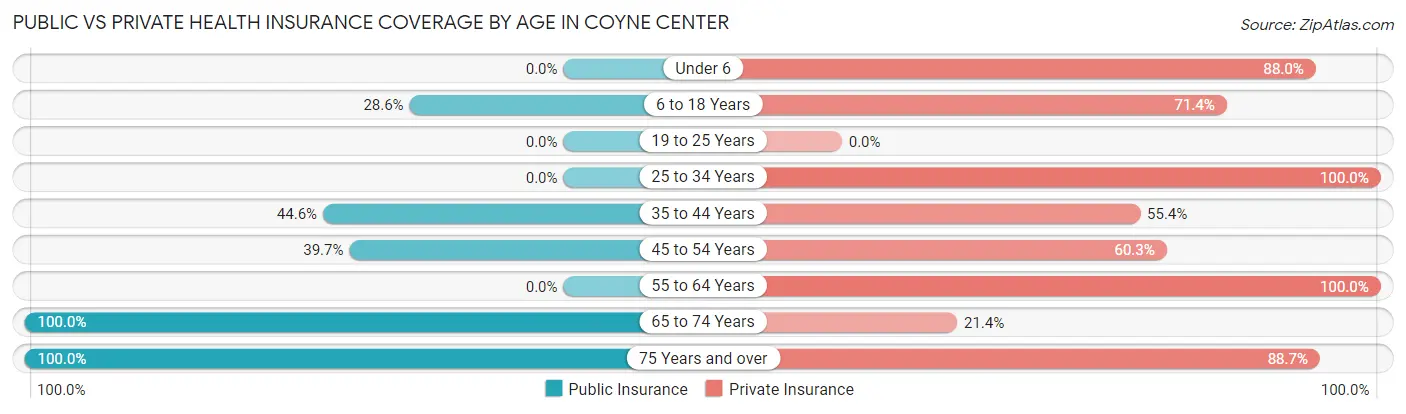
| Age Bracket | Public Insurance | Private Insurance |
| Under 6 | 0 (0.0%) | 73 (87.9%) |
| 6 to 18 Years | 44 (28.6%) | 110 (71.4%) |
| 19 to 25 Years | 0 (0.0%) | 0 (0.0%) |
| 25 to 34 Years | 0 (0.0%) | 68 (100.0%) |
| 35 to 44 Years | 54 (44.6%) | 67 (55.4%) |
| 45 to 54 Years | 29 (39.7%) | 44 (60.3%) |
| 55 to 64 Years | 0 (0.0%) | 144 (100.0%) |
| 65 to 74 Years | 243 (100.0%) | 52 (21.4%) |
| 75 Years and over | 62 (100.0%) | 55 (88.7%) |
| Total | 432 (45.6%) | 613 (64.7%) |
Disability Status by Sex by Age in Coyne Center
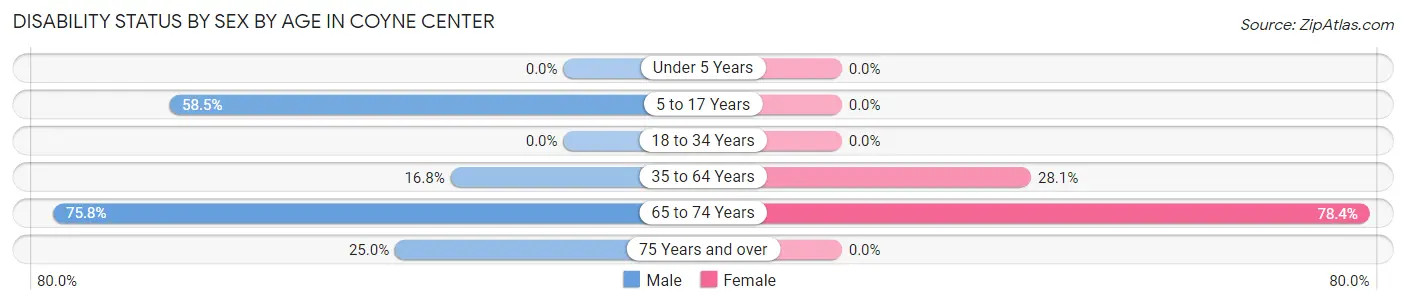
| Age Bracket | Male | Female |
| Under 5 Years | 0 (0.0%) | 0 (0.0%) |
| 5 to 17 Years | 24 (58.5%) | 0 (0.0%) |
| 18 to 34 Years | 0 (0.0%) | 0 (0.0%) |
| 35 to 64 Years | 31 (16.8%) | 43 (28.1%) |
| 65 to 74 Years | 100 (75.8%) | 87 (78.4%) |
| 75 Years and over | 7 (25.0%) | 0 (0.0%) |
Disability Class by Sex by Age in Coyne Center
Disability Class: Hearing Difficulty
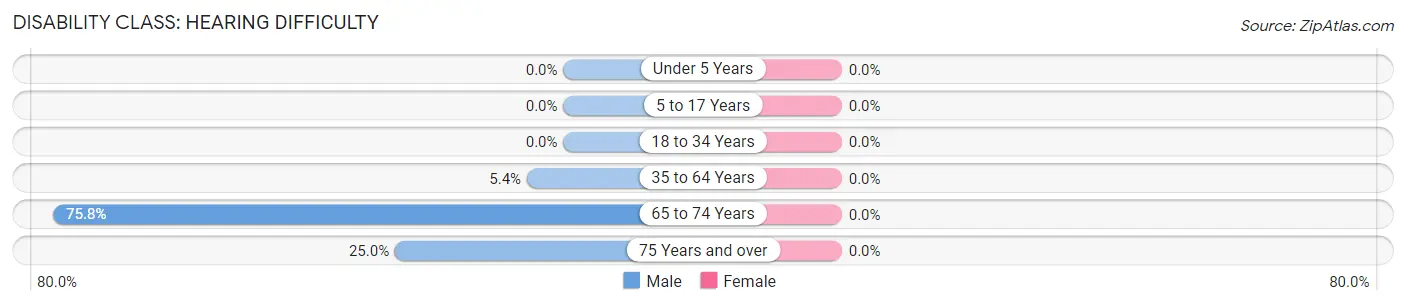
| Age Bracket | Male | Female |
| Under 5 Years | 0 (0.0%) | 0 (0.0%) |
| 5 to 17 Years | 0 (0.0%) | 0 (0.0%) |
| 18 to 34 Years | 0 (0.0%) | 0 (0.0%) |
| 35 to 64 Years | 10 (5.4%) | 0 (0.0%) |
| 65 to 74 Years | 100 (75.8%) | 0 (0.0%) |
| 75 Years and over | 7 (25.0%) | 0 (0.0%) |
Disability Class: Vision Difficulty
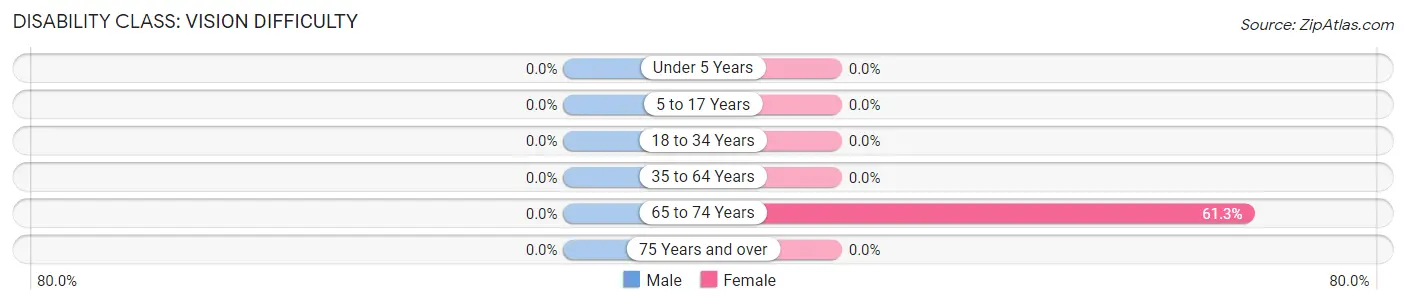
| Age Bracket | Male | Female |
| Under 5 Years | 0 (0.0%) | 0 (0.0%) |
| 5 to 17 Years | 0 (0.0%) | 0 (0.0%) |
| 18 to 34 Years | 0 (0.0%) | 0 (0.0%) |
| 35 to 64 Years | 0 (0.0%) | 0 (0.0%) |
| 65 to 74 Years | 0 (0.0%) | 68 (61.3%) |
| 75 Years and over | 0 (0.0%) | 0 (0.0%) |
Disability Class: Cognitive Difficulty
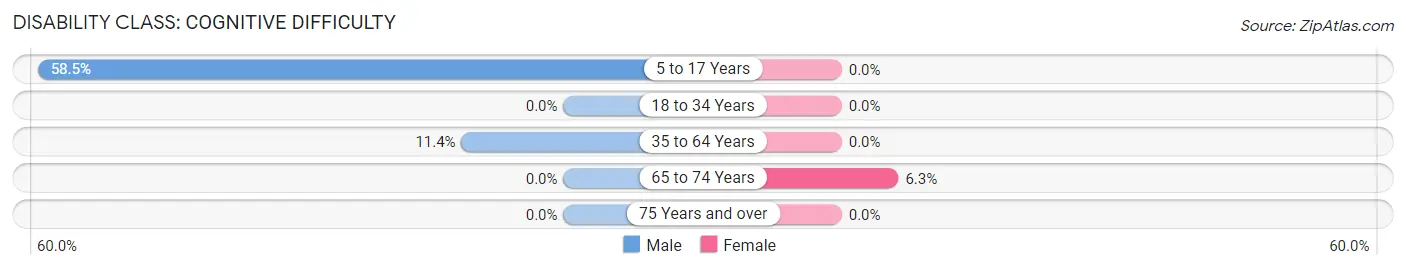
| Age Bracket | Male | Female |
| 5 to 17 Years | 24 (58.5%) | 0 (0.0%) |
| 18 to 34 Years | 0 (0.0%) | 0 (0.0%) |
| 35 to 64 Years | 21 (11.4%) | 0 (0.0%) |
| 65 to 74 Years | 0 (0.0%) | 7 (6.3%) |
| 75 Years and over | 0 (0.0%) | 0 (0.0%) |
Disability Class: Ambulatory Difficulty
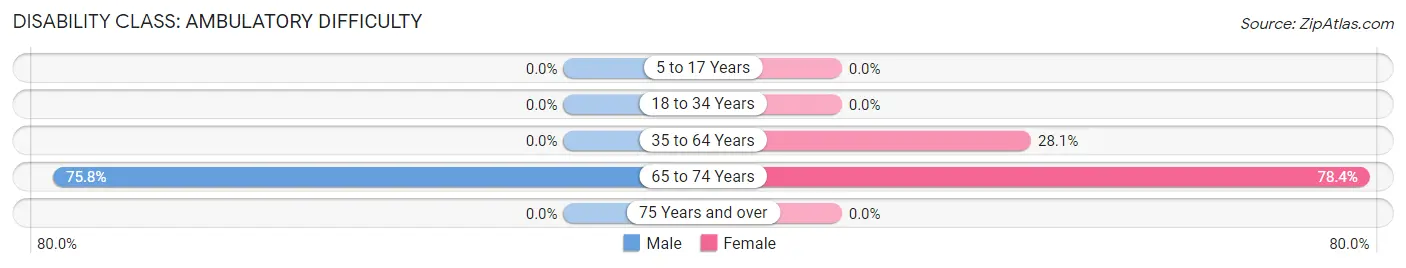
| Age Bracket | Male | Female |
| 5 to 17 Years | 0 (0.0%) | 0 (0.0%) |
| 18 to 34 Years | 0 (0.0%) | 0 (0.0%) |
| 35 to 64 Years | 0 (0.0%) | 43 (28.1%) |
| 65 to 74 Years | 100 (75.8%) | 87 (78.4%) |
| 75 Years and over | 0 (0.0%) | 0 (0.0%) |
Disability Class: Self-Care Difficulty
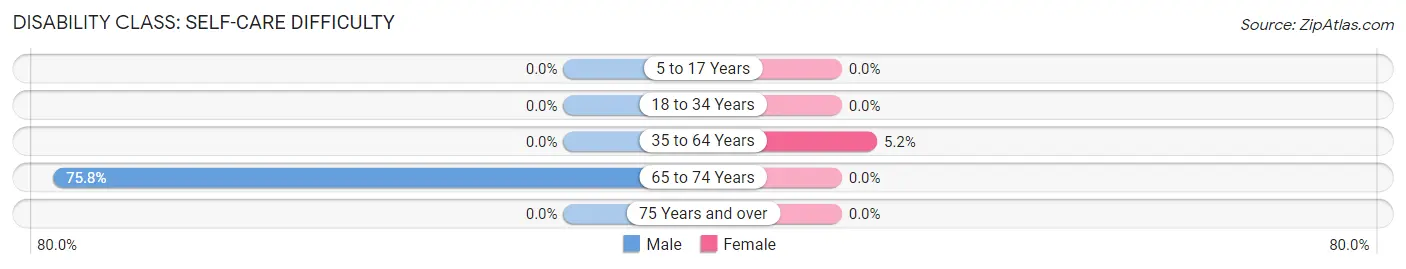
| Age Bracket | Male | Female |
| 5 to 17 Years | 0 (0.0%) | 0 (0.0%) |
| 18 to 34 Years | 0 (0.0%) | 0 (0.0%) |
| 35 to 64 Years | 0 (0.0%) | 8 (5.2%) |
| 65 to 74 Years | 100 (75.8%) | 0 (0.0%) |
| 75 Years and over | 0 (0.0%) | 0 (0.0%) |
Technology Access in Coyne Center
Computing Device Access in Coyne Center
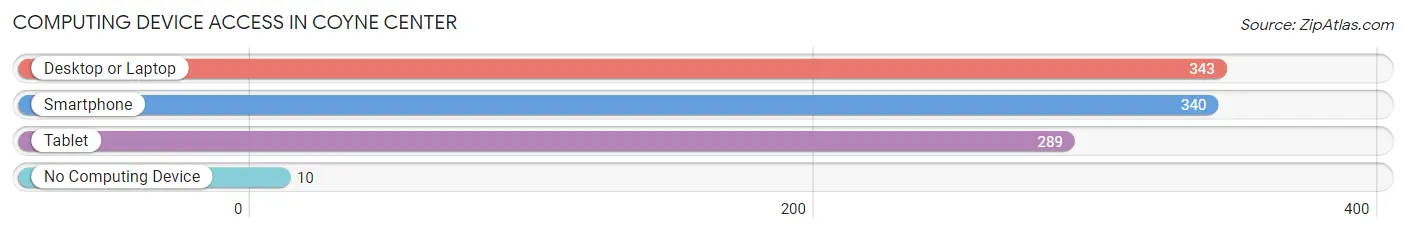
| Device Type | # Households | % Households |
| Desktop or Laptop | 343 | 92.2% |
| Smartphone | 340 | 91.4% |
| Tablet | 289 | 77.7% |
| No Computing Device | 10 | 2.7% |
| Total | 372 | 100.0% |
Internet Access in Coyne Center
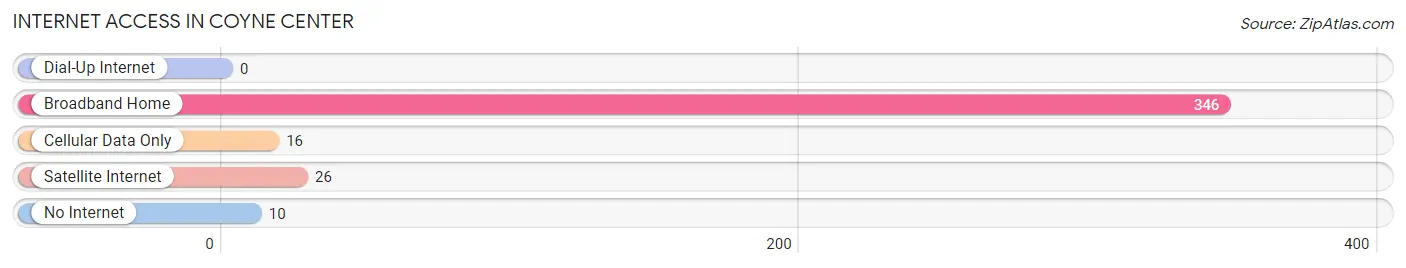
| Internet Type | # Households | % Households |
| Dial-Up Internet | 0 | 0.0% |
| Broadband Home | 346 | 93.0% |
| Cellular Data Only | 16 | 4.3% |
| Satellite Internet | 26 | 7.0% |
| No Internet | 10 | 2.7% |
| Total | 372 | 100.0% |
Coyne Center Summary
Coyne Center is a small unincorporated community located in LaSalle County, Illinois. It is situated in the north-central part of the state, about 80 miles southwest of Chicago. The population of Coyne Center was estimated to be around 200 people in 2020.
History
Coyne Center was founded in 1854 by Irish immigrants, John and Mary Coyne. The couple had immigrated to the United States from County Mayo, Ireland, and settled in the area that would become Coyne Center. The town was named after the Coyne family, and the center of the town was located at the intersection of two roads, which is now known as Coyne Center Road and LaSalle Street.
The town grew slowly over the years, and by the early 1900s, it had become a thriving agricultural community. The town was home to several businesses, including a general store, a blacksmith shop, a post office, and a school. The town also had a train station, which allowed for easy transportation of goods and people.
In the 1950s, the town began to decline as many of the businesses closed and the population began to dwindle. By the 1970s, the town was nearly abandoned, and the post office was closed in 1975.
Geography
Coyne Center is located in the north-central part of LaSalle County, Illinois. It is situated about 80 miles southwest of Chicago and about 25 miles east of the city of Ottawa. The town is located in a rural area, and the surrounding landscape is mostly flat with some rolling hills. The town is situated on the banks of the Fox River, which flows through the area.
The climate in Coyne Center is typical of the Midwest, with hot summers and cold winters. The average temperature in the summer is around 75 degrees Fahrenheit, and the average temperature in the winter is around 25 degrees Fahrenheit.
Economy
Coyne Center is a small, rural community with a limited economy. The town is home to a few small businesses, including a general store, a gas station, and a few restaurants. The town also has a few small farms, which produce corn, soybeans, and other crops.
The town is also home to a few manufacturing companies, which produce a variety of products, including furniture, clothing, and automotive parts. The town also has a few small service businesses, such as auto repair shops and hair salons.
Demographics
The population of Coyne Center was estimated to be around 200 people in 2020. The town is predominantly white, with a small Hispanic population. The median household income in the town is around $45,000, and the median home value is around $100,000. The town has a low unemployment rate, and most of the residents are employed in the local businesses or in the nearby cities of Ottawa and Streator.
Common Questions
What is the Total Population of Coyne Center?
Total Population of Coyne Center is 948.
What is the Total Male Population of Coyne Center?
Total Male Population of Coyne Center is 443.
What is the Total Female Population of Coyne Center?
Total Female Population of Coyne Center is 505.
What is the Ratio of Males per 100 Females in Coyne Center?
There are 87.72 Males per 100 Females in Coyne Center.
What is the Ratio of Females per 100 Males in Coyne Center?
There are 114.00 Females per 100 Males in Coyne Center.
What is the Median Population Age in Coyne Center?
Median Population Age in Coyne Center is 52.5 Years.
What is the Average Family Size in Coyne Center
Average Family Size in Coyne Center is 2.8 People.
What is the Average Household Size in Coyne Center
Average Household Size in Coyne Center is 2.5 People.
What is Per Capita Income in Coyne Center?
Per Capita income in Coyne Center is $36,259.
What is the Median Family Income in Coyne Center?
Median Family Income in Coyne Center is $133,529.
What is the Median Household income in Coyne Center?
Median Household Income in Coyne Center is $116,310.
What is Inequality or Gini Index in Coyne Center?
Inequality or Gini Index in Coyne Center is 0.30.
How Large is the Labor Force in Coyne Center?
There are 401 People in the Labor Forcein in Coyne Center.
What is the Percentage of People in the Labor Force in Coyne Center?
56.4% of People are in the Labor Force in Coyne Center.
What is the Unemployment Rate in Coyne Center?
Unemployment Rate in Coyne Center is 1.7%.