North City, IL
North City Map
North City Overview
697
TOTAL POPULATION
384
MALE POPULATION
313
FEMALE POPULATION
122.68
MALES / 100 FEMALES
81.51
FEMALES / 100 MALES
55.2
MEDIAN AGE
2.8
AVG FAMILY SIZE
2.2
AVG HOUSEHOLD SIZE
$33,444
PER CAPITA INCOME
$58,611
AVG FAMILY INCOME
$49,167
AVG HOUSEHOLD INCOME
15.9%
WAGE / INCOME GAP [ % ]
84.1¢/ $1
WAGE / INCOME GAP [ $ ]
0.41
INEQUALITY / GINI INDEX
316
LABOR FORCE [ PEOPLE ]
51.1%
PERCENT IN LABOR FORCE
10.1%
UNEMPLOYMENT RATE
North City Area Codes
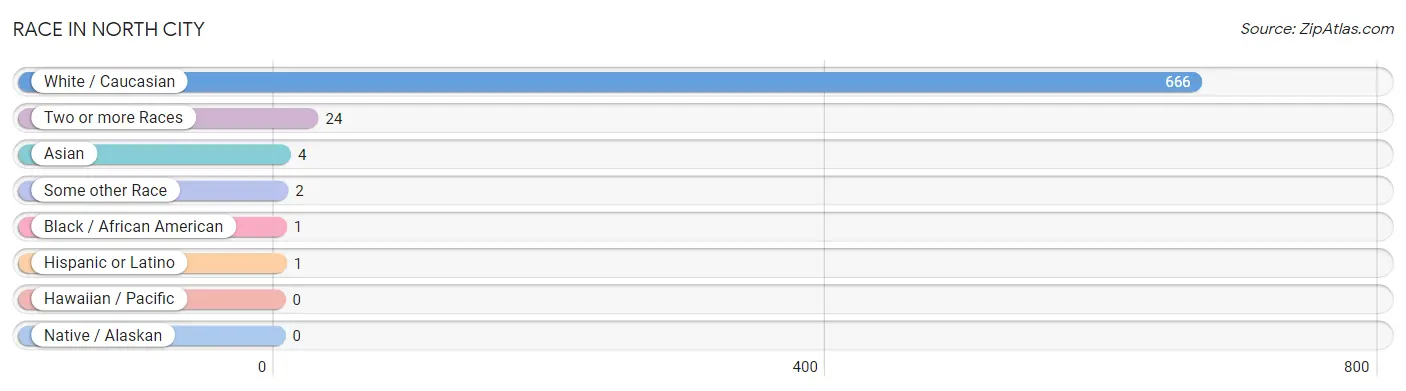
Race in North City
The most populous races in North City are White / Caucasian (666 | 95.6%), Two or more Races (24 | 3.4%), and Asian (4 | 0.6%).
| Race | # Population | % Population |
| Asian | 4 | 0.6% |
| Black / African American | 1 | 0.1% |
| Hawaiian / Pacific | 0 | 0.0% |
| Hispanic or Latino | 1 | 0.1% |
| Native / Alaskan | 0 | 0.0% |
| White / Caucasian | 666 | 95.6% |
| Two or more Races | 24 | 3.4% |
| Some other Race | 2 | 0.3% |
| Total | 697 | 100.0% |
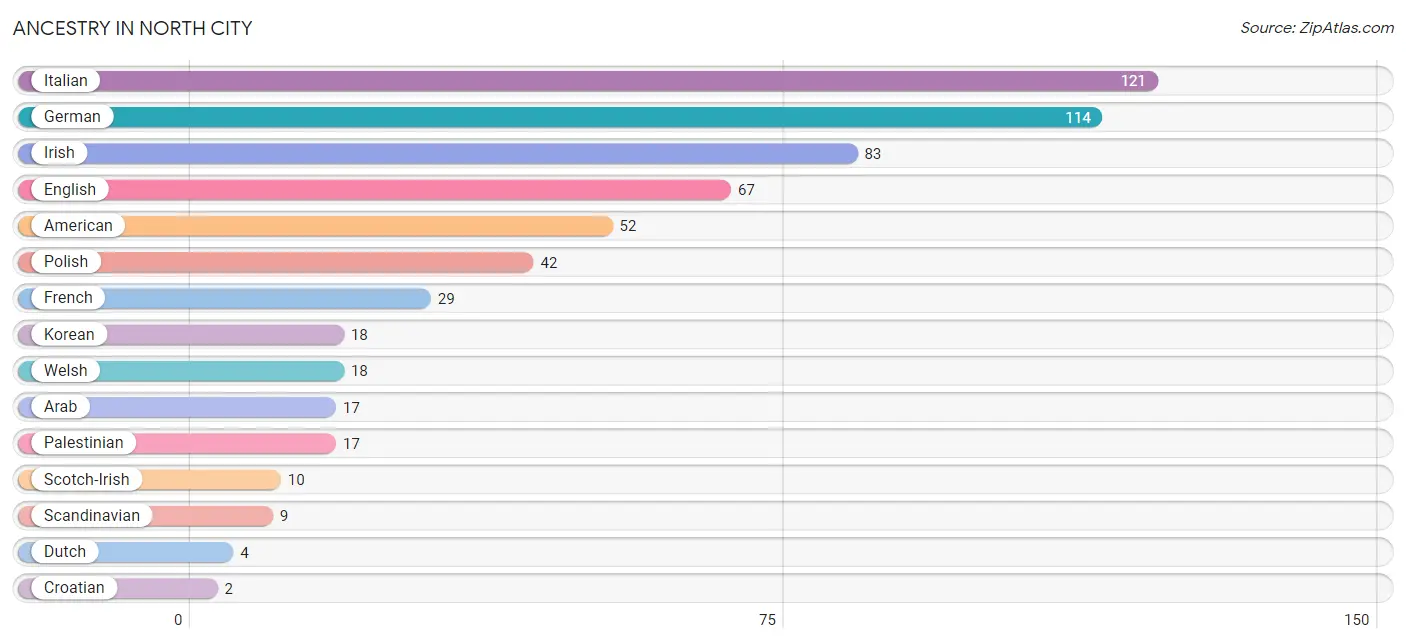
Ancestry in North City
The most populous ancestries reported in North City are Italian (121 | 17.4%), German (114 | 16.4%), Irish (83 | 11.9%), English (67 | 9.6%), and American (52 | 7.5%), together accounting for 62.7% of all North City residents.
| Ancestry | # Population | % Population |
| American | 52 | 7.5% |
| Arab | 17 | 2.4% |
| Croatian | 2 | 0.3% |
| Danish | 2 | 0.3% |
| Dutch | 4 | 0.6% |
| English | 67 | 9.6% |
| French | 29 | 4.2% |
| German | 114 | 16.4% |
| Irish | 83 | 11.9% |
| Italian | 121 | 17.4% |
| Korean | 18 | 2.6% |
| Mexican | 1 | 0.1% |
| Palestinian | 17 | 2.4% |
| Polish | 42 | 6.0% |
| Scandinavian | 9 | 1.3% |
| Scotch-Irish | 10 | 1.4% |
| Scottish | 2 | 0.3% |
| Welsh | 18 | 2.6% | View All 18 Rows |
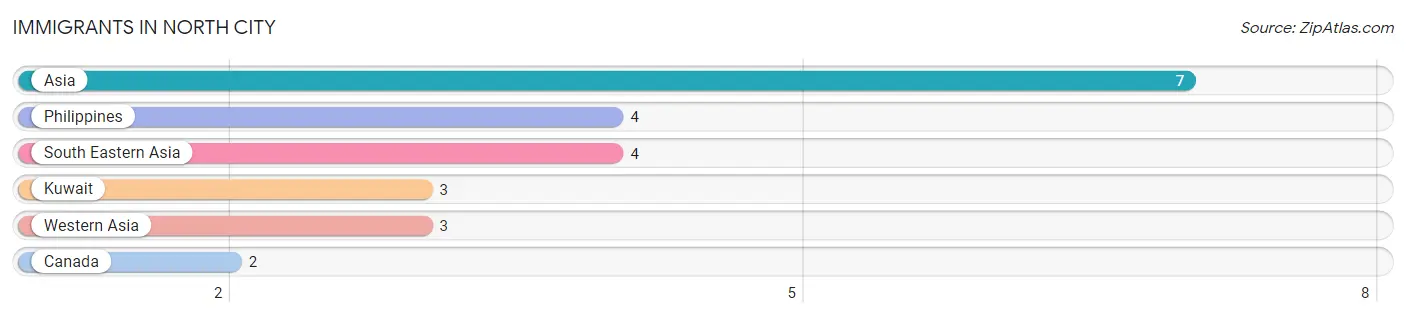
Immigrants in North City
The most numerous immigrant groups reported in North City came from Asia (7 | 1.0%), Philippines (4 | 0.6%), South Eastern Asia (4 | 0.6%), Kuwait (3 | 0.4%), and Western Asia (3 | 0.4%), together accounting for 3.0% of all North City residents.
| Immigration Origin | # Population | % Population |
| Asia | 7 | 1.0% |
| Canada | 2 | 0.3% |
| Kuwait | 3 | 0.4% |
| Philippines | 4 | 0.6% |
| South Eastern Asia | 4 | 0.6% |
| Western Asia | 3 | 0.4% | View All 6 Rows |
Sex and Age in North City
Sex and Age in North City
The most populous age groups in North City are 60 to 64 Years (67 | 17.4%) for men and 50 to 54 Years (48 | 15.3%) for women.
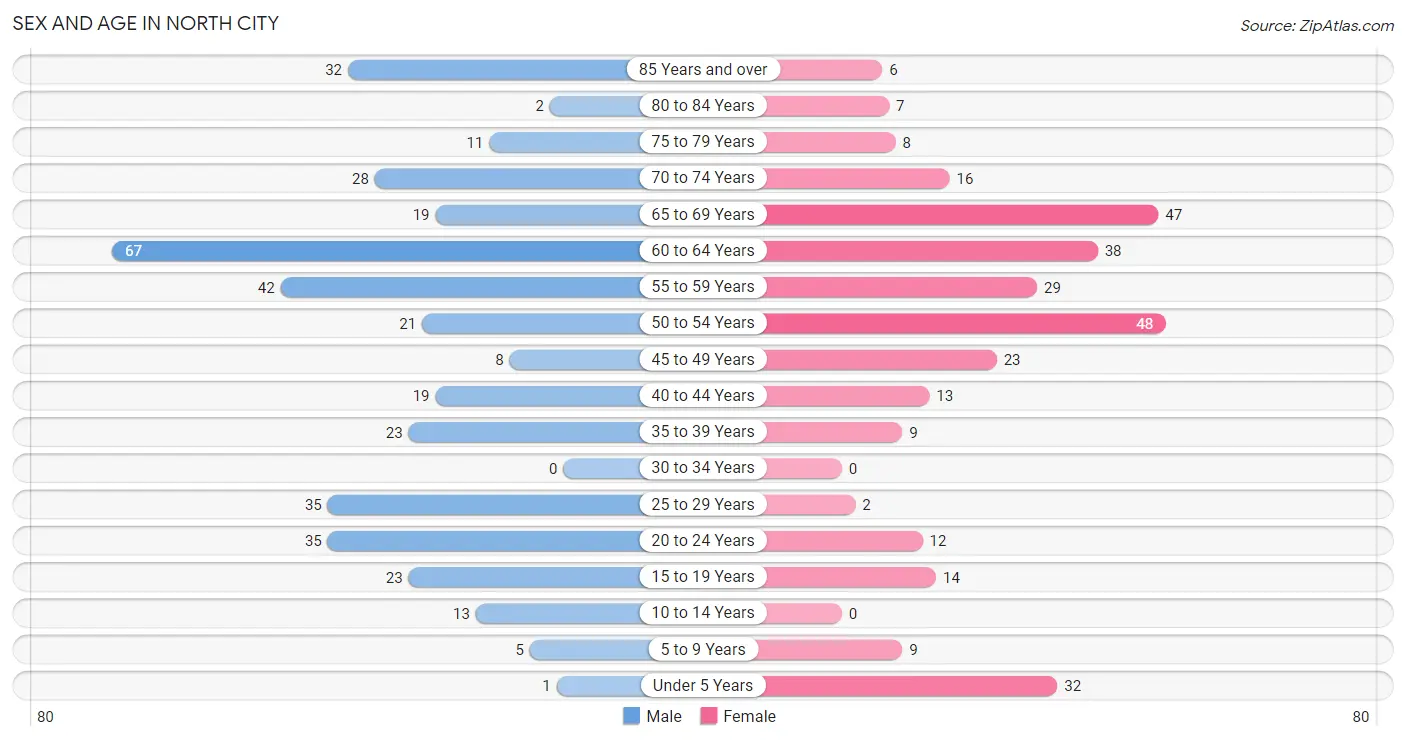
| Age Bracket | Male | Female |
| Under 5 Years | 1 (0.3%) | 32 (10.2%) |
| 5 to 9 Years | 5 (1.3%) | 9 (2.9%) |
| 10 to 14 Years | 13 (3.4%) | 0 (0.0%) |
| 15 to 19 Years | 23 (6.0%) | 14 (4.5%) |
| 20 to 24 Years | 35 (9.1%) | 12 (3.8%) |
| 25 to 29 Years | 35 (9.1%) | 2 (0.6%) |
| 30 to 34 Years | 0 (0.0%) | 0 (0.0%) |
| 35 to 39 Years | 23 (6.0%) | 9 (2.9%) |
| 40 to 44 Years | 19 (5.0%) | 13 (4.2%) |
| 45 to 49 Years | 8 (2.1%) | 23 (7.3%) |
| 50 to 54 Years | 21 (5.5%) | 48 (15.3%) |
| 55 to 59 Years | 42 (10.9%) | 29 (9.3%) |
| 60 to 64 Years | 67 (17.4%) | 38 (12.1%) |
| 65 to 69 Years | 19 (5.0%) | 47 (15.0%) |
| 70 to 74 Years | 28 (7.3%) | 16 (5.1%) |
| 75 to 79 Years | 11 (2.9%) | 8 (2.6%) |
| 80 to 84 Years | 2 (0.5%) | 7 (2.2%) |
| 85 Years and over | 32 (8.3%) | 6 (1.9%) |
| Total | 384 (100.0%) | 313 (100.0%) |
Families and Households in North City
Median Family Size in North City
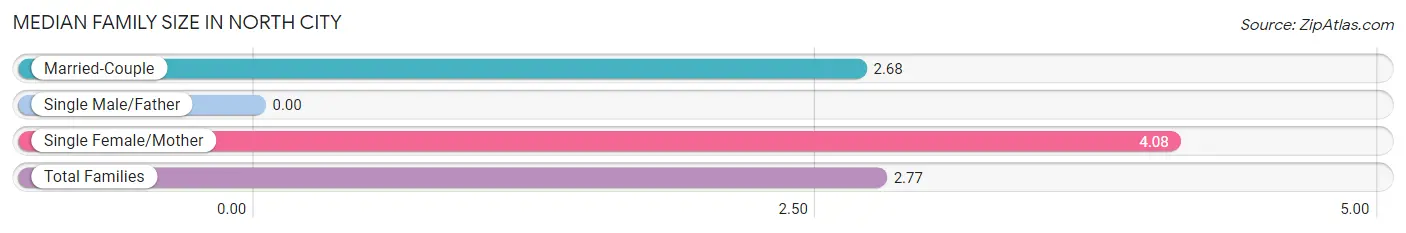
| Family Type | # Families | Family Size |
| Married-Couple | 176 (93.6%) | 2.68 |
| Single Male/Father | 0 (0.0%) | - |
| Single Female/Mother | 12 (6.4%) | 4.08 |
| Total Families | 188 (100.0%) | 2.77 |
Median Household Size in North City
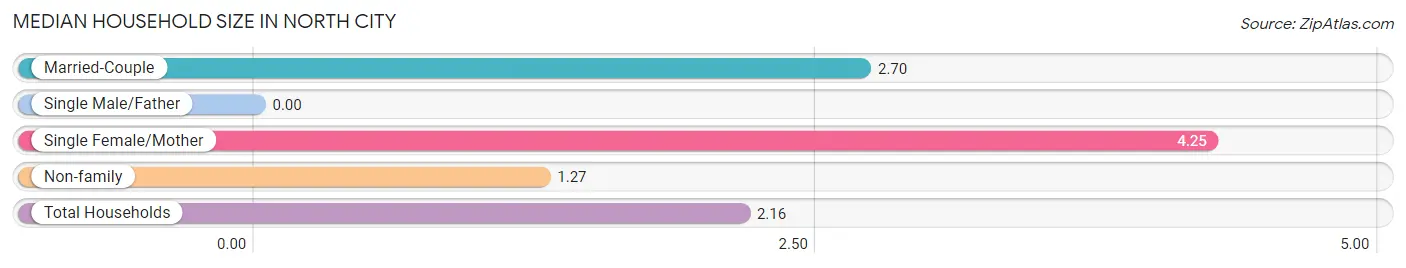
| Household Type | # Households | Household Size |
| Married-Couple | 176 (54.7%) | 2.70 |
| Single Male/Father | 0 (0.0%) | - |
| Single Female/Mother | 12 (3.7%) | 4.25 |
| Non-family | 134 (41.6%) | 1.27 |
| Total Households | 322 (100.0%) | 2.16 |
Household Size by Marriage Status in North City
Out of a total of 322 households in North City, 188 (58.4%) are family households, while 134 (41.6%) are nonfamily households. The most numerous type of family households are 2-person households, comprising 101, and the most common type of nonfamily households are 1-person households, comprising 89.
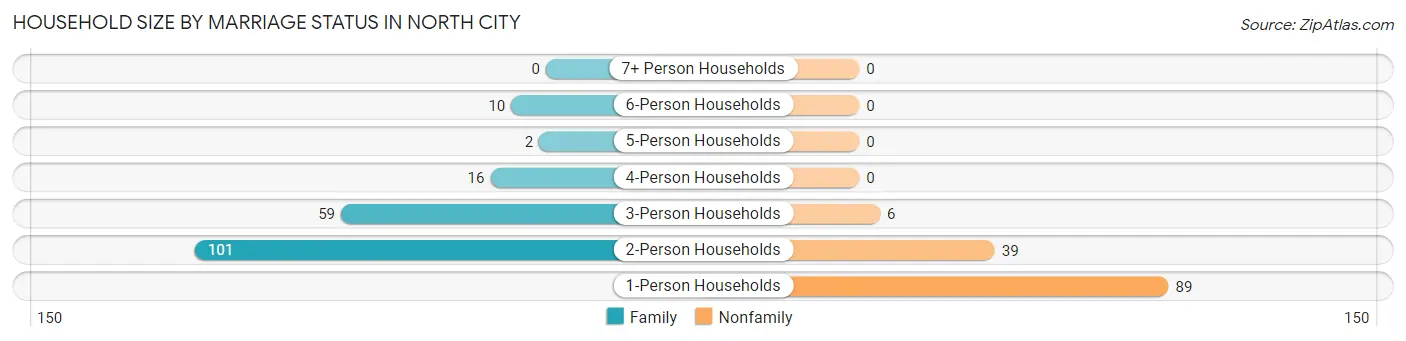
| Household Size | Family Households | Nonfamily Households |
| 1-Person Households | - | 89 (27.6%) |
| 2-Person Households | 101 (31.4%) | 39 (12.1%) |
| 3-Person Households | 59 (18.3%) | 6 (1.9%) |
| 4-Person Households | 16 (5.0%) | 0 (0.0%) |
| 5-Person Households | 2 (0.6%) | 0 (0.0%) |
| 6-Person Households | 10 (3.1%) | 0 (0.0%) |
| 7+ Person Households | 0 (0.0%) | 0 (0.0%) |
| Total | 188 (58.4%) | 134 (41.6%) |
Female Fertility in North City
Fertility by Age in North City
Average fertility rate in North City is 80.0 births per 1,000 women. Women in the age bracket of 20 to 34 years have the highest fertility rate with 429.0 births per 1,000 women. Women in the age bracket of 20 to 34 years acount for 100.0% of all women with births.
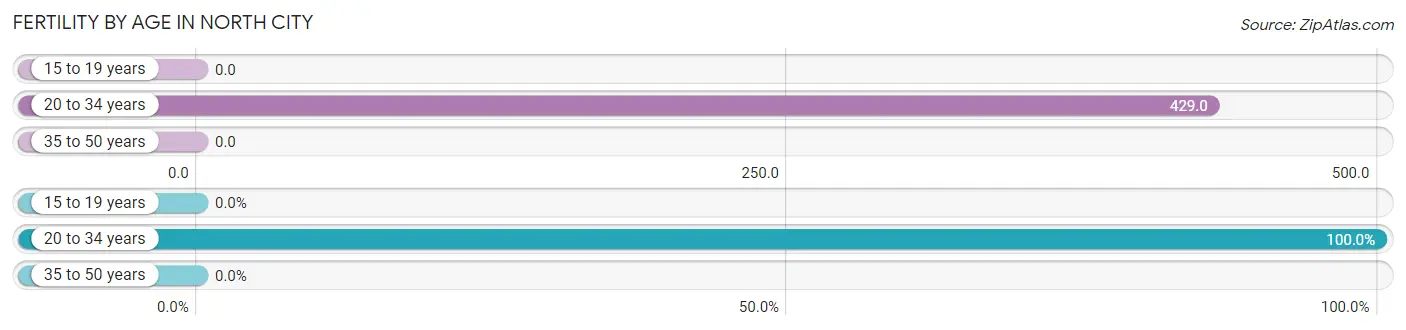
| Age Bracket | Women with Births | Births / 1,000 Women |
| 15 to 19 years | 0 (0.0%) | 0.0 |
| 20 to 34 years | 6 (100.0%) | 429.0 |
| 35 to 50 years | 0 (0.0%) | 0.0 |
| Total | 6 (100.0%) | 80.0 |
Fertility by Age by Marriage Status in North City
33.3% of women with births (6) in North City are married. The highest percentage of unmarried women with births falls into 20 to 34 years age bracket with 66.7% of them unmarried at the time of birth, while the lowest percentage of unmarried women with births belong to 20 to 34 years age bracket with 66.7% of them unmarried.
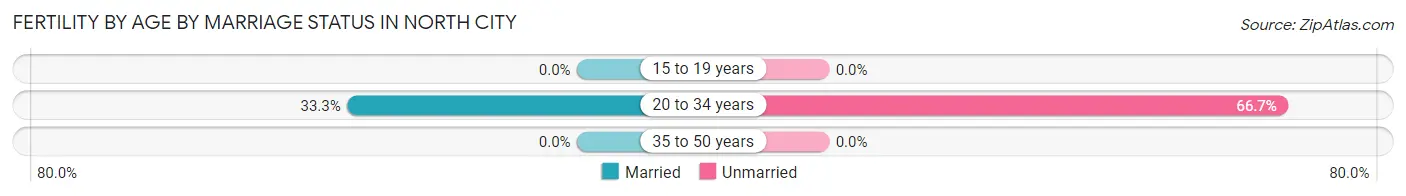
| Age Bracket | Married | Unmarried |
| 15 to 19 years | 0 (0.0%) | 0 (0.0%) |
| 20 to 34 years | 2 (33.3%) | 4 (66.7%) |
| 35 to 50 years | 0 (0.0%) | 0 (0.0%) |
| Total | 2 (33.3%) | 4 (66.7%) |
Fertility by Education in North City
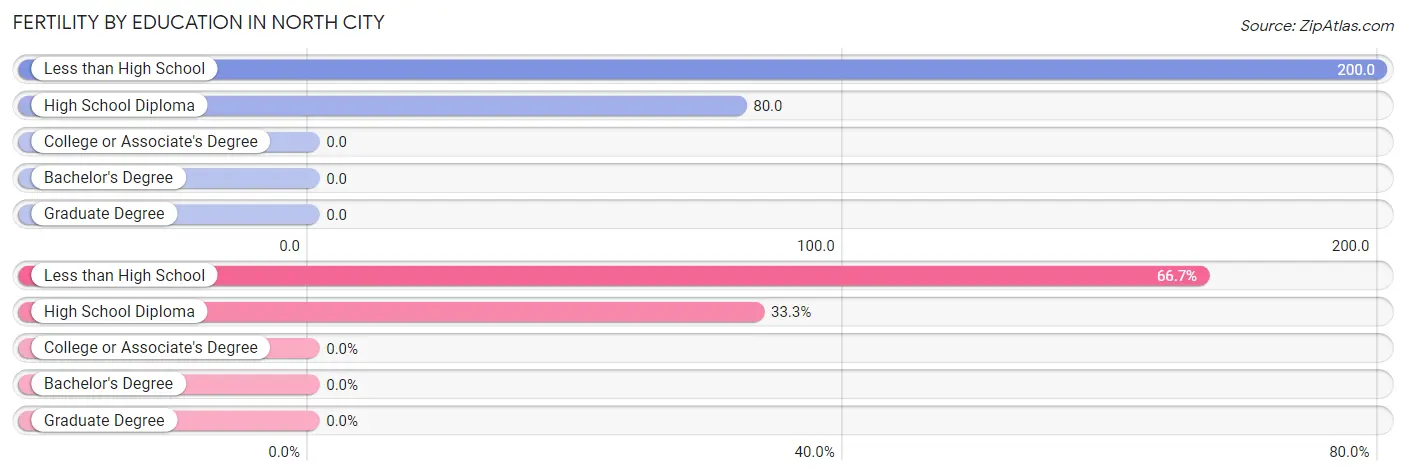
| Educational Attainment | Women with Births | Births / 1,000 Women |
| Less than High School | 4 (66.7%) | 200.0 |
| High School Diploma | 2 (33.3%) | 80.0 |
| College or Associate's Degree | 0 (0.0%) | 0.0 |
| Bachelor's Degree | 0 (0.0%) | 0.0 |
| Graduate Degree | 0 (0.0%) | 0.0 |
| Total | 6 (100.0%) | 80.0 |
Fertility by Education by Marriage Status in North City
66.7% of women with births in North City are unmarried. Women with the educational attainment of high school diploma are most likely to be married with 100.0% of them married at childbirth, while women with the educational attainment of less than high school are least likely to be married with 100.0% of them unmarried at childbirth.
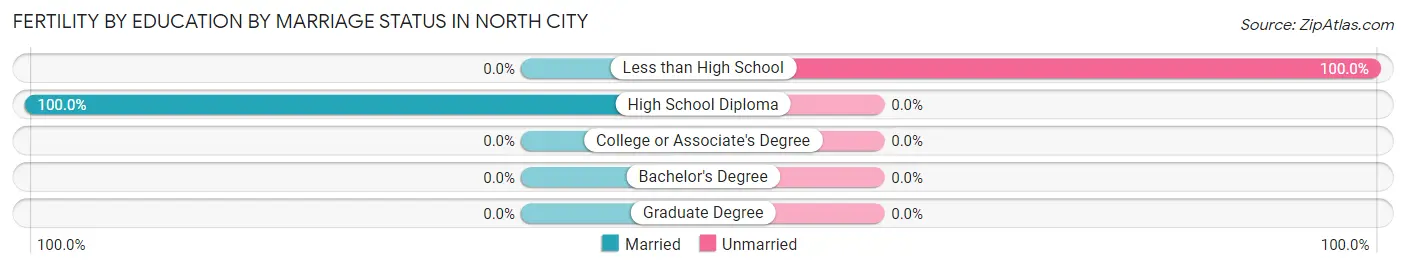
| Educational Attainment | Married | Unmarried |
| Less than High School | 0 (0.0%) | 4 (100.0%) |
| High School Diploma | 2 (100.0%) | 0 (0.0%) |
| College or Associate's Degree | 0 (0.0%) | 0 (0.0%) |
| Bachelor's Degree | 0 (0.0%) | 0 (0.0%) |
| Graduate Degree | 0 (0.0%) | 0 (0.0%) |
| Total | 2 (33.3%) | 4 (66.7%) |
Income in North City
Income Overview in North City
Per Capita Income in North City is $33,444, while median incomes of families and households are $58,611 and $49,167 respectively.
| Characteristic | Number | Measure |
| Per Capita Income | 697 | $33,444 |
| Median Family Income | 188 | $58,611 |
| Mean Family Income | 188 | $72,351 |
| Median Household Income | 322 | $49,167 |
| Mean Household Income | 322 | $69,398 |
| Income Deficit | 188 | $0 |
| Wage / Income Gap (%) | 697 | 15.91% |
| Wage / Income Gap ($) | 697 | 84.09¢ per $1 |
| Gini / Inequality Index | 697 | 0.41 |
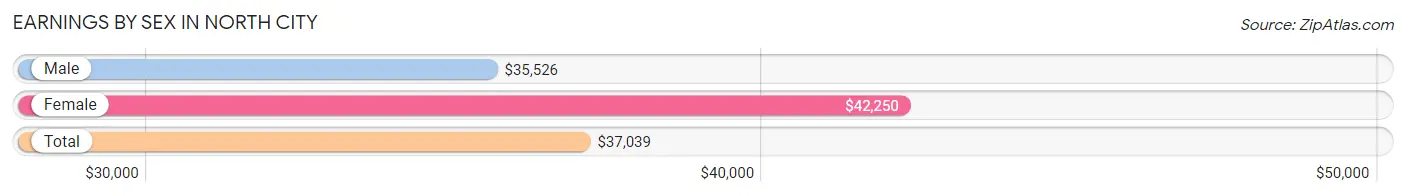
Earnings by Sex in North City
Average Earnings in North City are $37,039, $35,526 for men and $42,250 for women, a difference of 15.9%.
| Sex | Number | Average Earnings |
| Male | 188 (58.6%) | $35,526 |
| Female | 133 (41.4%) | $42,250 |
| Total | 321 (100.0%) | $37,039 |
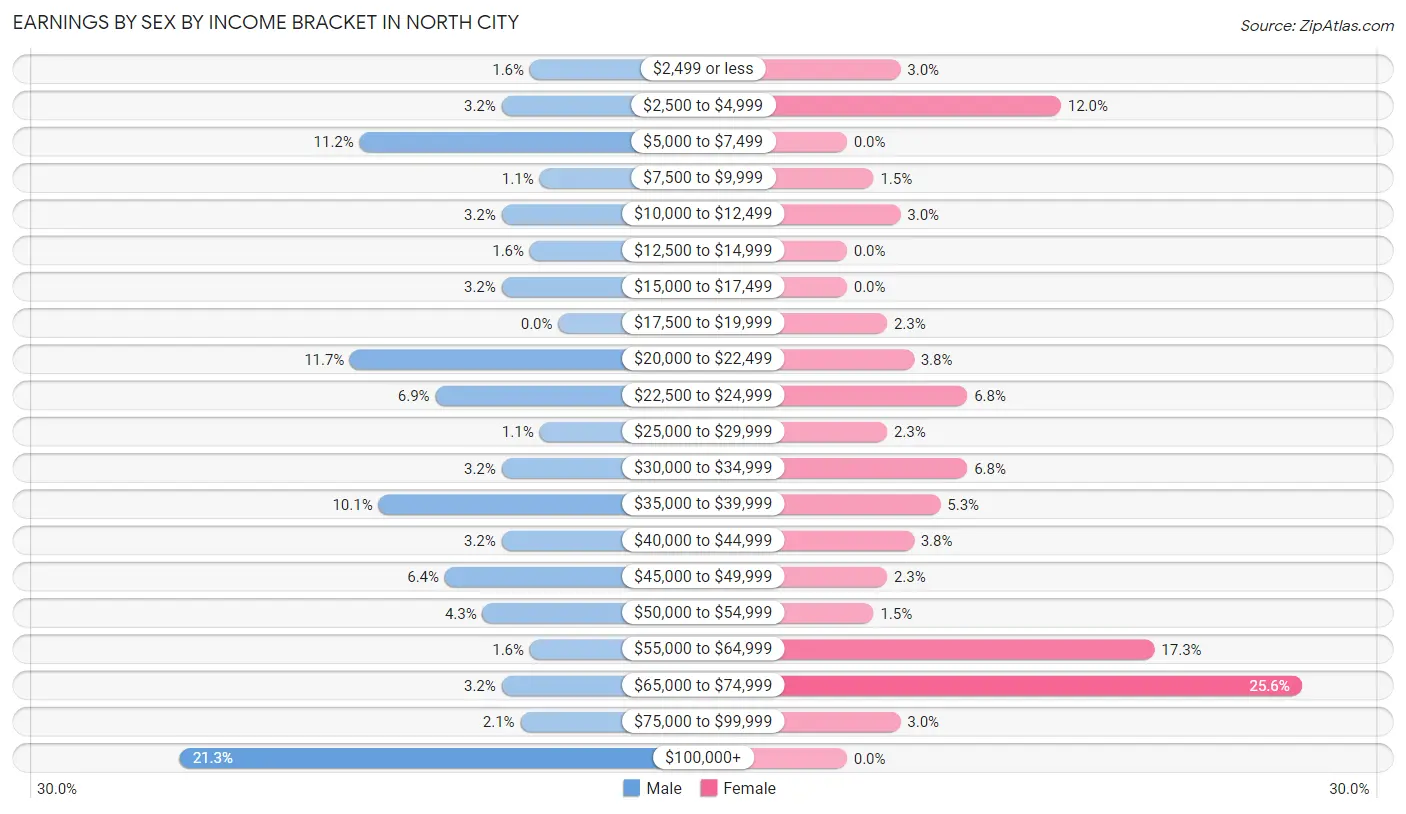
Earnings by Sex by Income Bracket in North City
The most common earnings brackets in North City are $100,000+ for men (40 | 21.3%) and $65,000 to $74,999 for women (34 | 25.6%).
| Income | Male | Female |
| $2,499 or less | 3 (1.6%) | 4 (3.0%) |
| $2,500 to $4,999 | 6 (3.2%) | 16 (12.0%) |
| $5,000 to $7,499 | 21 (11.2%) | 0 (0.0%) |
| $7,500 to $9,999 | 2 (1.1%) | 2 (1.5%) |
| $10,000 to $12,499 | 6 (3.2%) | 4 (3.0%) |
| $12,500 to $14,999 | 3 (1.6%) | 0 (0.0%) |
| $15,000 to $17,499 | 6 (3.2%) | 0 (0.0%) |
| $17,500 to $19,999 | 0 (0.0%) | 3 (2.3%) |
| $20,000 to $22,499 | 22 (11.7%) | 5 (3.8%) |
| $22,500 to $24,999 | 13 (6.9%) | 9 (6.8%) |
| $25,000 to $29,999 | 2 (1.1%) | 3 (2.3%) |
| $30,000 to $34,999 | 6 (3.2%) | 9 (6.8%) |
| $35,000 to $39,999 | 19 (10.1%) | 7 (5.3%) |
| $40,000 to $44,999 | 6 (3.2%) | 5 (3.8%) |
| $45,000 to $49,999 | 12 (6.4%) | 3 (2.3%) |
| $50,000 to $54,999 | 8 (4.3%) | 2 (1.5%) |
| $55,000 to $64,999 | 3 (1.6%) | 23 (17.3%) |
| $65,000 to $74,999 | 6 (3.2%) | 34 (25.6%) |
| $75,000 to $99,999 | 4 (2.1%) | 4 (3.0%) |
| $100,000+ | 40 (21.3%) | 0 (0.0%) |
| Total | 188 (100.0%) | 133 (100.0%) |
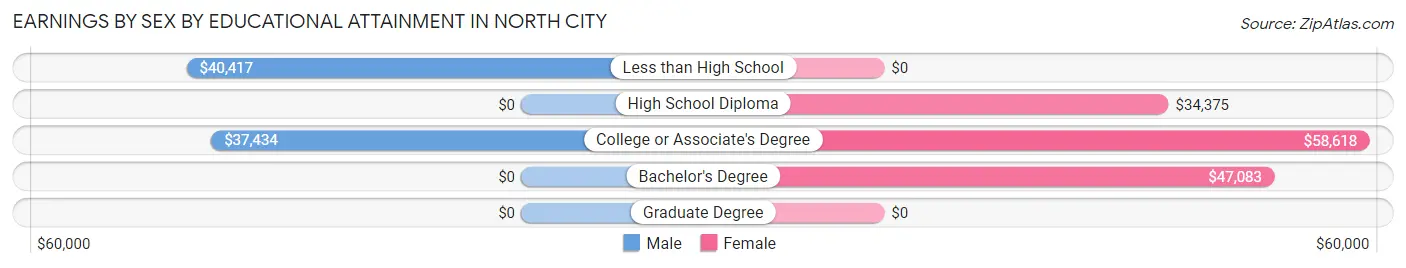
Earnings by Sex by Educational Attainment in North City
Average earnings in North City are $42,083 for men and $51,875 for women, a difference of 18.9%. Men with an educational attainment of less than high school enjoy the highest average annual earnings of $40,417, while those with college or associate's degree education earn the least with $37,434. Women with an educational attainment of college or associate's degree earn the most with the average annual earnings of $58,618, while those with high school diploma education have the smallest earnings of $34,375.
| Educational Attainment | Male Income | Female Income |
| Less than High School | $40,417 | $0 |
| High School Diploma | - | - |
| College or Associate's Degree | $37,434 | $58,618 |
| Bachelor's Degree | - | - |
| Graduate Degree | - | - |
| Total | $42,083 | $51,875 |
Family Income in North City
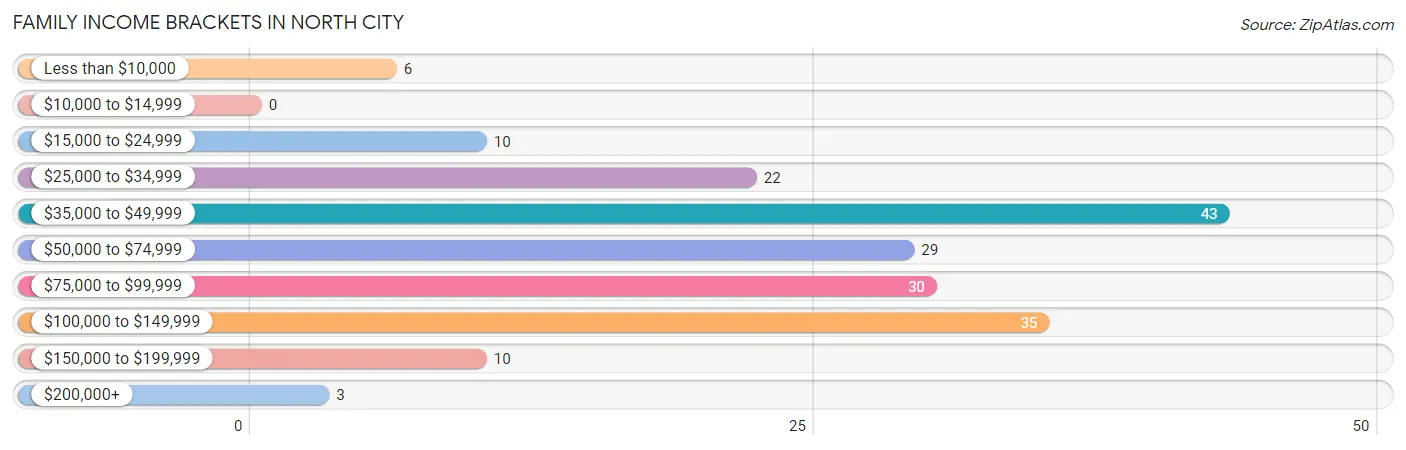
Family Income Brackets in North City
According to the North City family income data, there are 43 families falling into the $35,000 to $49,999 income range, which is the most common income bracket and makes up 22.9% of all families.
| Income Bracket | # Families | % Families |
| Less than $10,000 | 6 | 3.2% |
| $10,000 to $14,999 | 0 | 0.0% |
| $15,000 to $24,999 | 10 | 5.3% |
| $25,000 to $34,999 | 22 | 11.7% |
| $35,000 to $49,999 | 43 | 22.9% |
| $50,000 to $74,999 | 29 | 15.4% |
| $75,000 to $99,999 | 30 | 16.0% |
| $100,000 to $149,999 | 35 | 18.6% |
| $150,000 to $199,999 | 10 | 5.3% |
| $200,000+ | 3 | 1.6% |
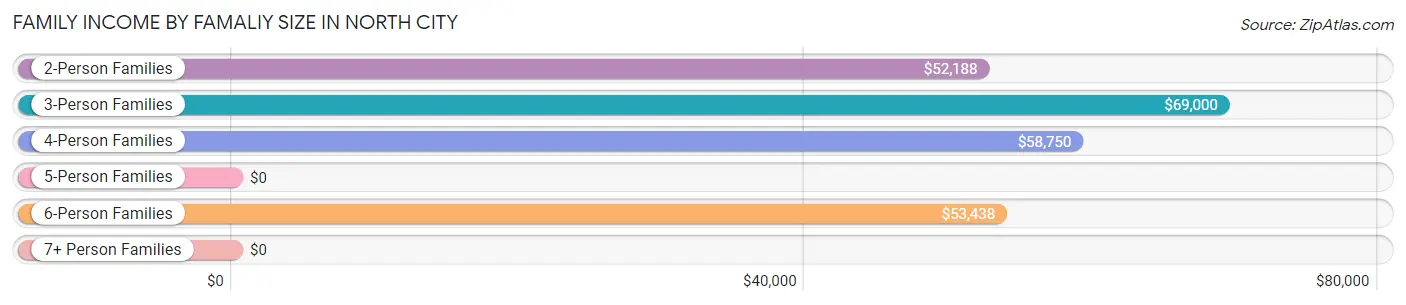
Family Income by Famaliy Size in North City
3-person families (58 | 30.8%) account for the highest median family income in North City with $69,000 per family, while 2-person families (103 | 54.8%) have the highest median income of $26,094 per family member.
| Income Bracket | # Families | Median Income |
| 2-Person Families | 103 (54.8%) | $52,188 |
| 3-Person Families | 58 (30.8%) | $69,000 |
| 4-Person Families | 16 (8.5%) | $58,750 |
| 5-Person Families | 2 (1.1%) | $0 |
| 6-Person Families | 9 (4.8%) | $53,438 |
| 7+ Person Families | 0 (0.0%) | $0 |
| Total | 188 (100.0%) | $58,611 |
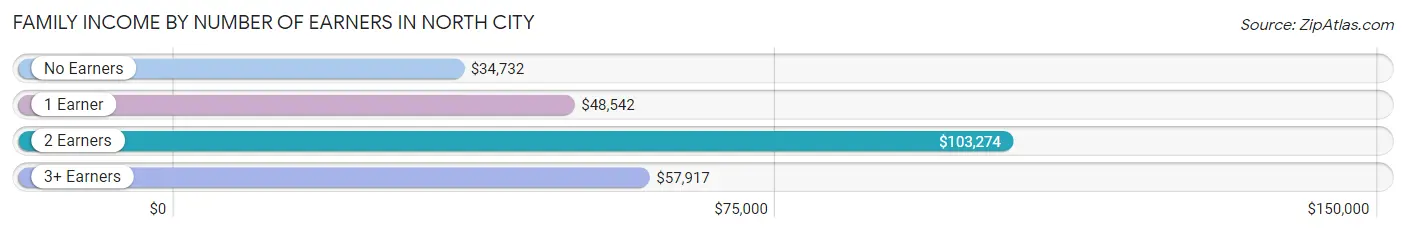
Family Income by Number of Earners in North City
The median family income in North City is $58,611, with families comprising 2 earners (47) having the highest median family income of $103,274, while families with no earners (47) have the lowest median family income of $34,732, accounting for 25.0% and 25.0% of families, respectively.
| Number of Earners | # Families | Median Income |
| No Earners | 47 (25.0%) | $34,732 |
| 1 Earner | 85 (45.2%) | $48,542 |
| 2 Earners | 47 (25.0%) | $103,274 |
| 3+ Earners | 9 (4.8%) | $57,917 |
| Total | 188 (100.0%) | $58,611 |
Household Income in North City
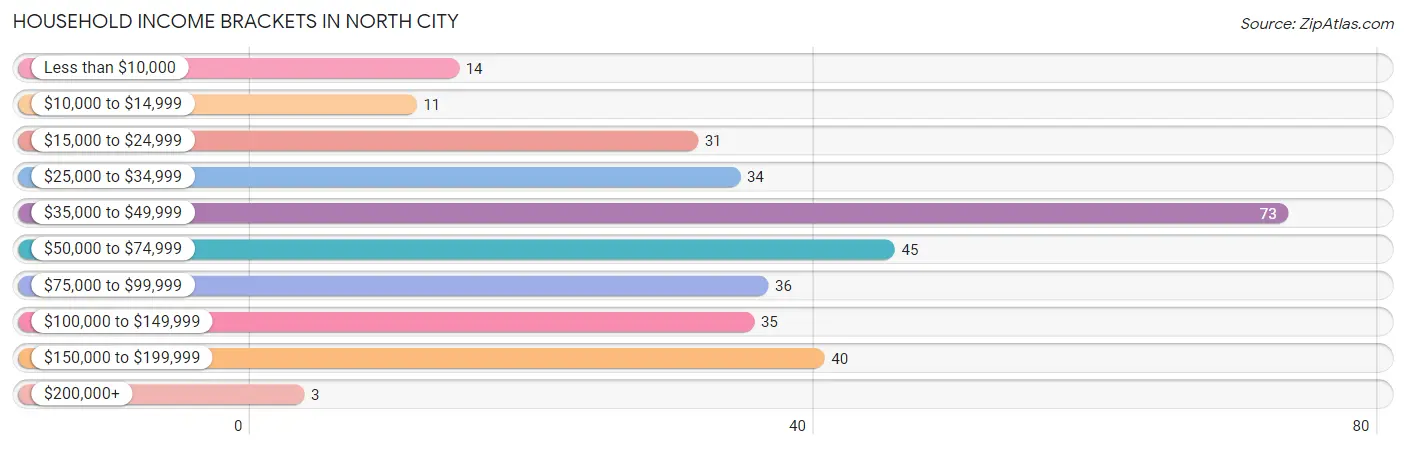
Household Income Brackets in North City
With 73 households falling in the category, the $35,000 to $49,999 income range is the most frequent in North City, accounting for 22.7% of all households. In contrast, only 3 households (0.9%) fall into the $200,000+ income bracket, making it the least populous group.
| Income Bracket | # Households | % Households |
| Less than $10,000 | 14 | 4.3% |
| $10,000 to $14,999 | 11 | 3.4% |
| $15,000 to $24,999 | 31 | 9.6% |
| $25,000 to $34,999 | 34 | 10.6% |
| $35,000 to $49,999 | 73 | 22.7% |
| $50,000 to $74,999 | 45 | 14.0% |
| $75,000 to $99,999 | 36 | 11.2% |
| $100,000 to $149,999 | 35 | 10.9% |
| $150,000 to $199,999 | 40 | 12.4% |
| $200,000+ | 3 | 0.9% |
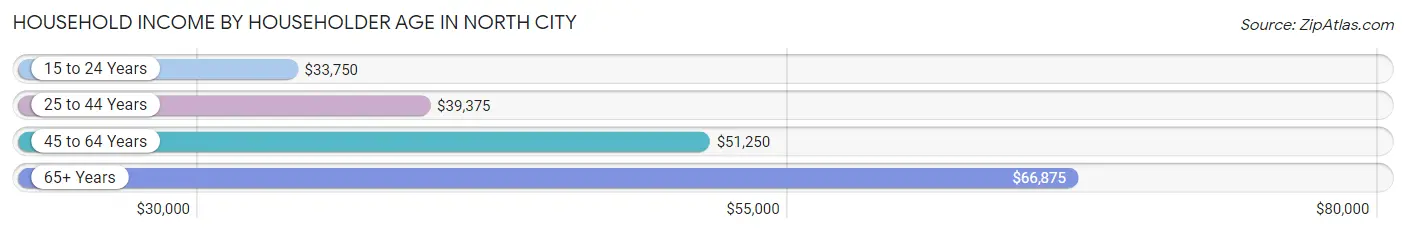
Household Income by Householder Age in North City
The median household income in North City is $49,167, with the highest median household income of $66,875 found in the 65+ years age bracket for the primary householder. A total of 128 households (39.8%) fall into this category. Meanwhile, the 15 to 24 years age bracket for the primary householder has the lowest median household income of $33,750, with 19 households (5.9%) in this group.
| Income Bracket | # Households | Median Income |
| 15 to 24 Years | 19 (5.9%) | $33,750 |
| 25 to 44 Years | 39 (12.1%) | $39,375 |
| 45 to 64 Years | 136 (42.2%) | $51,250 |
| 65+ Years | 128 (39.8%) | $66,875 |
| Total | 322 (100.0%) | $49,167 |
Poverty in North City
Income Below Poverty by Sex and Age in North City
With 11.2% poverty level for males and 10.5% for females among the residents of North City, 18 to 24 year old males and 25 to 34 year old females are the most vulnerable to poverty, with 22 males (55.0%) and 2 females (100.0%) in their respective age groups living below the poverty level.
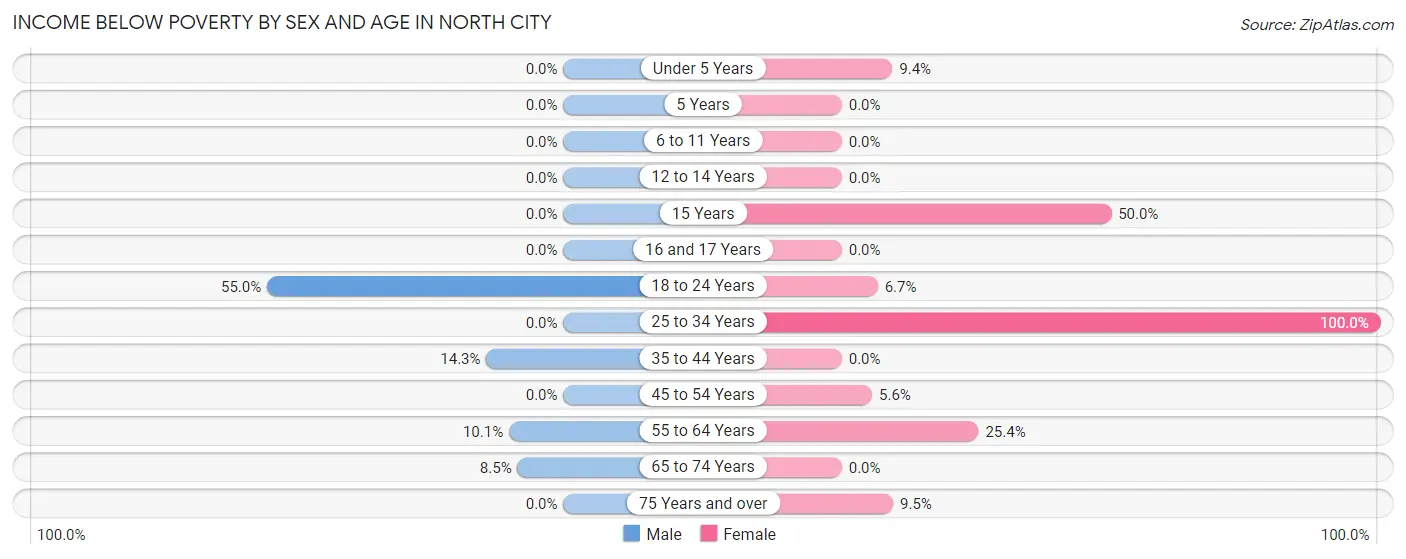
| Age Bracket | Male | Female |
| Under 5 Years | 0 (0.0%) | 3 (9.4%) |
| 5 Years | 0 (0.0%) | 0 (0.0%) |
| 6 to 11 Years | 0 (0.0%) | 0 (0.0%) |
| 12 to 14 Years | 0 (0.0%) | 0 (0.0%) |
| 15 Years | 0 (0.0%) | 4 (50.0%) |
| 16 and 17 Years | 0 (0.0%) | 0 (0.0%) |
| 18 to 24 Years | 22 (55.0%) | 1 (6.7%) |
| 25 to 34 Years | 0 (0.0%) | 2 (100.0%) |
| 35 to 44 Years | 6 (14.3%) | 0 (0.0%) |
| 45 to 54 Years | 0 (0.0%) | 4 (5.6%) |
| 55 to 64 Years | 11 (10.1%) | 17 (25.4%) |
| 65 to 74 Years | 4 (8.5%) | 0 (0.0%) |
| 75 Years and over | 0 (0.0%) | 2 (9.5%) |
| Total | 43 (11.2%) | 33 (10.5%) |
Income Above Poverty by Sex and Age in North City
According to the poverty statistics in North City, males aged under 5 years and females aged 6 to 11 years are the age groups that are most secure financially, with 100.0% of males and 100.0% of females in these age groups living above the poverty line.
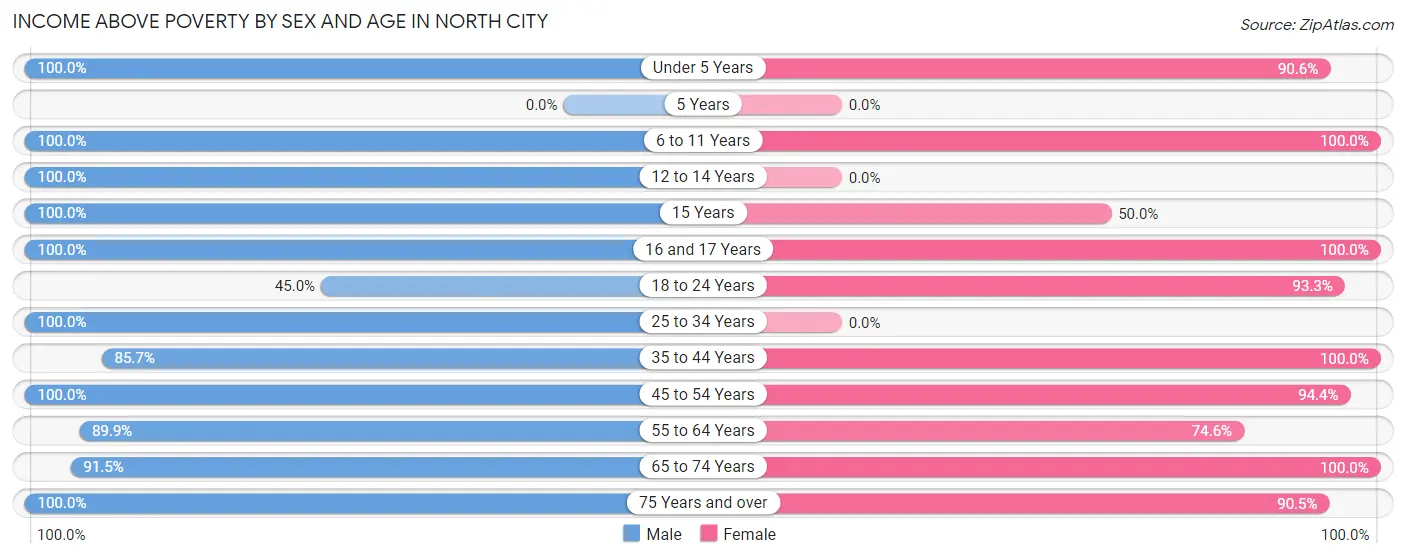
| Age Bracket | Male | Female |
| Under 5 Years | 1 (100.0%) | 29 (90.6%) |
| 5 Years | 0 (0.0%) | 0 (0.0%) |
| 6 to 11 Years | 5 (100.0%) | 9 (100.0%) |
| 12 to 14 Years | 13 (100.0%) | 0 (0.0%) |
| 15 Years | 10 (100.0%) | 4 (50.0%) |
| 16 and 17 Years | 8 (100.0%) | 3 (100.0%) |
| 18 to 24 Years | 18 (45.0%) | 14 (93.3%) |
| 25 to 34 Years | 35 (100.0%) | 0 (0.0%) |
| 35 to 44 Years | 36 (85.7%) | 22 (100.0%) |
| 45 to 54 Years | 29 (100.0%) | 67 (94.4%) |
| 55 to 64 Years | 98 (89.9%) | 50 (74.6%) |
| 65 to 74 Years | 43 (91.5%) | 63 (100.0%) |
| 75 Years and over | 45 (100.0%) | 19 (90.5%) |
| Total | 341 (88.8%) | 280 (89.5%) |
Income Below Poverty Among Married-Couple Families in North City
The poverty statistics for married-couple families in North City show that 1.7% or 3 of the total 176 families live below the poverty line. Families with no children have the highest poverty rate of 2.1%, comprising of 3 families. On the other hand, families with 1 or 2 children have the lowest poverty rate of 0.0%, which includes 0 families.
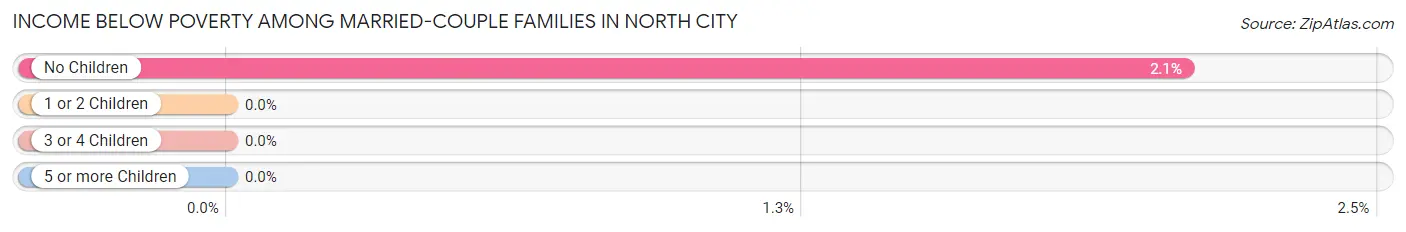
| Children | Above Poverty | Below Poverty |
| No Children | 141 (97.9%) | 3 (2.1%) |
| 1 or 2 Children | 27 (100.0%) | 0 (0.0%) |
| 3 or 4 Children | 5 (100.0%) | 0 (0.0%) |
| 5 or more Children | 0 (0.0%) | 0 (0.0%) |
| Total | 173 (98.3%) | 3 (1.7%) |
Income Below Poverty Among Single-Parent Households in North City
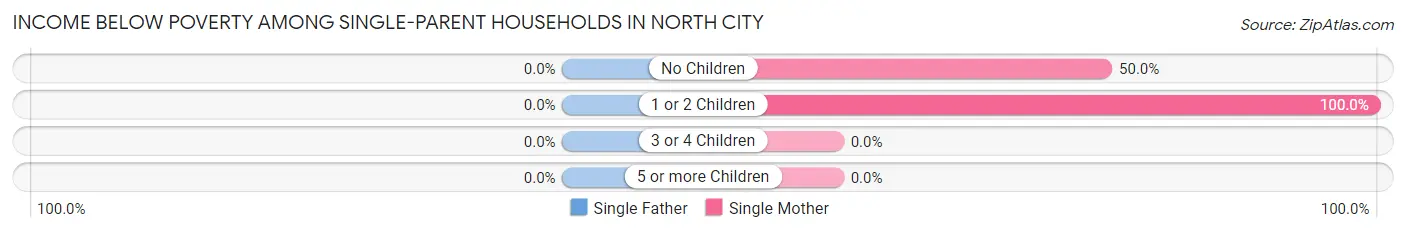
| Children | Single Father | Single Mother |
| No Children | 0 (0.0%) | 3 (50.0%) |
| 1 or 2 Children | 0 (0.0%) | 2 (100.0%) |
| 3 or 4 Children | 0 (0.0%) | 0 (0.0%) |
| 5 or more Children | 0 (0.0%) | 0 (0.0%) |
| Total | 0 (0.0%) | 5 (41.7%) |
Income Below Poverty Among Married-Couple vs Single-Parent Households in North City
The poverty data for North City shows that 3 of the married-couple family households (1.7%) and 5 of the single-parent households (41.7%) are living below the poverty level. Within the married-couple family households, those with no children have the highest poverty rate, with 3 households (2.1%) falling below the poverty line. Among the single-parent households, those with 1 or 2 children have the highest poverty rate, with 2 household (100.0%) living below poverty.
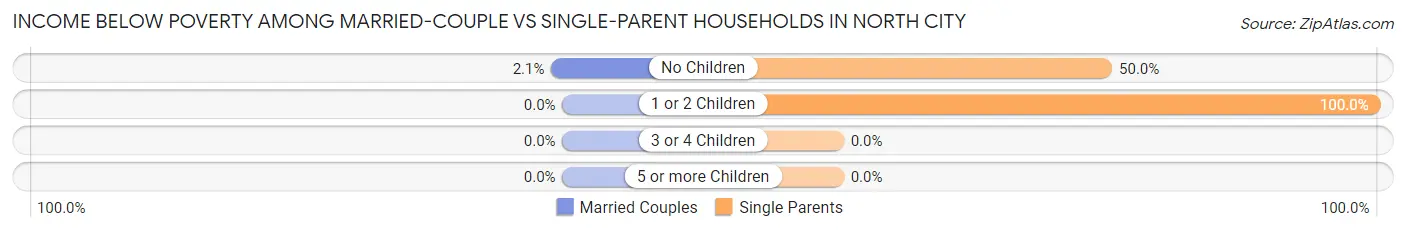
| Children | Married-Couple Families | Single-Parent Households |
| No Children | 3 (2.1%) | 3 (50.0%) |
| 1 or 2 Children | 0 (0.0%) | 2 (100.0%) |
| 3 or 4 Children | 0 (0.0%) | 0 (0.0%) |
| 5 or more Children | 0 (0.0%) | 0 (0.0%) |
| Total | 3 (1.7%) | 5 (41.7%) |
Employment Characteristics in North City
Employment by Class of Employer in North City
Among the 278 employed individuals in North City, private company employees (187 | 67.3%), self-employed (incorporated) (37 | 13.3%), and local government employees (26 | 9.3%) make up the most common classes of employment.
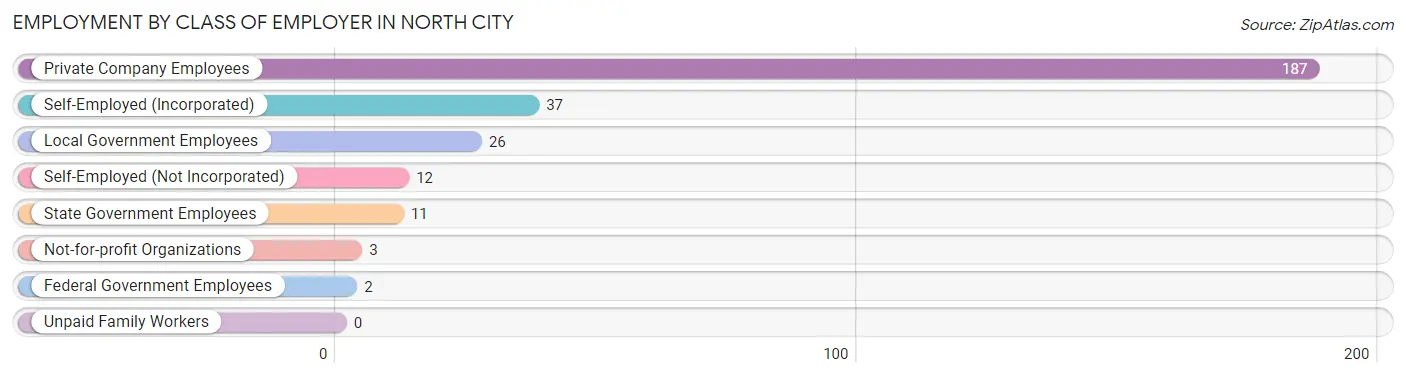
| Employer Class | # Employees | % Employees |
| Private Company Employees | 187 | 67.3% |
| Self-Employed (Incorporated) | 37 | 13.3% |
| Self-Employed (Not Incorporated) | 12 | 4.3% |
| Not-for-profit Organizations | 3 | 1.1% |
| Local Government Employees | 26 | 9.3% |
| State Government Employees | 11 | 4.0% |
| Federal Government Employees | 2 | 0.7% |
| Unpaid Family Workers | 0 | 0.0% |
| Total | 278 | 100.0% |
Employment Status by Age in North City
According to the labor force statistics for North City, out of the total population over 16 years of age (619), 51.1% or 316 individuals are in the labor force, with 10.1% or 32 of them unemployed. The age group with the highest labor force participation rate is 20 to 24 years, with 83.0% or 39 individuals in the labor force. Within the labor force, the 35 to 44 years age range has the highest percentage of unemployed individuals, with 34.9% or 15 of them being unemployed.
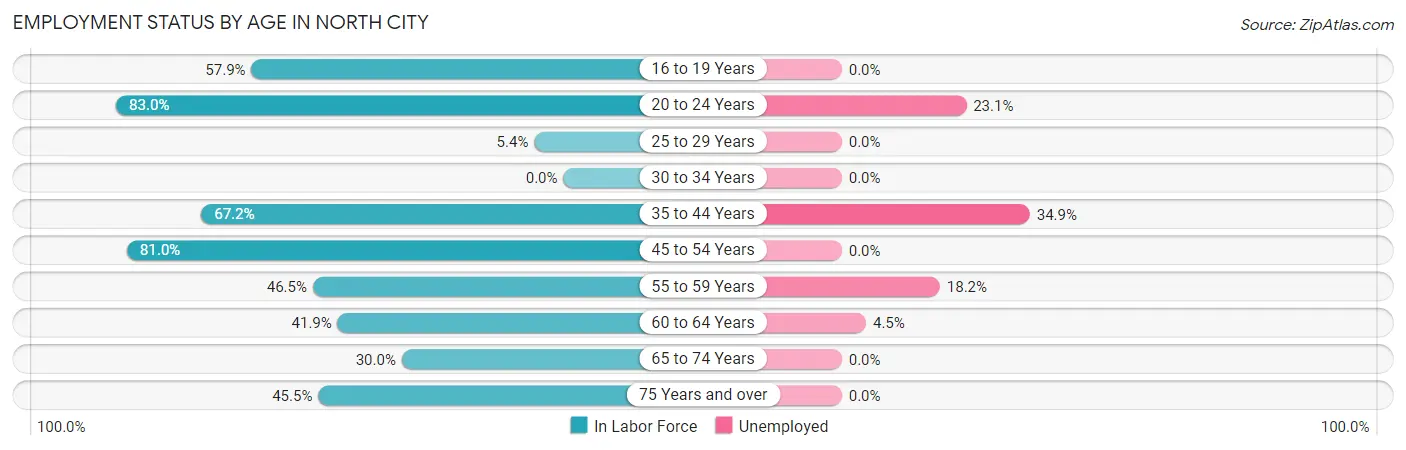
| Age Bracket | In Labor Force | Unemployed |
| 16 to 19 Years | 11 (57.9%) | 0 (0.0%) |
| 20 to 24 Years | 39 (83.0%) | 9 (23.1%) |
| 25 to 29 Years | 2 (5.4%) | 0 (0.0%) |
| 30 to 34 Years | 0 (0.0%) | 0 (0.0%) |
| 35 to 44 Years | 43 (67.2%) | 15 (34.9%) |
| 45 to 54 Years | 81 (81.0%) | 0 (0.0%) |
| 55 to 59 Years | 33 (46.5%) | 6 (18.2%) |
| 60 to 64 Years | 44 (41.9%) | 2 (4.5%) |
| 65 to 74 Years | 33 (30.0%) | 0 (0.0%) |
| 75 Years and over | 30 (45.5%) | 0 (0.0%) |
| Total | 316 (51.1%) | 32 (10.1%) |
Employment Status by Educational Attainment in North City
According to labor force statistics for North City, 53.8% of individuals (203) out of the total population between 25 and 64 years of age (377) are in the labor force, with 11.3% or 23 of them being unemployed. The group with the highest labor force participation rate are those with the educational attainment of less than high school, with 76.5% or 13 individuals in the labor force. Within the labor force, individuals with less than high school education have the highest percentage of unemployment, with 23.1% or 3 of them being unemployed.
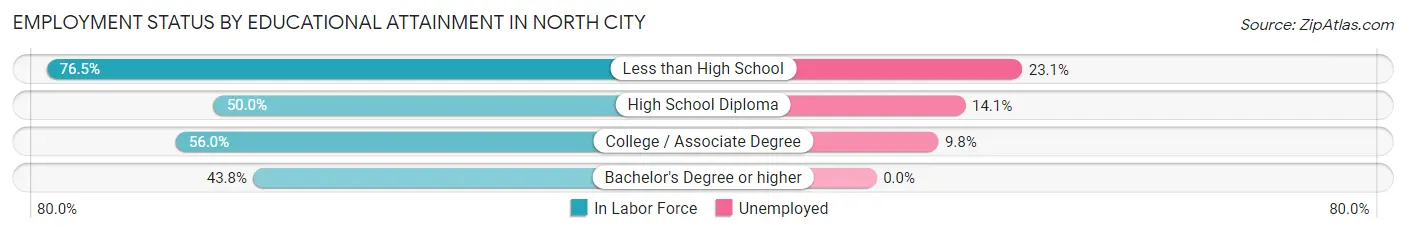
| Educational Attainment | In Labor Force | Unemployed |
| Less than High School | 13 (76.5%) | 4 (23.1%) |
| High School Diploma | 64 (50.0%) | 18 (14.1%) |
| College / Associate Degree | 112 (56.0%) | 20 (9.8%) |
| Bachelor's Degree or higher | 14 (43.8%) | 0 (0.0%) |
| Total | 203 (53.8%) | 43 (11.3%) |
Employment Occupations by Sex in North City
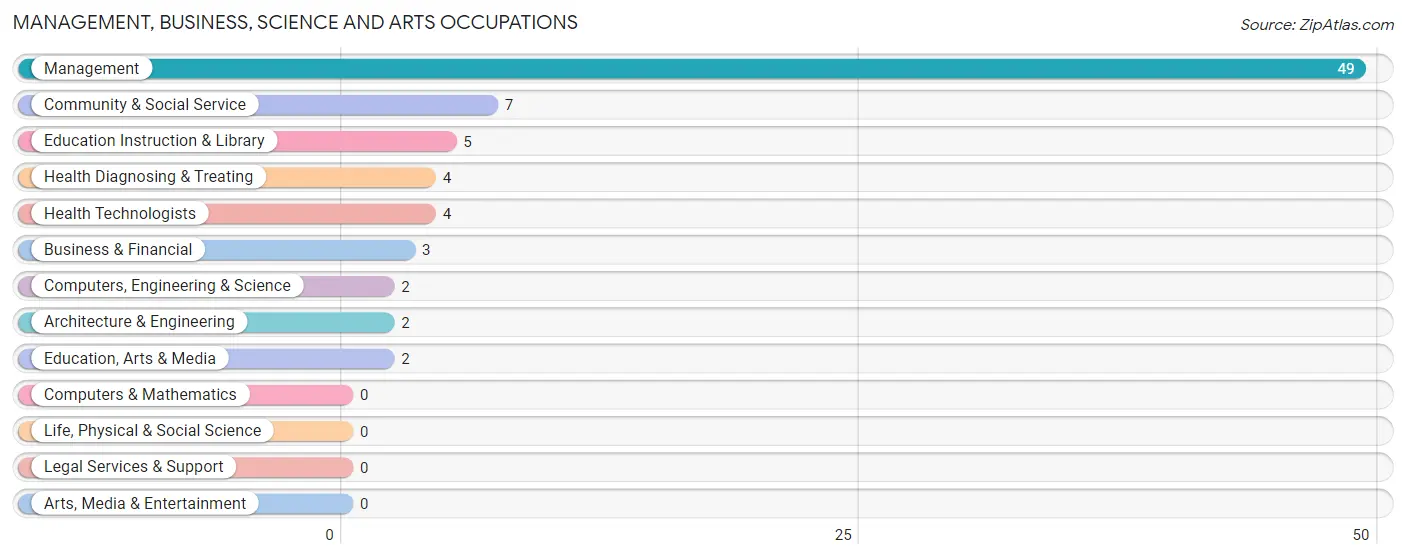
Management, Business, Science and Arts Occupations
The most common Management, Business, Science and Arts occupations in North City are Management (49 | 17.2%), Community & Social Service (7 | 2.5%), Education Instruction & Library (5 | 1.8%), Health Diagnosing & Treating (4 | 1.4%), and Health Technologists (4 | 1.4%).
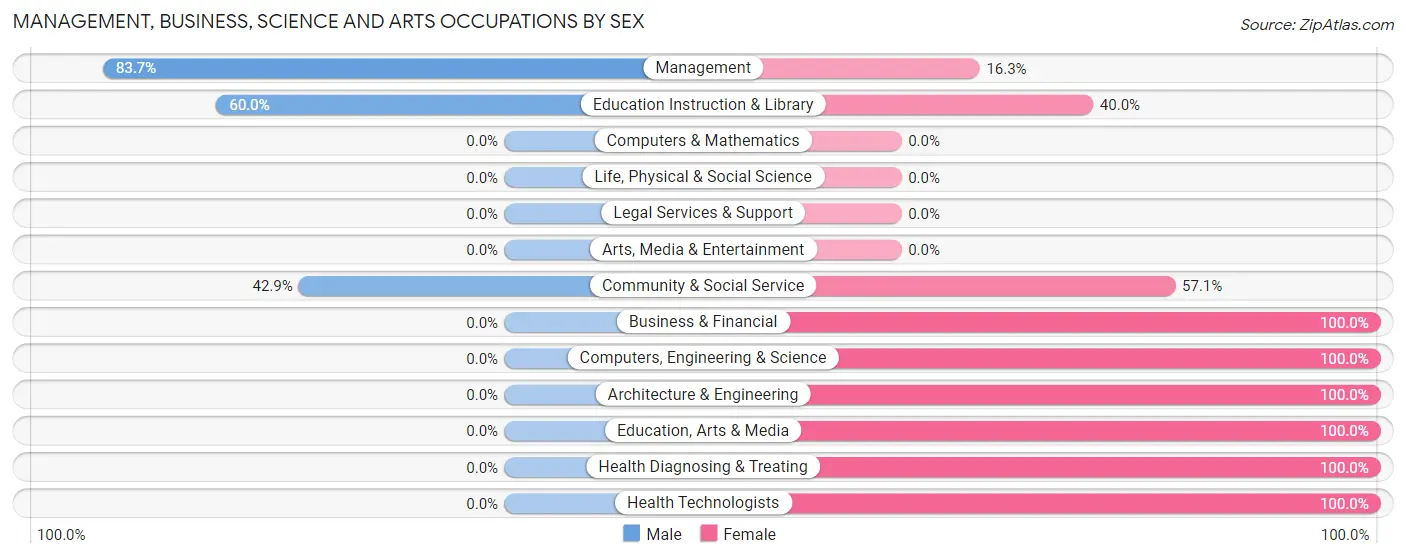
Management, Business, Science and Arts Occupations by Sex
Within the Management, Business, Science and Arts occupations in North City, the most male-oriented occupations are Management (83.7%), Education Instruction & Library (60.0%), and Community & Social Service (42.9%), while the most female-oriented occupations are Business & Financial (100.0%), Computers, Engineering & Science (100.0%), and Architecture & Engineering (100.0%).
| Occupation | Male | Female |
| Management | 41 (83.7%) | 8 (16.3%) |
| Business & Financial | 0 (0.0%) | 3 (100.0%) |
| Computers, Engineering & Science | 0 (0.0%) | 2 (100.0%) |
| Computers & Mathematics | 0 (0.0%) | 0 (0.0%) |
| Architecture & Engineering | 0 (0.0%) | 2 (100.0%) |
| Life, Physical & Social Science | 0 (0.0%) | 0 (0.0%) |
| Community & Social Service | 3 (42.9%) | 4 (57.1%) |
| Education, Arts & Media | 0 (0.0%) | 2 (100.0%) |
| Legal Services & Support | 0 (0.0%) | 0 (0.0%) |
| Education Instruction & Library | 3 (60.0%) | 2 (40.0%) |
| Arts, Media & Entertainment | 0 (0.0%) | 0 (0.0%) |
| Health Diagnosing & Treating | 0 (0.0%) | 4 (100.0%) |
| Health Technologists | 0 (0.0%) | 4 (100.0%) |
| Total (Category) | 44 (67.7%) | 21 (32.3%) |
| Total (Overall) | 164 (57.8%) | 120 (42.2%) |
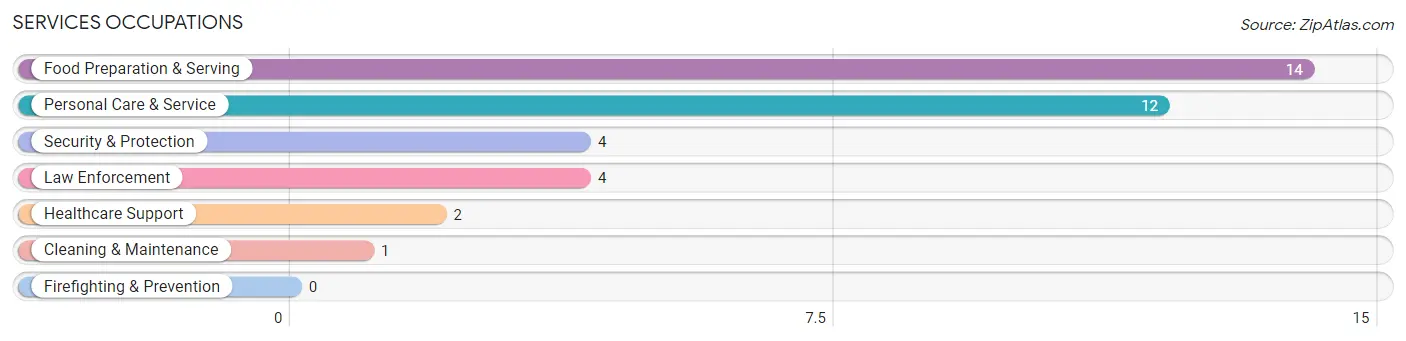
Services Occupations
The most common Services occupations in North City are Food Preparation & Serving (14 | 4.9%), Personal Care & Service (12 | 4.2%), Security & Protection (4 | 1.4%), Law Enforcement (4 | 1.4%), and Healthcare Support (2 | 0.7%).
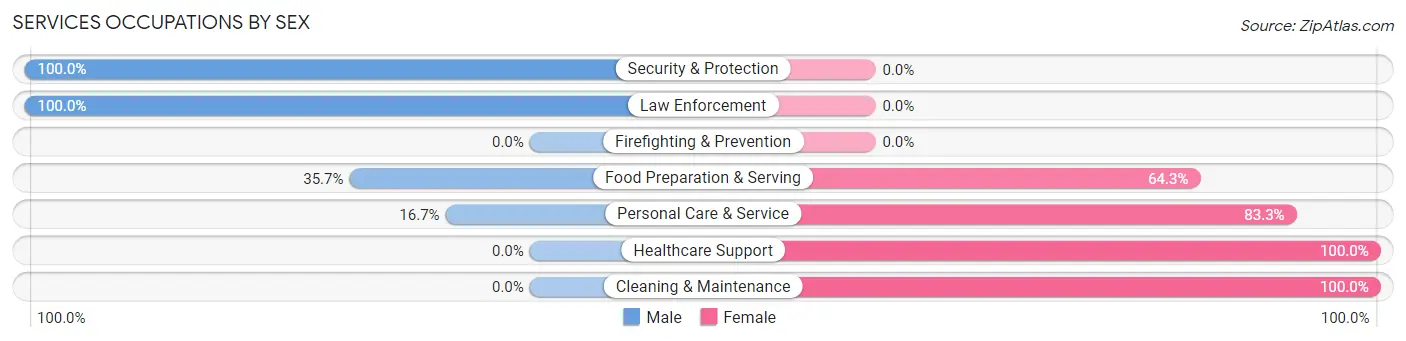
Services Occupations by Sex
Within the Services occupations in North City, the most male-oriented occupations are Security & Protection (100.0%), Law Enforcement (100.0%), and Food Preparation & Serving (35.7%), while the most female-oriented occupations are Healthcare Support (100.0%), Cleaning & Maintenance (100.0%), and Personal Care & Service (83.3%).
| Occupation | Male | Female |
| Healthcare Support | 0 (0.0%) | 2 (100.0%) |
| Security & Protection | 4 (100.0%) | 0 (0.0%) |
| Firefighting & Prevention | 0 (0.0%) | 0 (0.0%) |
| Law Enforcement | 4 (100.0%) | 0 (0.0%) |
| Food Preparation & Serving | 5 (35.7%) | 9 (64.3%) |
| Cleaning & Maintenance | 0 (0.0%) | 1 (100.0%) |
| Personal Care & Service | 2 (16.7%) | 10 (83.3%) |
| Total (Category) | 11 (33.3%) | 22 (66.7%) |
| Total (Overall) | 164 (57.8%) | 120 (42.2%) |
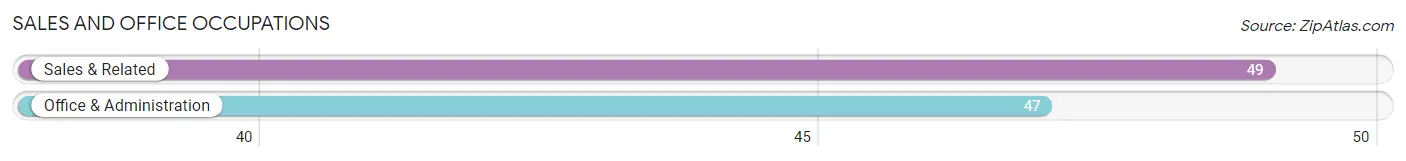
Sales and Office Occupations
The most common Sales and Office occupations in North City are Sales & Related (49 | 17.2%), and Office & Administration (47 | 16.6%).
Sales and Office Occupations by Sex
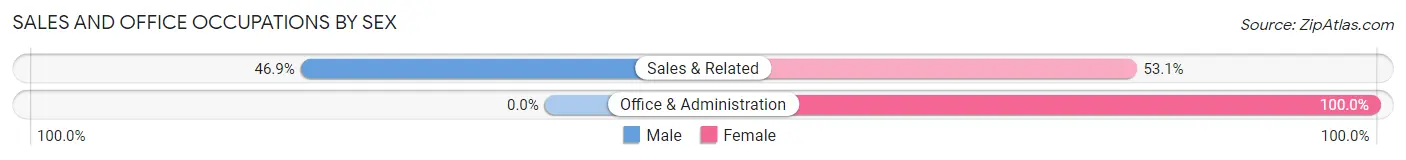
| Occupation | Male | Female |
| Sales & Related | 23 (46.9%) | 26 (53.1%) |
| Office & Administration | 0 (0.0%) | 47 (100.0%) |
| Total (Category) | 23 (24.0%) | 73 (76.0%) |
| Total (Overall) | 164 (57.8%) | 120 (42.2%) |
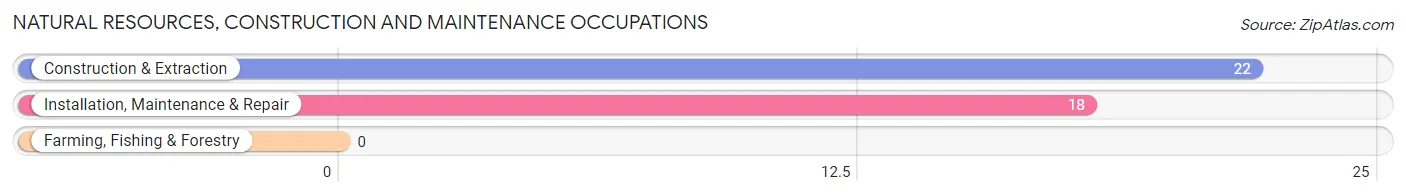
Natural Resources, Construction and Maintenance Occupations
The most common Natural Resources, Construction and Maintenance occupations in North City are Construction & Extraction (22 | 7.7%), and Installation, Maintenance & Repair (18 | 6.3%).
Natural Resources, Construction and Maintenance Occupations by Sex
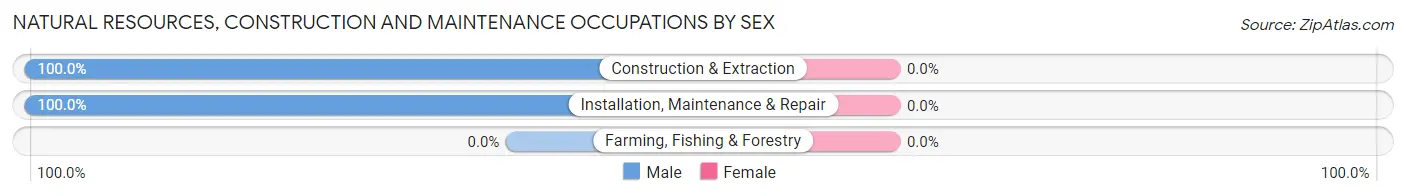
| Occupation | Male | Female |
| Farming, Fishing & Forestry | 0 (0.0%) | 0 (0.0%) |
| Construction & Extraction | 22 (100.0%) | 0 (0.0%) |
| Installation, Maintenance & Repair | 18 (100.0%) | 0 (0.0%) |
| Total (Category) | 40 (100.0%) | 0 (0.0%) |
| Total (Overall) | 164 (57.8%) | 120 (42.2%) |
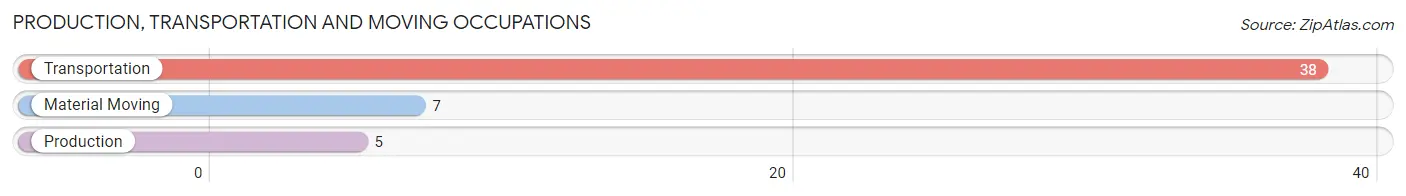
Production, Transportation and Moving Occupations
The most common Production, Transportation and Moving occupations in North City are Transportation (38 | 13.4%), Material Moving (7 | 2.5%), and Production (5 | 1.8%).
Production, Transportation and Moving Occupations by Sex
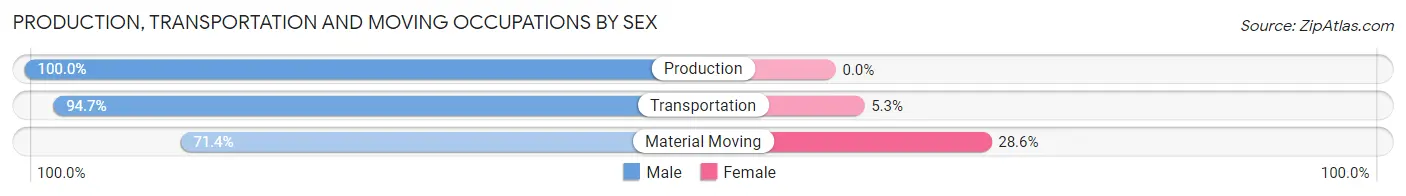
| Occupation | Male | Female |
| Production | 5 (100.0%) | 0 (0.0%) |
| Transportation | 36 (94.7%) | 2 (5.3%) |
| Material Moving | 5 (71.4%) | 2 (28.6%) |
| Total (Category) | 46 (92.0%) | 4 (8.0%) |
| Total (Overall) | 164 (57.8%) | 120 (42.2%) |
Employment Industries by Sex in North City
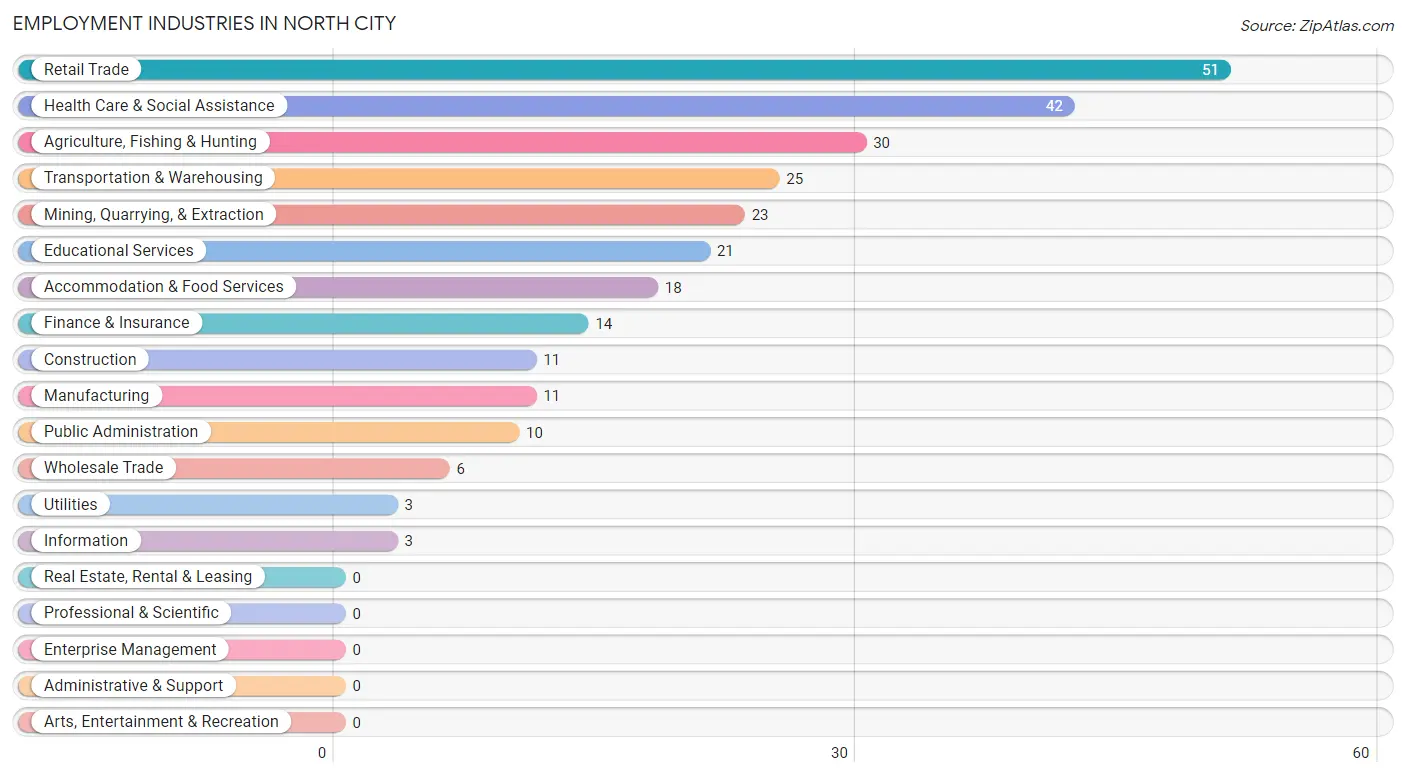
Employment Industries in North City
The major employment industries in North City include Retail Trade (51 | 18.0%), Health Care & Social Assistance (42 | 14.8%), Agriculture, Fishing & Hunting (30 | 10.6%), Transportation & Warehousing (25 | 8.8%), and Mining, Quarrying, & Extraction (23 | 8.1%).
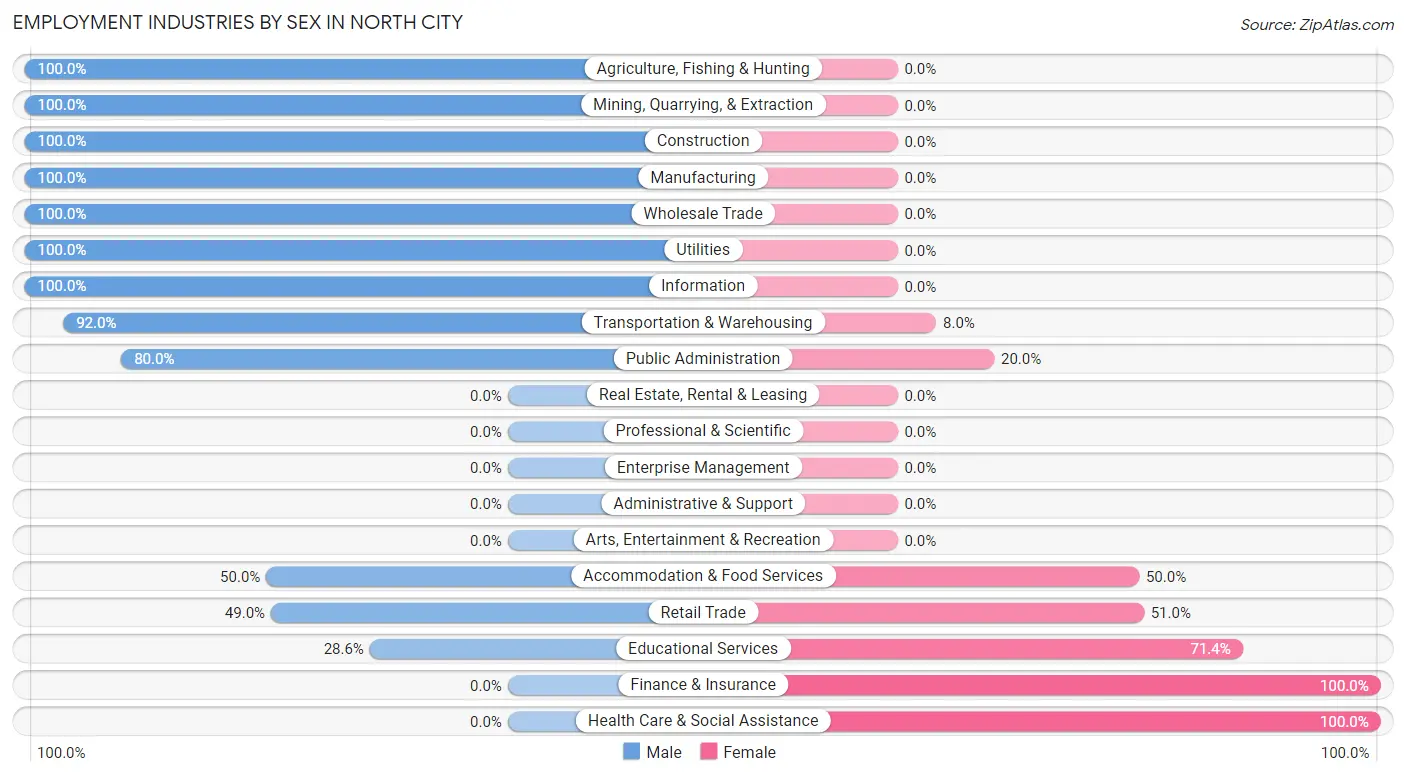
Employment Industries by Sex in North City
The North City industries that see more men than women are Agriculture, Fishing & Hunting (100.0%), Mining, Quarrying, & Extraction (100.0%), and Construction (100.0%), whereas the industries that tend to have a higher number of women are Finance & Insurance (100.0%), Health Care & Social Assistance (100.0%), and Educational Services (71.4%).
| Industry | Male | Female |
| Agriculture, Fishing & Hunting | 30 (100.0%) | 0 (0.0%) |
| Mining, Quarrying, & Extraction | 23 (100.0%) | 0 (0.0%) |
| Construction | 11 (100.0%) | 0 (0.0%) |
| Manufacturing | 11 (100.0%) | 0 (0.0%) |
| Wholesale Trade | 6 (100.0%) | 0 (0.0%) |
| Retail Trade | 25 (49.0%) | 26 (51.0%) |
| Transportation & Warehousing | 23 (92.0%) | 2 (8.0%) |
| Utilities | 3 (100.0%) | 0 (0.0%) |
| Information | 3 (100.0%) | 0 (0.0%) |
| Finance & Insurance | 0 (0.0%) | 14 (100.0%) |
| Real Estate, Rental & Leasing | 0 (0.0%) | 0 (0.0%) |
| Professional & Scientific | 0 (0.0%) | 0 (0.0%) |
| Enterprise Management | 0 (0.0%) | 0 (0.0%) |
| Administrative & Support | 0 (0.0%) | 0 (0.0%) |
| Educational Services | 6 (28.6%) | 15 (71.4%) |
| Health Care & Social Assistance | 0 (0.0%) | 42 (100.0%) |
| Arts, Entertainment & Recreation | 0 (0.0%) | 0 (0.0%) |
| Accommodation & Food Services | 9 (50.0%) | 9 (50.0%) |
| Public Administration | 8 (80.0%) | 2 (20.0%) |
| Total | 164 (57.8%) | 120 (42.2%) |
Education in North City
School Enrollment in North City
The most common levels of schooling among the 66 students in North City are high school (34 | 51.5%), elementary school (11 | 16.7%), and middle school (11 | 16.7%).
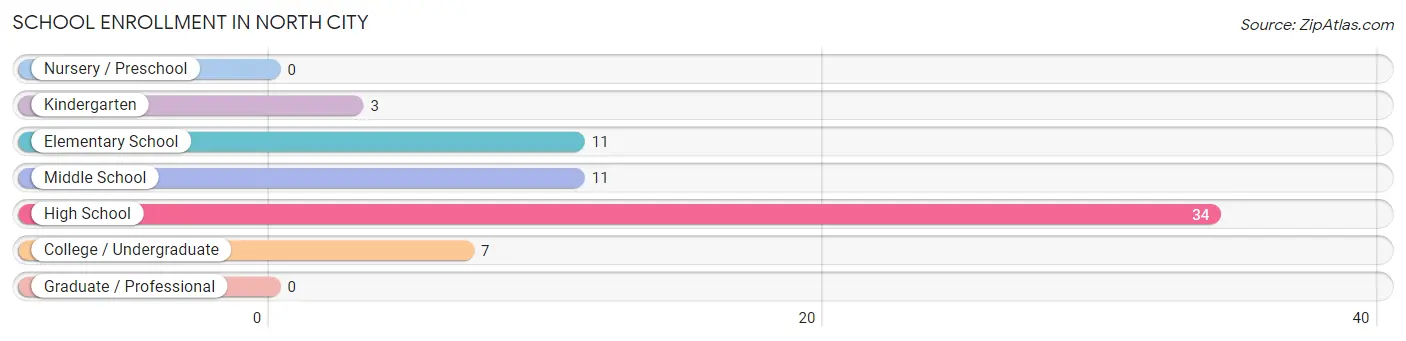
| School Level | # Students | % Students |
| Nursery / Preschool | 0 | 0.0% |
| Kindergarten | 3 | 4.5% |
| Elementary School | 11 | 16.7% |
| Middle School | 11 | 16.7% |
| High School | 34 | 51.5% |
| College / Undergraduate | 7 | 10.6% |
| Graduate / Professional | 0 | 0.0% |
| Total | 66 | 100.0% |
School Enrollment by Age by Funding Source in North City
Out of a total of 66 students who are enrolled in schools in North City, 3 (4.5%) attend a private institution, while the remaining 63 (95.5%) are enrolled in public schools. The age group of 20 to 24 year olds has the highest likelihood of being enrolled in private schools, with 3 (100.0% in the age bracket) enrolled. Conversely, the age group of 5 to 9 year old has the lowest likelihood of being enrolled in a private school, with 14 (100.0% in the age bracket) attending a public institution.
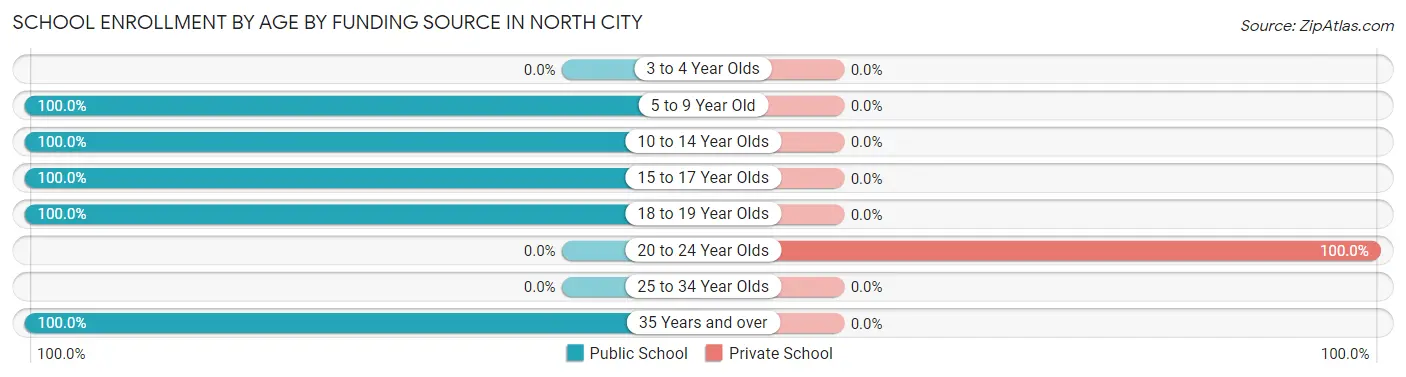
| Age Bracket | Public School | Private School |
| 3 to 4 Year Olds | 0 (0.0%) | 0 (0.0%) |
| 5 to 9 Year Old | 14 (100.0%) | 0 (0.0%) |
| 10 to 14 Year Olds | 13 (100.0%) | 0 (0.0%) |
| 15 to 17 Year Olds | 29 (100.0%) | 0 (0.0%) |
| 18 to 19 Year Olds | 5 (100.0%) | 0 (0.0%) |
| 20 to 24 Year Olds | 0 (0.0%) | 3 (100.0%) |
| 25 to 34 Year Olds | 0 (0.0%) | 0 (0.0%) |
| 35 Years and over | 2 (100.0%) | 0 (0.0%) |
| Total | 63 (95.5%) | 3 (4.5%) |
Educational Attainment by Field of Study in North City
Computers & mathematics (24 | 49.0%), business (6 | 12.2%), engineering (5 | 10.2%), education (5 | 10.2%), and science & technology (4 | 8.2%) are the most common fields of study among 49 individuals in North City who have obtained a bachelor's degree or higher.
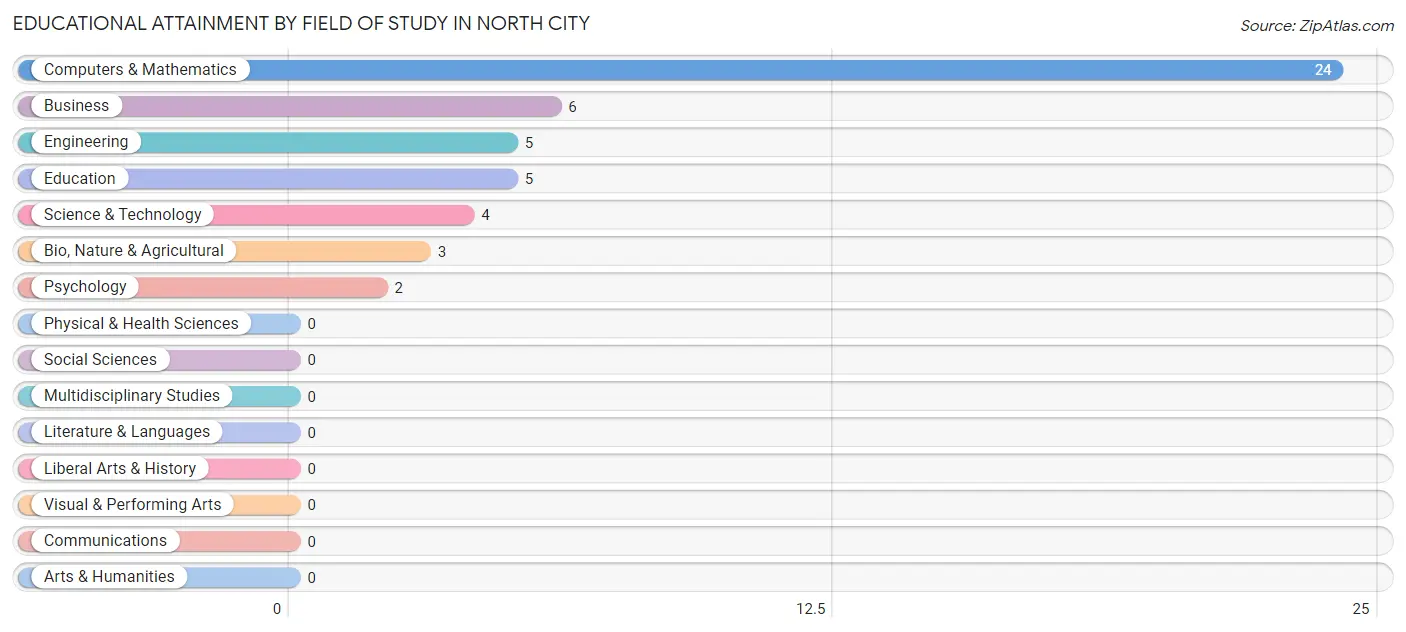
| Field of Study | # Graduates | % Graduates |
| Computers & Mathematics | 24 | 49.0% |
| Bio, Nature & Agricultural | 3 | 6.1% |
| Physical & Health Sciences | 0 | 0.0% |
| Psychology | 2 | 4.1% |
| Social Sciences | 0 | 0.0% |
| Engineering | 5 | 10.2% |
| Multidisciplinary Studies | 0 | 0.0% |
| Science & Technology | 4 | 8.2% |
| Business | 6 | 12.2% |
| Education | 5 | 10.2% |
| Literature & Languages | 0 | 0.0% |
| Liberal Arts & History | 0 | 0.0% |
| Visual & Performing Arts | 0 | 0.0% |
| Communications | 0 | 0.0% |
| Arts & Humanities | 0 | 0.0% |
| Total | 49 | 100.0% |
Transportation & Commute in North City
Vehicle Availability by Sex in North City
The most prevalent vehicle ownership categories in North City are males with 2 vehicles (104, accounting for 65.8%) and females with 2 vehicles (80, making up 86.7%).
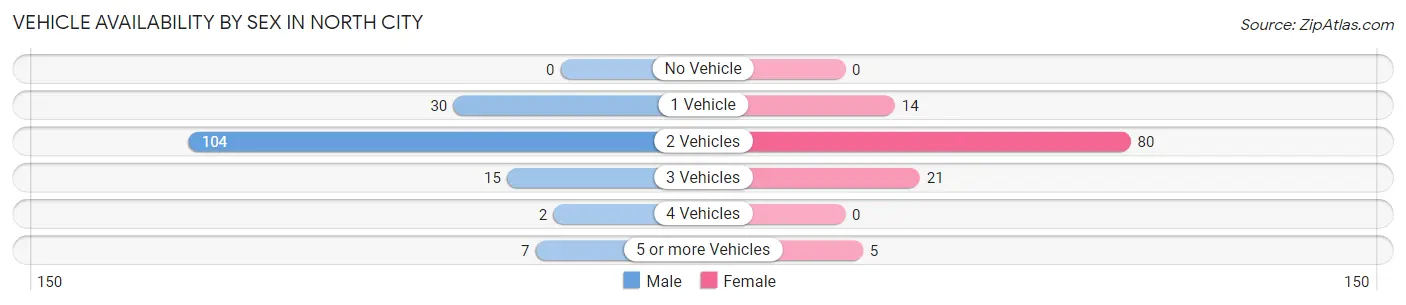
| Vehicles Available | Male | Female |
| No Vehicle | 0 (0.0%) | 0 (0.0%) |
| 1 Vehicle | 30 (19.0%) | 14 (11.7%) |
| 2 Vehicles | 104 (65.8%) | 80 (66.7%) |
| 3 Vehicles | 15 (9.5%) | 21 (17.5%) |
| 4 Vehicles | 2 (1.3%) | 0 (0.0%) |
| 5 or more Vehicles | 7 (4.4%) | 5 (4.2%) |
| Total | 158 (100.0%) | 120 (100.0%) |
Commute Time in North City
The most frequently occuring commute durations in North City are less than 5 minutes (47 commuters, 20.3%), 15 to 19 minutes (41 commuters, 17.7%), and 30 to 34 minutes (36 commuters, 15.6%).
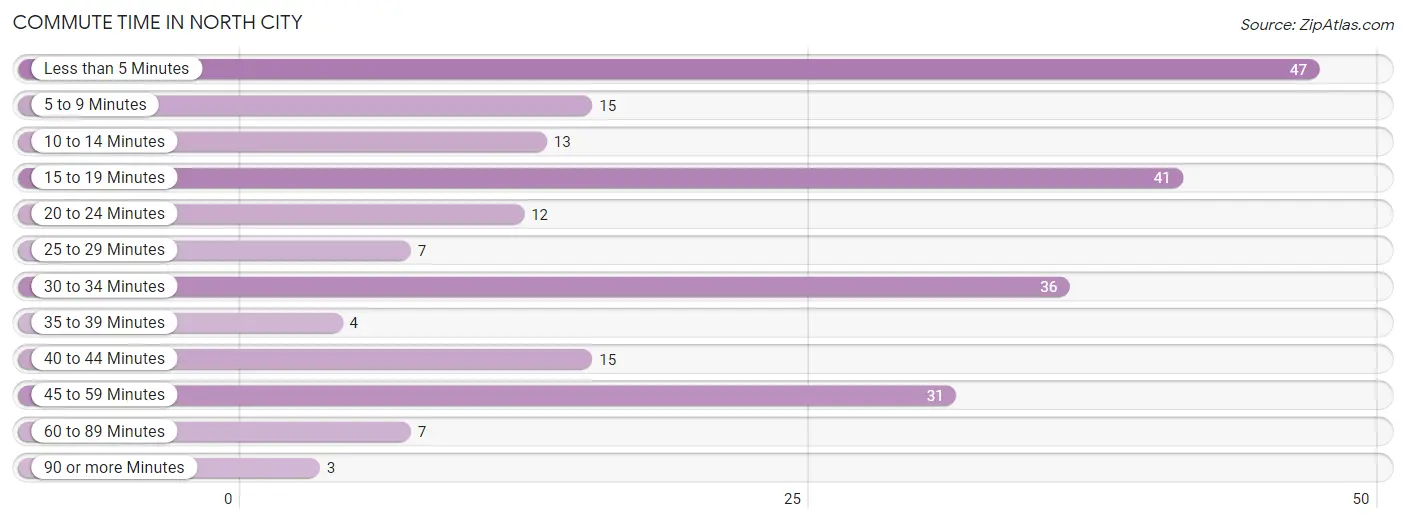
| Commute Time | # Commuters | % Commuters |
| Less than 5 Minutes | 47 | 20.3% |
| 5 to 9 Minutes | 15 | 6.5% |
| 10 to 14 Minutes | 13 | 5.6% |
| 15 to 19 Minutes | 41 | 17.7% |
| 20 to 24 Minutes | 12 | 5.2% |
| 25 to 29 Minutes | 7 | 3.0% |
| 30 to 34 Minutes | 36 | 15.6% |
| 35 to 39 Minutes | 4 | 1.7% |
| 40 to 44 Minutes | 15 | 6.5% |
| 45 to 59 Minutes | 31 | 13.4% |
| 60 to 89 Minutes | 7 | 3.0% |
| 90 or more Minutes | 3 | 1.3% |
Commute Time by Sex in North City
The most common commute times in North City are less than 5 minutes (45 commuters, 35.7%) for males and 30 to 34 minutes (34 commuters, 32.4%) for females.
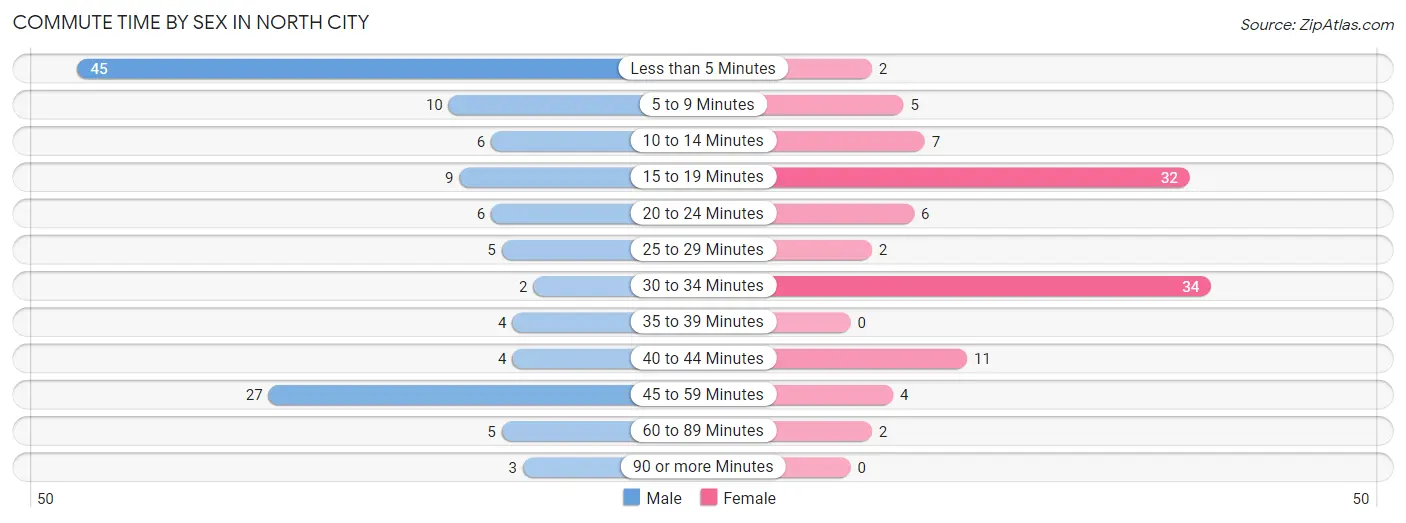
| Commute Time | Male | Female |
| Less than 5 Minutes | 45 (35.7%) | 2 (1.9%) |
| 5 to 9 Minutes | 10 (7.9%) | 5 (4.8%) |
| 10 to 14 Minutes | 6 (4.8%) | 7 (6.7%) |
| 15 to 19 Minutes | 9 (7.1%) | 32 (30.5%) |
| 20 to 24 Minutes | 6 (4.8%) | 6 (5.7%) |
| 25 to 29 Minutes | 5 (4.0%) | 2 (1.9%) |
| 30 to 34 Minutes | 2 (1.6%) | 34 (32.4%) |
| 35 to 39 Minutes | 4 (3.2%) | 0 (0.0%) |
| 40 to 44 Minutes | 4 (3.2%) | 11 (10.5%) |
| 45 to 59 Minutes | 27 (21.4%) | 4 (3.8%) |
| 60 to 89 Minutes | 5 (4.0%) | 2 (1.9%) |
| 90 or more Minutes | 3 (2.4%) | 0 (0.0%) |
Time of Departure to Work by Sex in North City
The most frequent times of departure to work in North City are 5:30 AM to 5:59 AM (24, 19.1%) for males and 6:00 AM to 6:29 AM (44, 41.9%) for females.
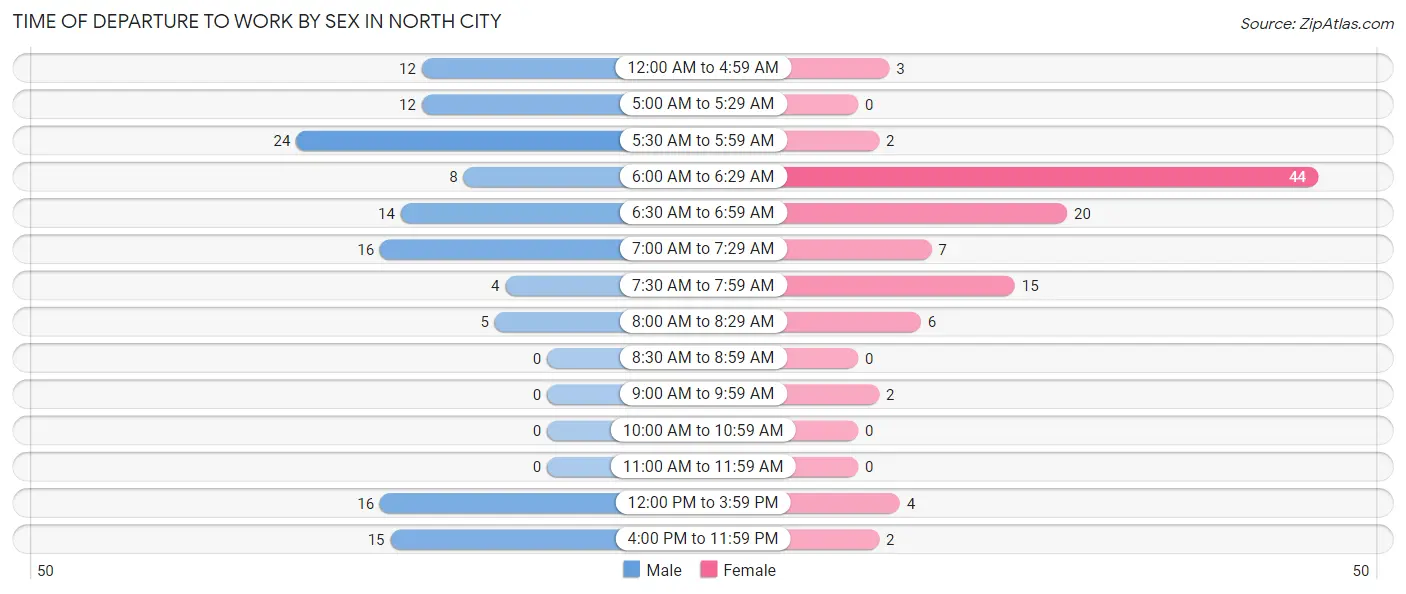
| Time of Departure | Male | Female |
| 12:00 AM to 4:59 AM | 12 (9.5%) | 3 (2.9%) |
| 5:00 AM to 5:29 AM | 12 (9.5%) | 0 (0.0%) |
| 5:30 AM to 5:59 AM | 24 (19.1%) | 2 (1.9%) |
| 6:00 AM to 6:29 AM | 8 (6.4%) | 44 (41.9%) |
| 6:30 AM to 6:59 AM | 14 (11.1%) | 20 (19.1%) |
| 7:00 AM to 7:29 AM | 16 (12.7%) | 7 (6.7%) |
| 7:30 AM to 7:59 AM | 4 (3.2%) | 15 (14.3%) |
| 8:00 AM to 8:29 AM | 5 (4.0%) | 6 (5.7%) |
| 8:30 AM to 8:59 AM | 0 (0.0%) | 0 (0.0%) |
| 9:00 AM to 9:59 AM | 0 (0.0%) | 2 (1.9%) |
| 10:00 AM to 10:59 AM | 0 (0.0%) | 0 (0.0%) |
| 11:00 AM to 11:59 AM | 0 (0.0%) | 0 (0.0%) |
| 12:00 PM to 3:59 PM | 16 (12.7%) | 4 (3.8%) |
| 4:00 PM to 11:59 PM | 15 (11.9%) | 2 (1.9%) |
| Total | 126 (100.0%) | 105 (100.0%) |
Housing Occupancy in North City
Occupancy by Ownership in North City
Of the total 322 dwellings in North City, owner-occupied units account for 288 (89.4%), while renter-occupied units make up 34 (10.6%).
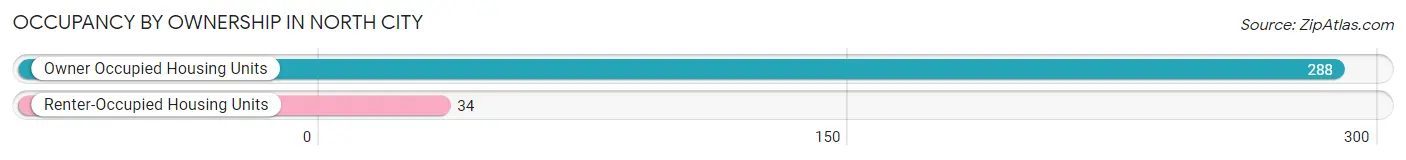
| Occupancy | # Housing Units | % Housing Units |
| Owner Occupied Housing Units | 288 | 89.4% |
| Renter-Occupied Housing Units | 34 | 10.6% |
| Total Occupied Housing Units | 322 | 100.0% |
Occupancy by Household Size in North City
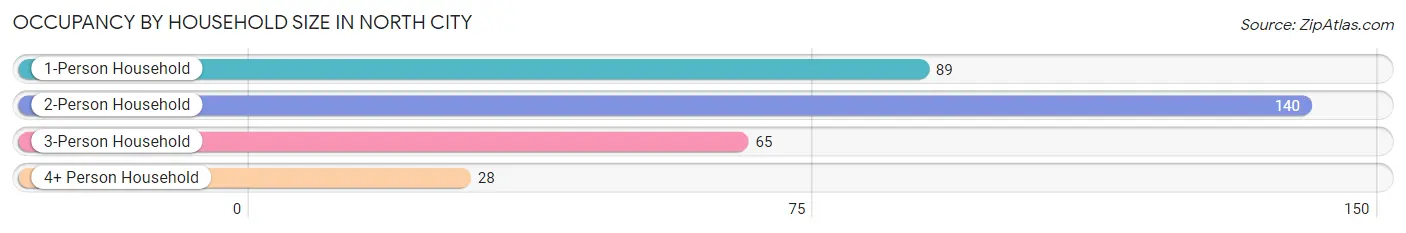
| Household Size | # Housing Units | % Housing Units |
| 1-Person Household | 89 | 27.6% |
| 2-Person Household | 140 | 43.5% |
| 3-Person Household | 65 | 20.2% |
| 4+ Person Household | 28 | 8.7% |
| Total Housing Units | 322 | 100.0% |
Occupancy by Ownership by Household Size in North City
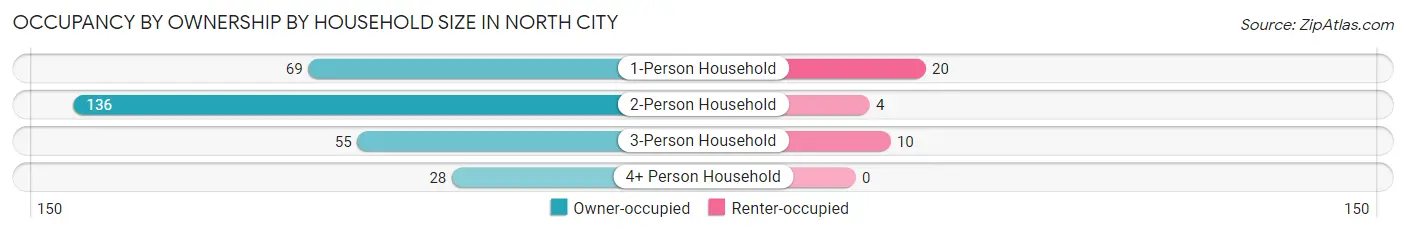
| Household Size | Owner-occupied | Renter-occupied |
| 1-Person Household | 69 (77.5%) | 20 (22.5%) |
| 2-Person Household | 136 (97.1%) | 4 (2.9%) |
| 3-Person Household | 55 (84.6%) | 10 (15.4%) |
| 4+ Person Household | 28 (100.0%) | 0 (0.0%) |
| Total Housing Units | 288 (89.4%) | 34 (10.6%) |
Occupancy by Educational Attainment in North City
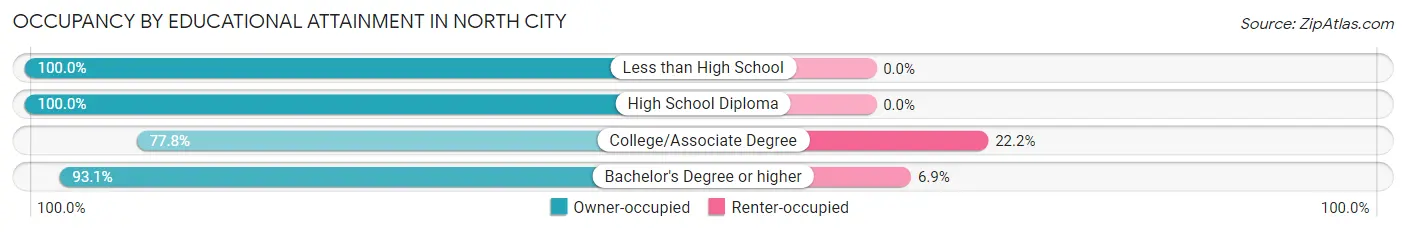
| Household Size | Owner-occupied | Renter-occupied |
| Less than High School | 16 (100.0%) | 0 (0.0%) |
| High School Diploma | 133 (100.0%) | 0 (0.0%) |
| College/Associate Degree | 112 (77.8%) | 32 (22.2%) |
| Bachelor's Degree or higher | 27 (93.1%) | 2 (6.9%) |
Occupancy by Age of Householder in North City
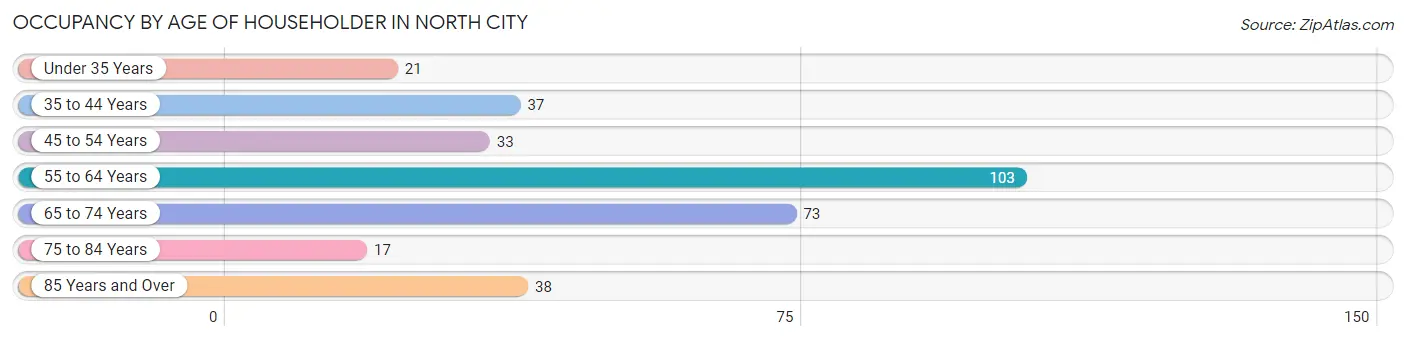
| Age Bracket | # Households | % Households |
| Under 35 Years | 21 | 6.5% |
| 35 to 44 Years | 37 | 11.5% |
| 45 to 54 Years | 33 | 10.2% |
| 55 to 64 Years | 103 | 32.0% |
| 65 to 74 Years | 73 | 22.7% |
| 75 to 84 Years | 17 | 5.3% |
| 85 Years and Over | 38 | 11.8% |
| Total | 322 | 100.0% |
Housing Finances in North City
Median Income by Occupancy in North City
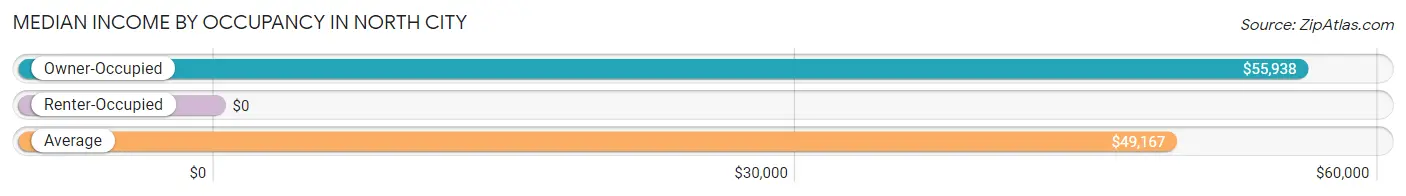
| Occupancy Type | # Households | Median Income |
| Owner-Occupied | 288 (89.4%) | $55,938 |
| Renter-Occupied | 34 (10.6%) | $0 |
| Average | 322 (100.0%) | $49,167 |
Occupancy by Householder Income Bracket in North City
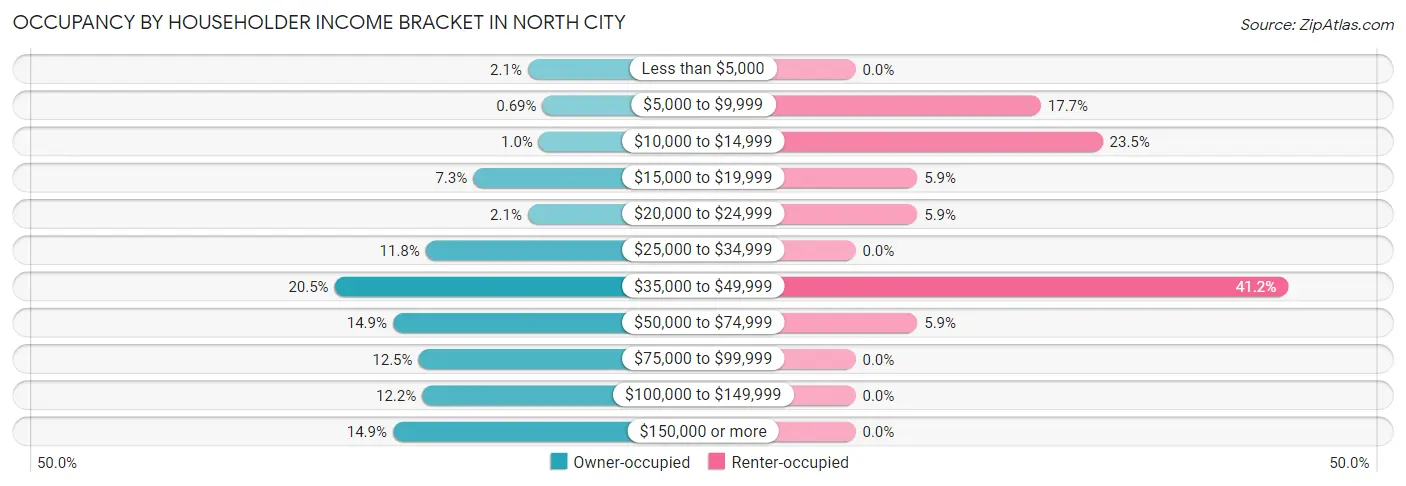
| Income Bracket | Owner-occupied | Renter-occupied |
| Less than $5,000 | 6 (2.1%) | 0 (0.0%) |
| $5,000 to $9,999 | 2 (0.7%) | 6 (17.6%) |
| $10,000 to $14,999 | 3 (1.0%) | 8 (23.5%) |
| $15,000 to $19,999 | 21 (7.3%) | 2 (5.9%) |
| $20,000 to $24,999 | 6 (2.1%) | 2 (5.9%) |
| $25,000 to $34,999 | 34 (11.8%) | 0 (0.0%) |
| $35,000 to $49,999 | 59 (20.5%) | 14 (41.2%) |
| $50,000 to $74,999 | 43 (14.9%) | 2 (5.9%) |
| $75,000 to $99,999 | 36 (12.5%) | 0 (0.0%) |
| $100,000 to $149,999 | 35 (12.1%) | 0 (0.0%) |
| $150,000 or more | 43 (14.9%) | 0 (0.0%) |
| Total | 288 (100.0%) | 34 (100.0%) |
Monthly Housing Cost Tiers in North City
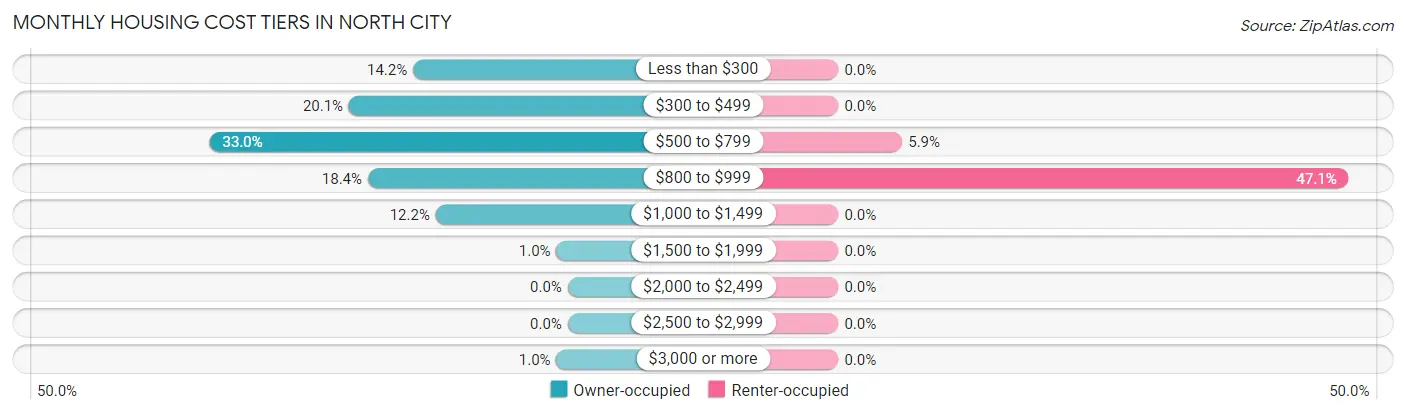
| Monthly Cost | Owner-occupied | Renter-occupied |
| Less than $300 | 41 (14.2%) | 0 (0.0%) |
| $300 to $499 | 58 (20.1%) | 0 (0.0%) |
| $500 to $799 | 95 (33.0%) | 2 (5.9%) |
| $800 to $999 | 53 (18.4%) | 16 (47.1%) |
| $1,000 to $1,499 | 35 (12.1%) | 0 (0.0%) |
| $1,500 to $1,999 | 3 (1.0%) | 0 (0.0%) |
| $2,000 to $2,499 | 0 (0.0%) | 0 (0.0%) |
| $2,500 to $2,999 | 0 (0.0%) | 0 (0.0%) |
| $3,000 or more | 3 (1.0%) | 0 (0.0%) |
| Total | 288 (100.0%) | 34 (100.0%) |
Physical Housing Characteristics in North City
Housing Structures in North City
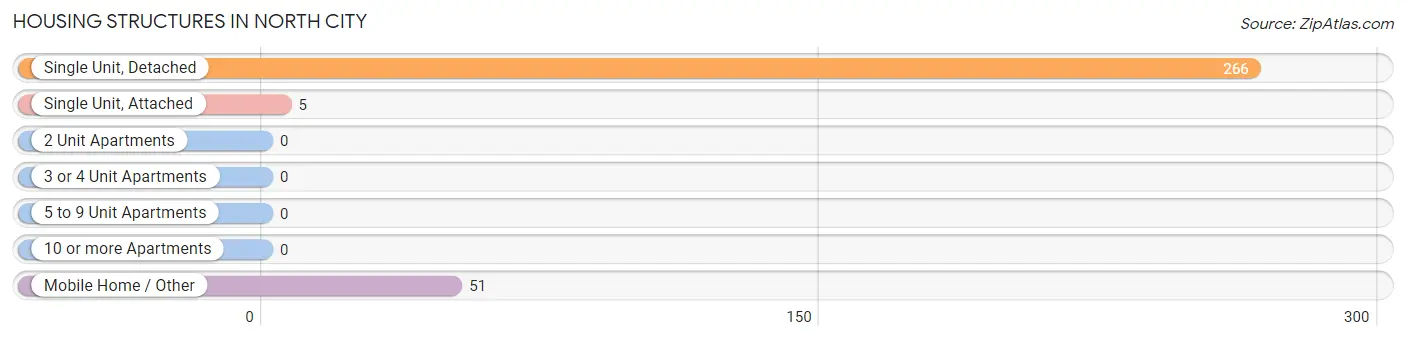
| Structure Type | # Housing Units | % Housing Units |
| Single Unit, Detached | 266 | 82.6% |
| Single Unit, Attached | 5 | 1.5% |
| 2 Unit Apartments | 0 | 0.0% |
| 3 or 4 Unit Apartments | 0 | 0.0% |
| 5 to 9 Unit Apartments | 0 | 0.0% |
| 10 or more Apartments | 0 | 0.0% |
| Mobile Home / Other | 51 | 15.8% |
| Total | 322 | 100.0% |
Housing Structures by Occupancy in North City
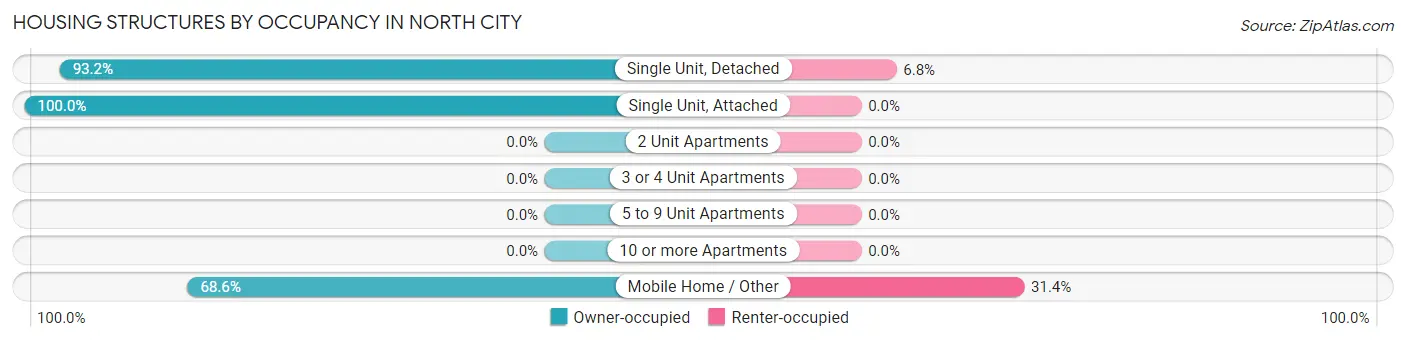
| Structure Type | Owner-occupied | Renter-occupied |
| Single Unit, Detached | 248 (93.2%) | 18 (6.8%) |
| Single Unit, Attached | 5 (100.0%) | 0 (0.0%) |
| 2 Unit Apartments | 0 (0.0%) | 0 (0.0%) |
| 3 or 4 Unit Apartments | 0 (0.0%) | 0 (0.0%) |
| 5 to 9 Unit Apartments | 0 (0.0%) | 0 (0.0%) |
| 10 or more Apartments | 0 (0.0%) | 0 (0.0%) |
| Mobile Home / Other | 35 (68.6%) | 16 (31.4%) |
| Total | 288 (89.4%) | 34 (10.6%) |
Housing Structures by Number of Rooms in North City
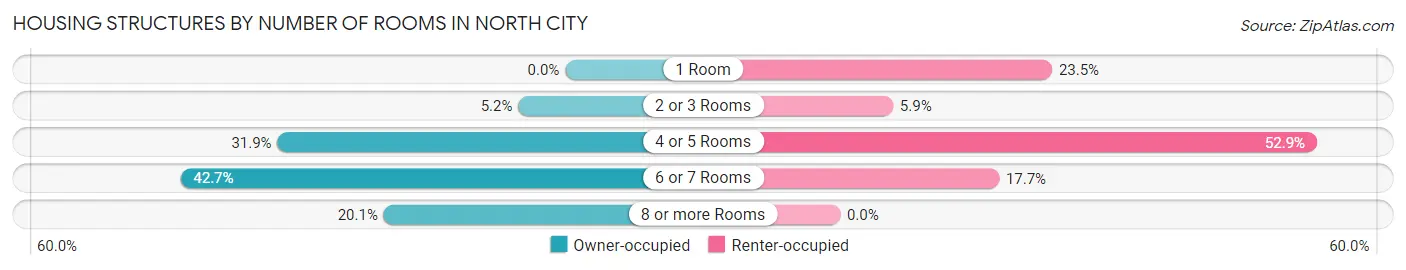
| Number of Rooms | Owner-occupied | Renter-occupied |
| 1 Room | 0 (0.0%) | 8 (23.5%) |
| 2 or 3 Rooms | 15 (5.2%) | 2 (5.9%) |
| 4 or 5 Rooms | 92 (31.9%) | 18 (52.9%) |
| 6 or 7 Rooms | 123 (42.7%) | 6 (17.6%) |
| 8 or more Rooms | 58 (20.1%) | 0 (0.0%) |
| Total | 288 (100.0%) | 34 (100.0%) |
Housing Structure by Heating Type in North City
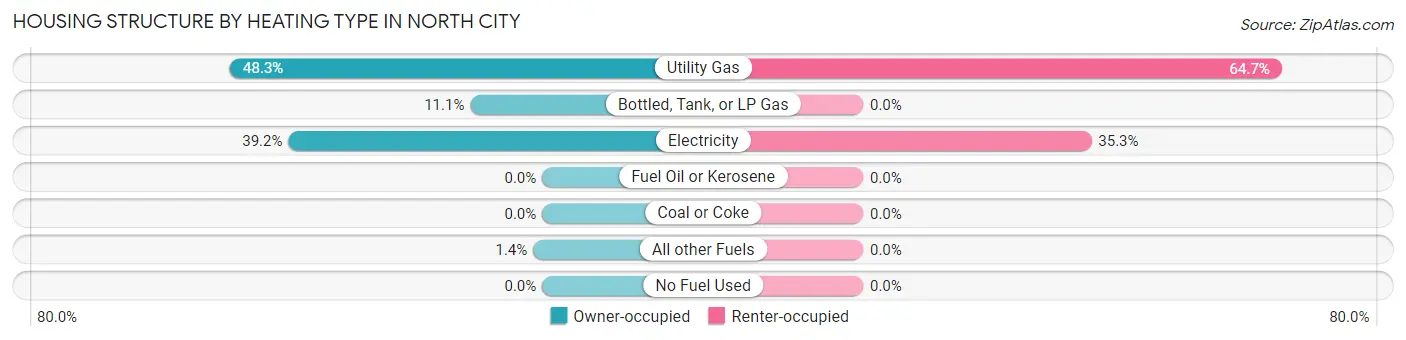
| Heating Type | Owner-occupied | Renter-occupied |
| Utility Gas | 139 (48.3%) | 22 (64.7%) |
| Bottled, Tank, or LP Gas | 32 (11.1%) | 0 (0.0%) |
| Electricity | 113 (39.2%) | 12 (35.3%) |
| Fuel Oil or Kerosene | 0 (0.0%) | 0 (0.0%) |
| Coal or Coke | 0 (0.0%) | 0 (0.0%) |
| All other Fuels | 4 (1.4%) | 0 (0.0%) |
| No Fuel Used | 0 (0.0%) | 0 (0.0%) |
| Total | 288 (100.0%) | 34 (100.0%) |
Household Vehicle Usage in North City
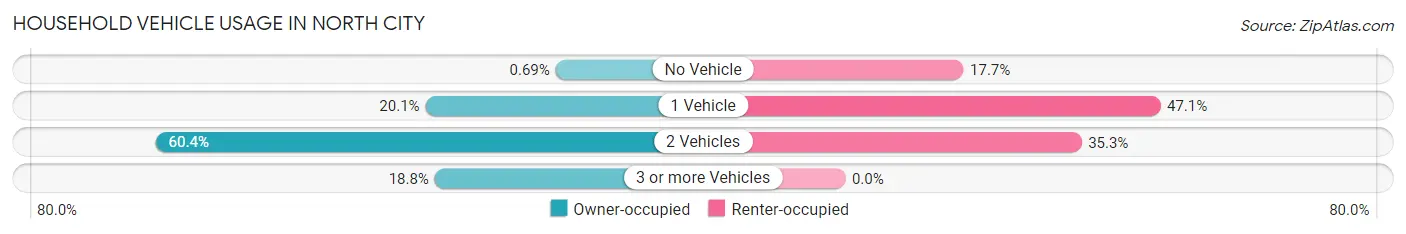
| Vehicles per Household | Owner-occupied | Renter-occupied |
| No Vehicle | 2 (0.7%) | 6 (17.6%) |
| 1 Vehicle | 58 (20.1%) | 16 (47.1%) |
| 2 Vehicles | 174 (60.4%) | 12 (35.3%) |
| 3 or more Vehicles | 54 (18.8%) | 0 (0.0%) |
| Total | 288 (100.0%) | 34 (100.0%) |
Real Estate & Mortgages in North City
Real Estate and Mortgage Overview in North City
| Characteristic | Without Mortgage | With Mortgage |
| Housing Units | 214 | 74 |
| Median Property Value | $111,900 | $93,800 |
| Median Household Income | $54,167 | $7 |
| Monthly Housing Costs | $544 | $3 |
| Real Estate Taxes | $1,357 | $5 |
Property Value by Mortgage Status in North City
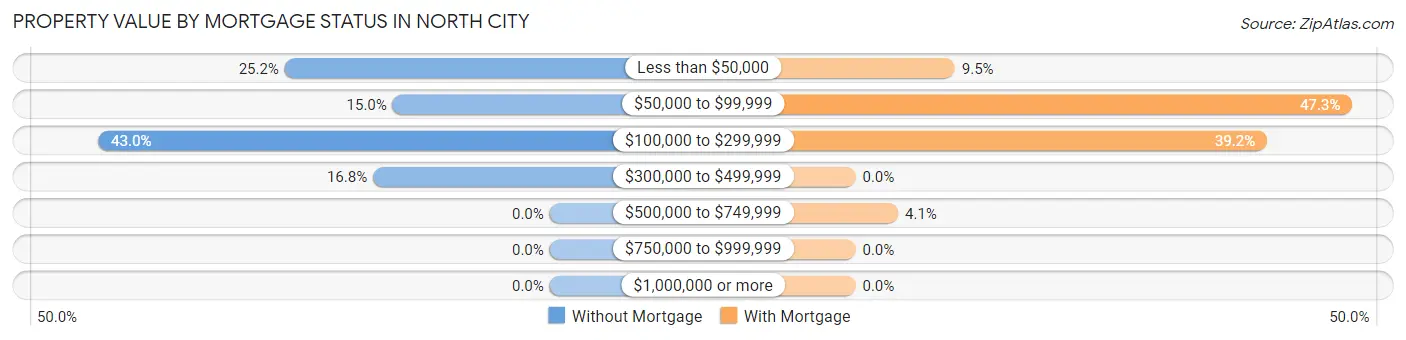
| Property Value | Without Mortgage | With Mortgage |
| Less than $50,000 | 54 (25.2%) | 7 (9.5%) |
| $50,000 to $99,999 | 32 (14.9%) | 35 (47.3%) |
| $100,000 to $299,999 | 92 (43.0%) | 29 (39.2%) |
| $300,000 to $499,999 | 36 (16.8%) | 0 (0.0%) |
| $500,000 to $749,999 | 0 (0.0%) | 3 (4.1%) |
| $750,000 to $999,999 | 0 (0.0%) | 0 (0.0%) |
| $1,000,000 or more | 0 (0.0%) | 0 (0.0%) |
| Total | 214 (100.0%) | 74 (100.0%) |
Household Income by Mortgage Status in North City
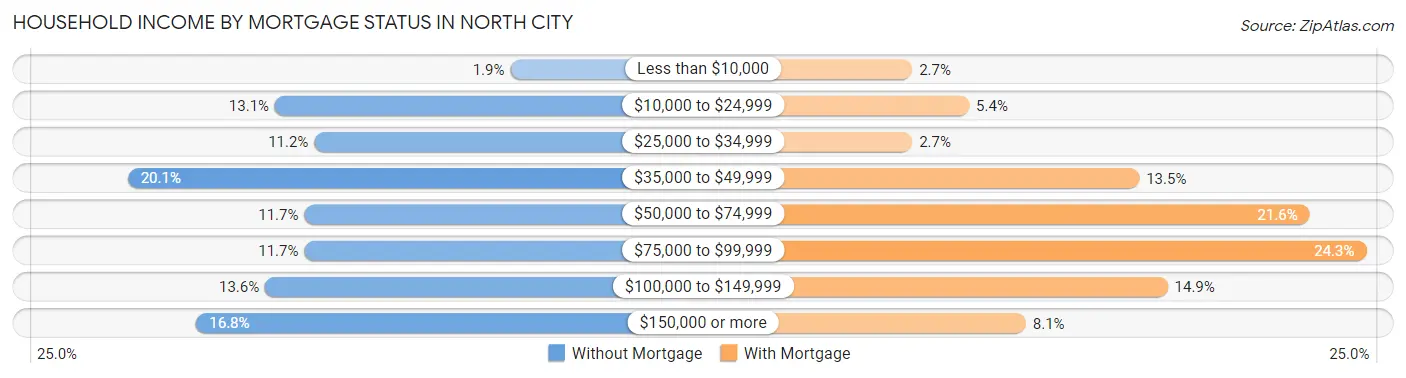
| Household Income | Without Mortgage | With Mortgage |
| Less than $10,000 | 4 (1.9%) | 2 (2.7%) |
| $10,000 to $24,999 | 28 (13.1%) | 4 (5.4%) |
| $25,000 to $34,999 | 24 (11.2%) | 2 (2.7%) |
| $35,000 to $49,999 | 43 (20.1%) | 10 (13.5%) |
| $50,000 to $74,999 | 25 (11.7%) | 16 (21.6%) |
| $75,000 to $99,999 | 25 (11.7%) | 18 (24.3%) |
| $100,000 to $149,999 | 29 (13.6%) | 11 (14.9%) |
| $150,000 or more | 36 (16.8%) | 6 (8.1%) |
| Total | 214 (100.0%) | 74 (100.0%) |
Property Value to Household Income Ratio in North City
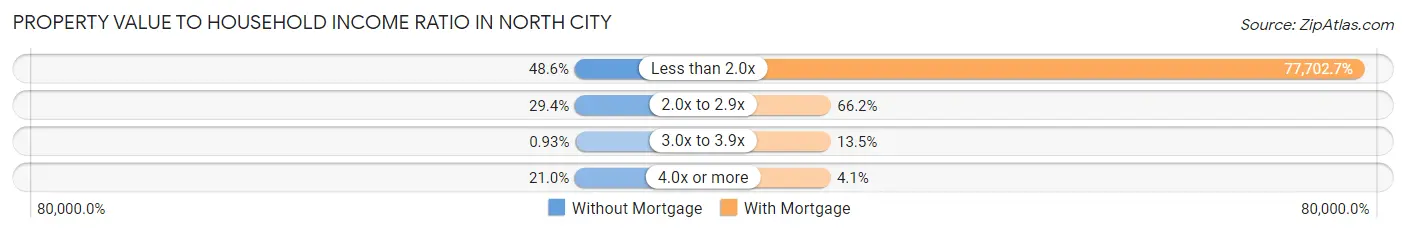
| Value-to-Income Ratio | Without Mortgage | With Mortgage |
| Less than 2.0x | 104 (48.6%) | 57,500 (77,702.7%) |
| 2.0x to 2.9x | 63 (29.4%) | 49 (66.2%) |
| 3.0x to 3.9x | 2 (0.9%) | 10 (13.5%) |
| 4.0x or more | 45 (21.0%) | 3 (4.1%) |
| Total | 214 (100.0%) | 74 (100.0%) |
Real Estate Taxes by Mortgage Status in North City
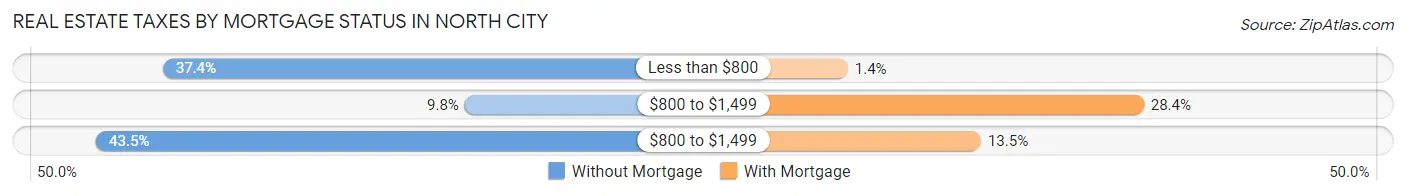
| Property Taxes | Without Mortgage | With Mortgage |
| Less than $800 | 80 (37.4%) | 1 (1.3%) |
| $800 to $1,499 | 21 (9.8%) | 21 (28.4%) |
| $800 to $1,499 | 93 (43.5%) | 10 (13.5%) |
| Total | 214 (100.0%) | 74 (100.0%) |
Health & Disability in North City
Health Insurance Coverage by Age in North City
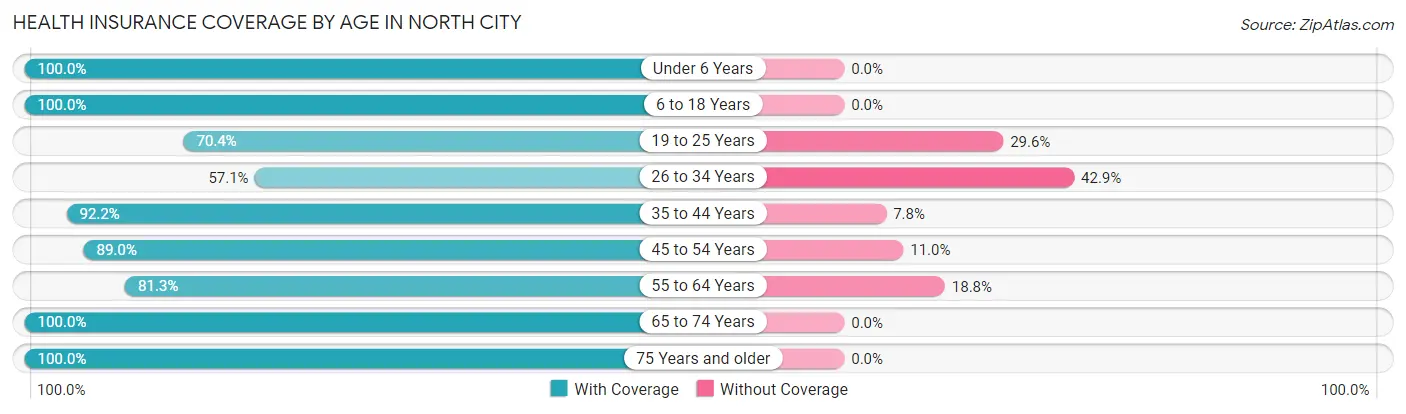
| Age Bracket | With Coverage | Without Coverage |
| Under 6 Years | 33 (100.0%) | 0 (0.0%) |
| 6 to 18 Years | 59 (100.0%) | 0 (0.0%) |
| 19 to 25 Years | 38 (70.4%) | 16 (29.6%) |
| 26 to 34 Years | 20 (57.1%) | 15 (42.9%) |
| 35 to 44 Years | 59 (92.2%) | 5 (7.8%) |
| 45 to 54 Years | 89 (89.0%) | 11 (11.0%) |
| 55 to 64 Years | 143 (81.2%) | 33 (18.8%) |
| 65 to 74 Years | 110 (100.0%) | 0 (0.0%) |
| 75 Years and older | 66 (100.0%) | 0 (0.0%) |
| Total | 617 (88.5%) | 80 (11.5%) |
Health Insurance Coverage by Citizenship Status in North City
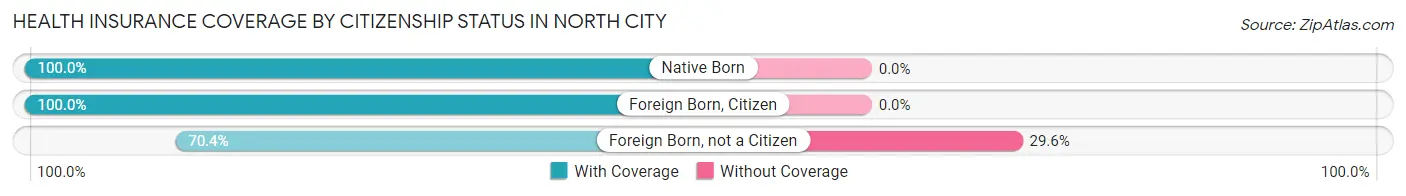
| Citizenship Status | With Coverage | Without Coverage |
| Native Born | 33 (100.0%) | 0 (0.0%) |
| Foreign Born, Citizen | 59 (100.0%) | 0 (0.0%) |
| Foreign Born, not a Citizen | 38 (70.4%) | 16 (29.6%) |
Health Insurance Coverage by Household Income in North City
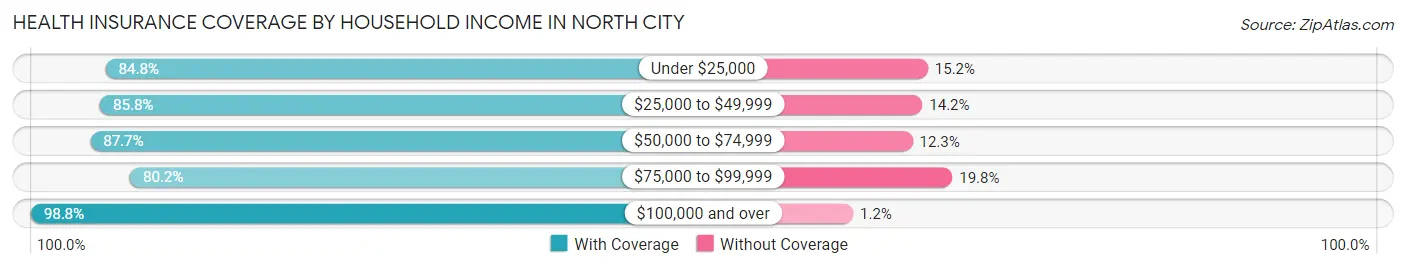
| Household Income | With Coverage | Without Coverage |
| Under $25,000 | 67 (84.8%) | 12 (15.2%) |
| $25,000 to $49,999 | 200 (85.8%) | 33 (14.2%) |
| $50,000 to $74,999 | 114 (87.7%) | 16 (12.3%) |
| $75,000 to $99,999 | 69 (80.2%) | 17 (19.8%) |
| $100,000 and over | 167 (98.8%) | 2 (1.2%) |
Public vs Private Health Insurance Coverage by Age in North City
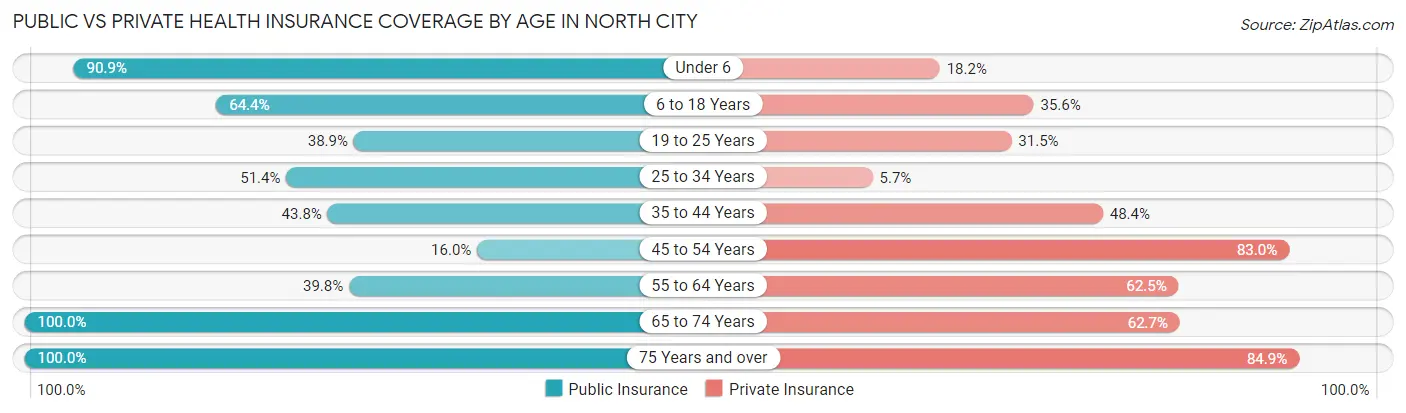
| Age Bracket | Public Insurance | Private Insurance |
| Under 6 | 30 (90.9%) | 6 (18.2%) |
| 6 to 18 Years | 38 (64.4%) | 21 (35.6%) |
| 19 to 25 Years | 21 (38.9%) | 17 (31.5%) |
| 25 to 34 Years | 18 (51.4%) | 2 (5.7%) |
| 35 to 44 Years | 28 (43.8%) | 31 (48.4%) |
| 45 to 54 Years | 16 (16.0%) | 83 (83.0%) |
| 55 to 64 Years | 70 (39.8%) | 110 (62.5%) |
| 65 to 74 Years | 110 (100.0%) | 69 (62.7%) |
| 75 Years and over | 66 (100.0%) | 56 (84.9%) |
| Total | 397 (57.0%) | 395 (56.7%) |
Disability Status by Sex by Age in North City
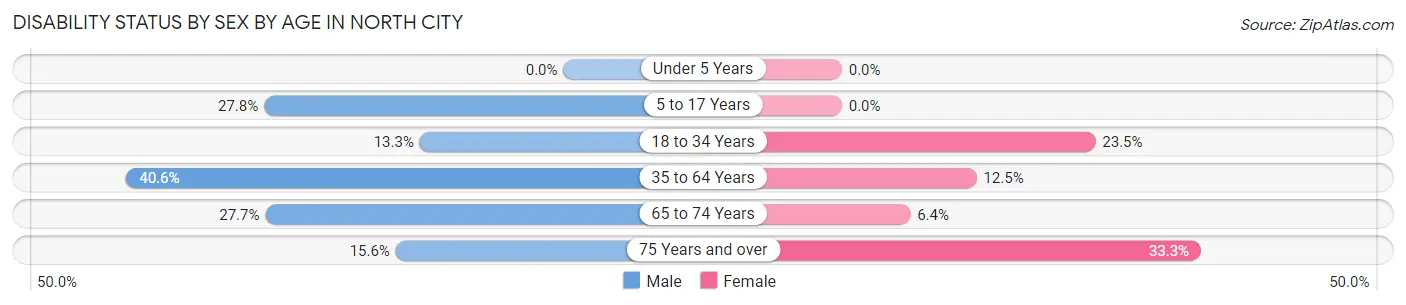
| Age Bracket | Male | Female |
| Under 5 Years | 0 (0.0%) | 0 (0.0%) |
| 5 to 17 Years | 10 (27.8%) | 0 (0.0%) |
| 18 to 34 Years | 10 (13.3%) | 4 (23.5%) |
| 35 to 64 Years | 73 (40.6%) | 20 (12.5%) |
| 65 to 74 Years | 13 (27.7%) | 4 (6.4%) |
| 75 Years and over | 7 (15.6%) | 7 (33.3%) |
Disability Class by Sex by Age in North City
Disability Class: Hearing Difficulty
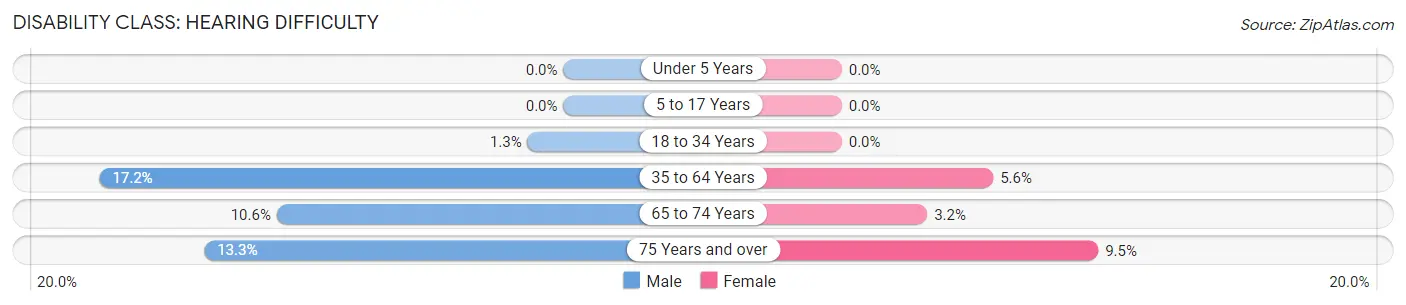
| Age Bracket | Male | Female |
| Under 5 Years | 0 (0.0%) | 0 (0.0%) |
| 5 to 17 Years | 0 (0.0%) | 0 (0.0%) |
| 18 to 34 Years | 1 (1.3%) | 0 (0.0%) |
| 35 to 64 Years | 31 (17.2%) | 9 (5.6%) |
| 65 to 74 Years | 5 (10.6%) | 2 (3.2%) |
| 75 Years and over | 6 (13.3%) | 2 (9.5%) |
Disability Class: Vision Difficulty
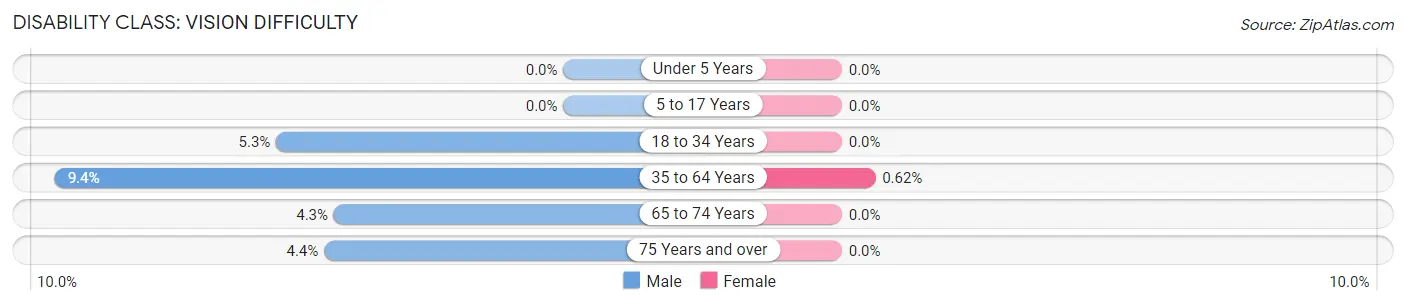
| Age Bracket | Male | Female |
| Under 5 Years | 0 (0.0%) | 0 (0.0%) |
| 5 to 17 Years | 0 (0.0%) | 0 (0.0%) |
| 18 to 34 Years | 4 (5.3%) | 0 (0.0%) |
| 35 to 64 Years | 17 (9.4%) | 1 (0.6%) |
| 65 to 74 Years | 2 (4.3%) | 0 (0.0%) |
| 75 Years and over | 2 (4.4%) | 0 (0.0%) |
Disability Class: Cognitive Difficulty
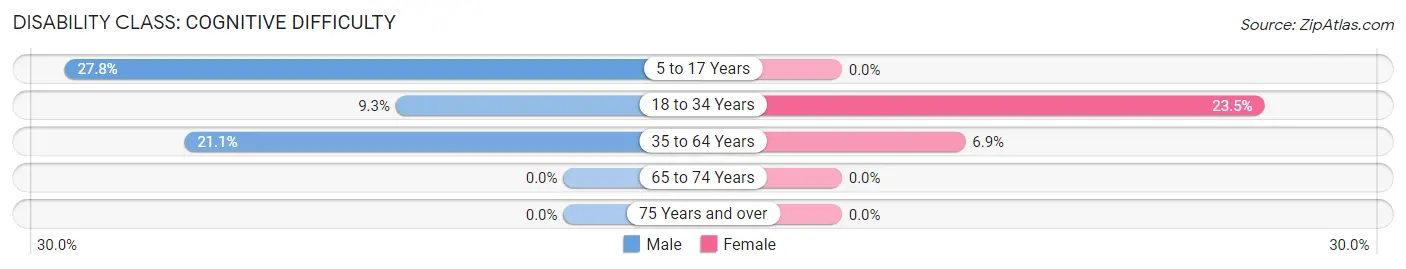
| Age Bracket | Male | Female |
| 5 to 17 Years | 10 (27.8%) | 0 (0.0%) |
| 18 to 34 Years | 7 (9.3%) | 4 (23.5%) |
| 35 to 64 Years | 38 (21.1%) | 11 (6.9%) |
| 65 to 74 Years | 0 (0.0%) | 0 (0.0%) |
| 75 Years and over | 0 (0.0%) | 0 (0.0%) |
Disability Class: Ambulatory Difficulty
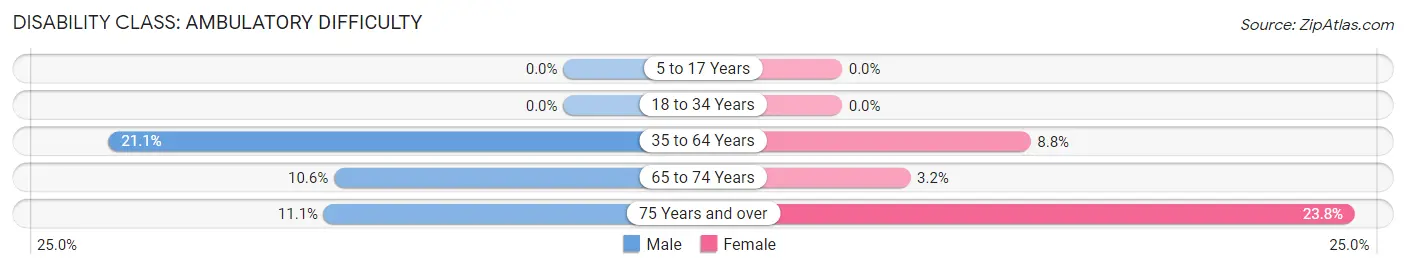
| Age Bracket | Male | Female |
| 5 to 17 Years | 0 (0.0%) | 0 (0.0%) |
| 18 to 34 Years | 0 (0.0%) | 0 (0.0%) |
| 35 to 64 Years | 38 (21.1%) | 14 (8.7%) |
| 65 to 74 Years | 5 (10.6%) | 2 (3.2%) |
| 75 Years and over | 5 (11.1%) | 5 (23.8%) |
Disability Class: Self-Care Difficulty
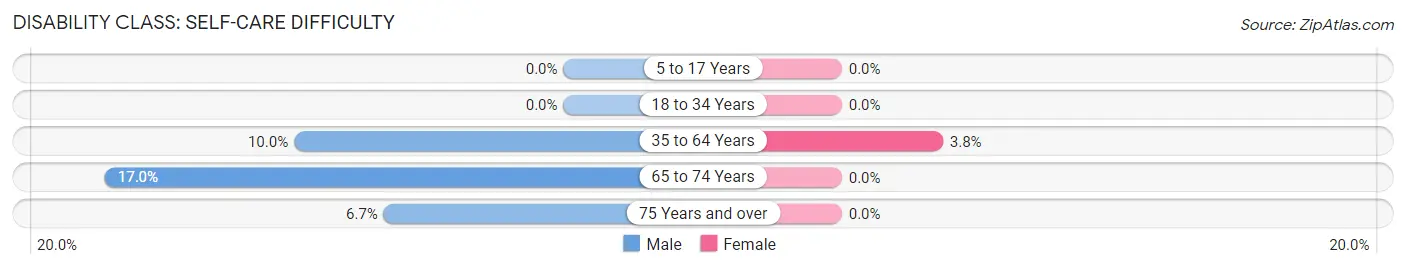
| Age Bracket | Male | Female |
| 5 to 17 Years | 0 (0.0%) | 0 (0.0%) |
| 18 to 34 Years | 0 (0.0%) | 0 (0.0%) |
| 35 to 64 Years | 18 (10.0%) | 6 (3.7%) |
| 65 to 74 Years | 8 (17.0%) | 0 (0.0%) |
| 75 Years and over | 3 (6.7%) | 0 (0.0%) |
Technology Access in North City
Computing Device Access in North City
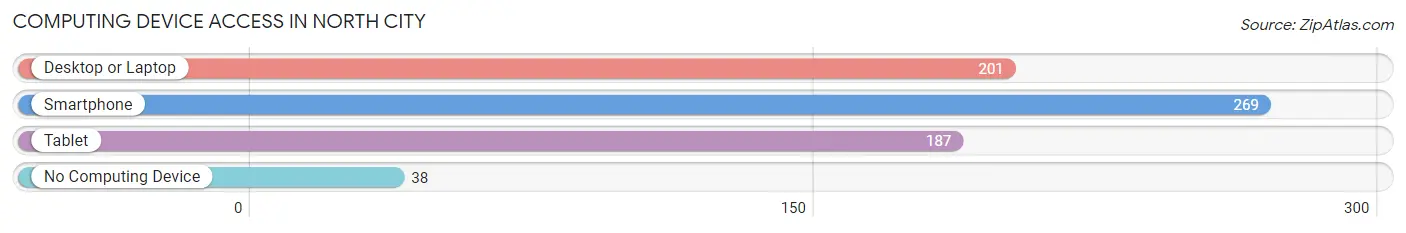
| Device Type | # Households | % Households |
| Desktop or Laptop | 201 | 62.4% |
| Smartphone | 269 | 83.5% |
| Tablet | 187 | 58.1% |
| No Computing Device | 38 | 11.8% |
| Total | 322 | 100.0% |
Internet Access in North City
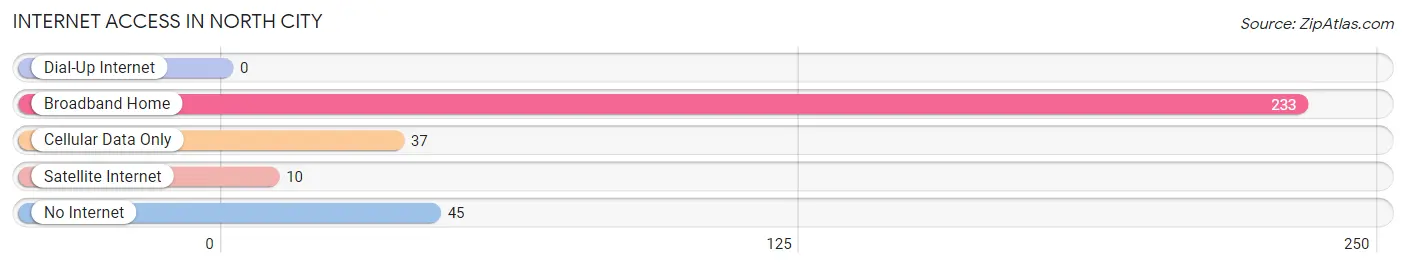
| Internet Type | # Households | % Households |
| Dial-Up Internet | 0 | 0.0% |
| Broadband Home | 233 | 72.4% |
| Cellular Data Only | 37 | 11.5% |
| Satellite Internet | 10 | 3.1% |
| No Internet | 45 | 14.0% |
| Total | 322 | 100.0% |
North City Summary
City of North City IL
North City, IL is a small city located in the northern part of the state of Illinois. It is situated in the northern part of Cook County, and is part of the Chicago metropolitan area. The city has a population of approximately 8,000 people, and is home to a diverse population of people from all walks of life.
History
North City, IL was founded in 1836 by a group of settlers from New England. The settlers were looking for a place to settle and start a new life, and they chose the area that is now North City. The city was originally called Northfield, but the name was changed to North City in 1845.
The city grew rapidly in the late 19th and early 20th centuries, and by the 1920s it had become a bustling industrial center. The city was home to several factories, including a steel mill, a paper mill, and a brickyard. The city also had a thriving business district, with several stores and restaurants.
In the 1950s, the city began to decline as the factories closed and the population began to move away. The city was hit hard by the Great Recession of 2008, and the population has continued to decline since then.
Geography
North City, IL is located in the northern part of Cook County, and is part of the Chicago metropolitan area. The city is situated on the banks of the Des Plaines River, and is bordered by the cities of Evanston, Skokie, and Wilmette. The city is located approximately 25 miles north of downtown Chicago.
The city has a total area of 2.3 square miles, and is mostly flat. The city is home to several parks, including North Park, which is located in the center of the city. The city also has several lakes, including Lake Michigan, which is located just to the east of the city.
Economy
North City, IL has a diverse economy, with a variety of industries represented. The city is home to several manufacturing companies, including a steel mill, a paper mill, and a brickyard. The city also has a thriving business district, with several stores and restaurants.
The city is also home to several educational institutions, including North City College, which is a two-year community college. The city is also home to several healthcare facilities, including North City Hospital.
Demographics
North City, IL has a population of approximately 8,000 people, and is home to a diverse population of people from all walks of life. The city has a median household income of $45,000, and the median age is 37. The city is majority white, with a population that is approximately 70% white. The city also has a large Hispanic population, with a population that is approximately 20% Hispanic. The city also has a small African American population, with a population that is approximately 5% African American.
Common Questions
What is the Total Population of North City?
Total Population of North City is 697.
What is the Total Male Population of North City?
Total Male Population of North City is 384.
What is the Total Female Population of North City?
Total Female Population of North City is 313.
What is the Ratio of Males per 100 Females in North City?
There are 122.68 Males per 100 Females in North City.
What is the Ratio of Females per 100 Males in North City?
There are 81.51 Females per 100 Males in North City.
What is the Median Population Age in North City?
Median Population Age in North City is 55.2 Years.
What is the Average Family Size in North City
Average Family Size in North City is 2.8 People.
What is the Average Household Size in North City
Average Household Size in North City is 2.2 People.
What is Per Capita Income in North City?
Per Capita income in North City is $33,444.
What is the Median Family Income in North City?
Median Family Income in North City is $58,611.
What is the Median Household income in North City?
Median Household Income in North City is $49,167.
What is Income or Wage Gap in North City?
Income or Wage Gap in North City is 15.9%.
Women in North City earn 84.1 cents for every dollar earned by a man.
What is Inequality or Gini Index in North City?
Inequality or Gini Index in North City is 0.41.
How Large is the Labor Force in North City?
There are 316 People in the Labor Forcein in North City.
What is the Percentage of People in the Labor Force in North City?
51.1% of People are in the Labor Force in North City.
What is the Unemployment Rate in North City?
Unemployment Rate in North City is 10.1%.