Granite City, IL
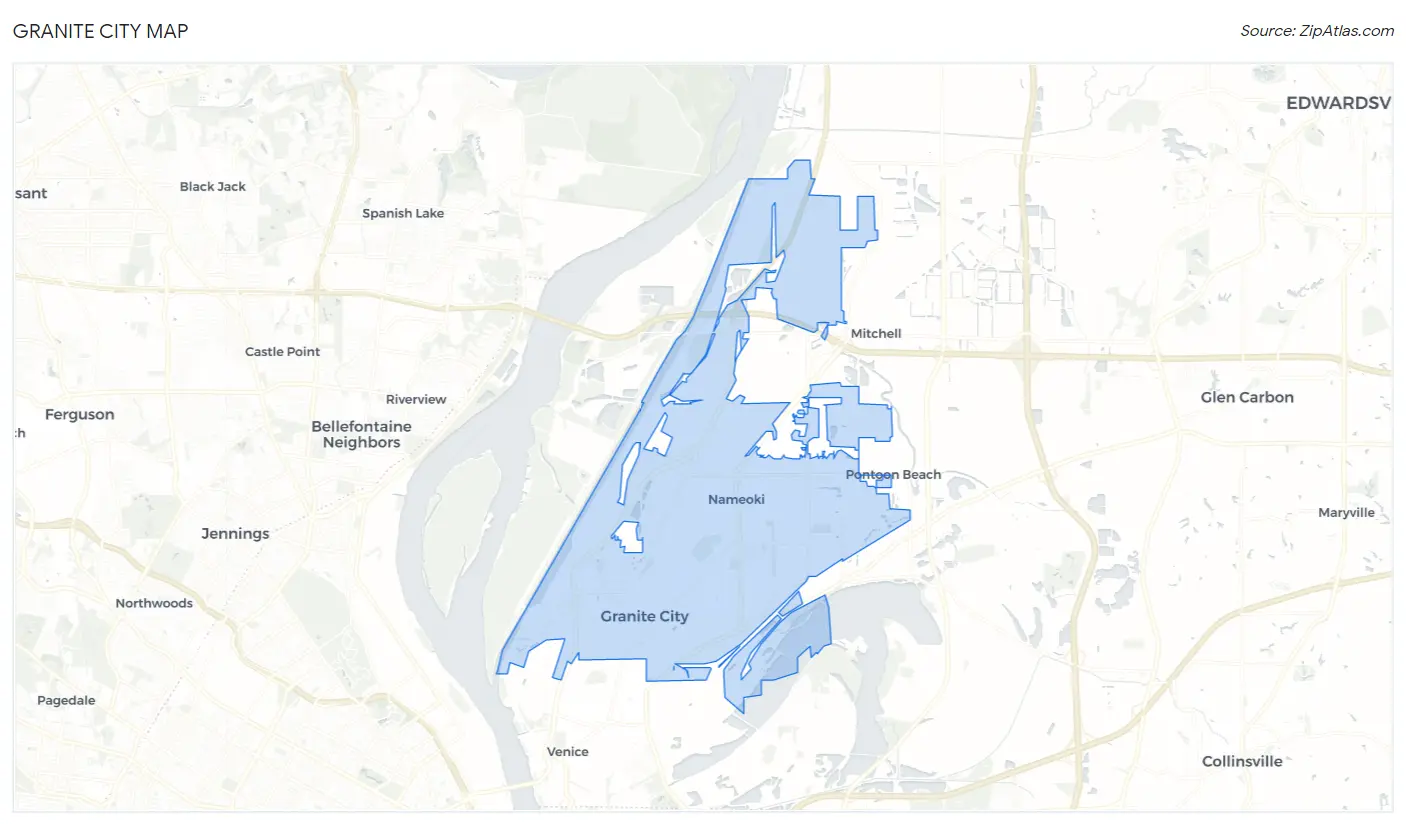
Granite City Map
Granite City Overview
27,026
TOTAL POPULATION
13,593
MALE POPULATION
13,433
FEMALE POPULATION
101.19
MALES / 100 FEMALES
98.82
FEMALES / 100 MALES
38.8
MEDIAN AGE
3.0
AVG FAMILY SIZE
2.4
AVG HOUSEHOLD SIZE
$29,239
PER CAPITA INCOME
$75,250
AVG FAMILY INCOME
$58,681
AVG HOUSEHOLD INCOME
23.9%
WAGE / INCOME GAP [ % ]
76.1¢/ $1
WAGE / INCOME GAP [ $ ]
$12,229
FAMILY INCOME DEFICIT
0.42
INEQUALITY / GINI INDEX
13,418
LABOR FORCE [ PEOPLE ]
61.0%
PERCENT IN LABOR FORCE
8.0%
UNEMPLOYMENT RATE
Granite City Zip Codes
Granite City Area Codes
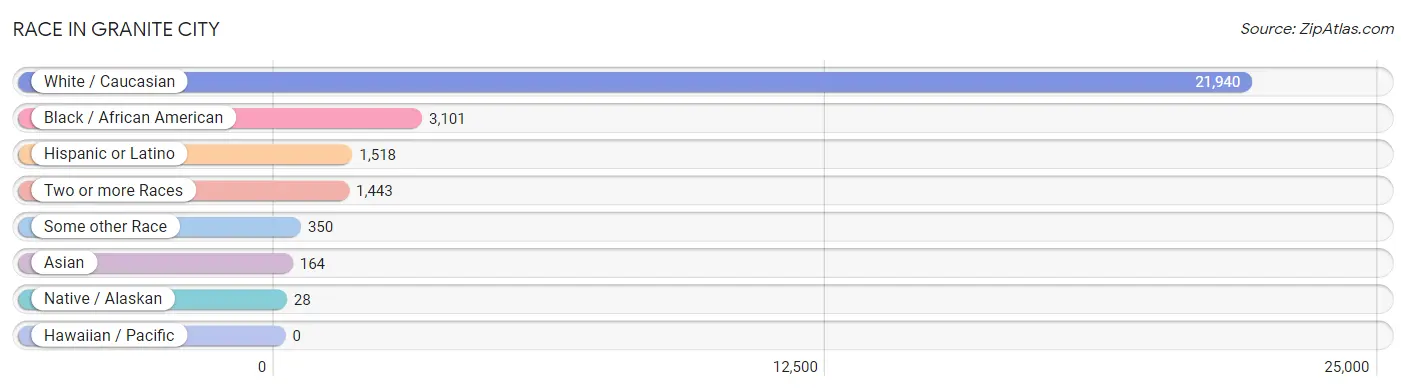
Race in Granite City
The most populous races in Granite City are White / Caucasian (21,940 | 81.2%), Black / African American (3,101 | 11.5%), and Hispanic or Latino (1,518 | 5.6%).
| Race | # Population | % Population |
| Asian | 164 | 0.6% |
| Black / African American | 3,101 | 11.5% |
| Hawaiian / Pacific | 0 | 0.0% |
| Hispanic or Latino | 1,518 | 5.6% |
| Native / Alaskan | 28 | 0.1% |
| White / Caucasian | 21,940 | 81.2% |
| Two or more Races | 1,443 | 5.3% |
| Some other Race | 350 | 1.3% |
| Total | 27,026 | 100.0% |
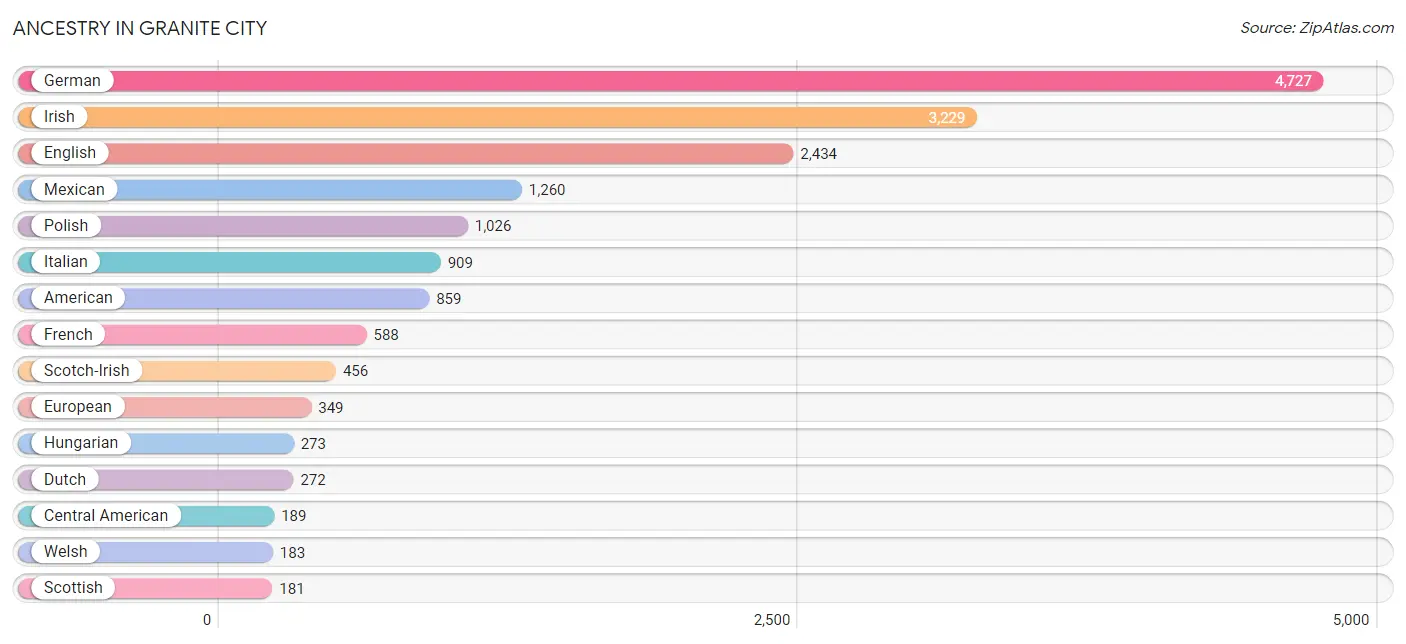
Ancestry in Granite City
The most populous ancestries reported in Granite City are German (4,727 | 17.5%), Irish (3,229 | 11.9%), English (2,434 | 9.0%), Mexican (1,260 | 4.7%), and Polish (1,026 | 3.8%), together accounting for 46.9% of all Granite City residents.
| Ancestry | # Population | % Population |
| African | 21 | 0.1% |
| American | 859 | 3.2% |
| Apache | 13 | 0.1% |
| Arab | 21 | 0.1% |
| Armenian | 77 | 0.3% |
| Austrian | 20 | 0.1% |
| Bhutanese | 3 | 0.0% |
| British | 66 | 0.2% |
| Bulgarian | 23 | 0.1% |
| Burmese | 26 | 0.1% |
| Canadian | 47 | 0.2% |
| Central American | 189 | 0.7% |
| Cherokee | 40 | 0.2% |
| Choctaw | 11 | 0.0% |
| Colombian | 5 | 0.0% |
| Comanche | 8 | 0.0% |
| Croatian | 123 | 0.5% |
| Czech | 35 | 0.1% |
| Czechoslovakian | 57 | 0.2% |
| Danish | 14 | 0.1% |
| Dutch | 272 | 1.0% |
| Dutch West Indian | 17 | 0.1% |
| Ecuadorian | 5 | 0.0% |
| English | 2,434 | 9.0% |
| European | 349 | 1.3% |
| Finnish | 11 | 0.0% |
| French | 588 | 2.2% |
| French Canadian | 74 | 0.3% |
| German | 4,727 | 17.5% |
| Greek | 28 | 0.1% |
| Guatemalan | 133 | 0.5% |
| Hungarian | 273 | 1.0% |
| Indian (Asian) | 29 | 0.1% |
| Irish | 3,229 | 11.9% |
| Italian | 909 | 3.4% |
| Kenyan | 14 | 0.1% |
| Korean | 146 | 0.5% |
| Lithuanian | 25 | 0.1% |
| Macedonian | 5 | 0.0% |
| Malaysian | 12 | 0.0% |
| Maltese | 6 | 0.0% |
| Mexican | 1,260 | 4.7% |
| Mexican American Indian | 14 | 0.1% |
| Nicaraguan | 44 | 0.2% |
| Northern European | 24 | 0.1% |
| Norwegian | 32 | 0.1% |
| Peruvian | 31 | 0.1% |
| Polish | 1,026 | 3.8% |
| Puerto Rican | 26 | 0.1% |
| Romanian | 6 | 0.0% |
| Russian | 83 | 0.3% |
| Salvadoran | 12 | 0.0% |
| Scandinavian | 13 | 0.1% |
| Scotch-Irish | 456 | 1.7% |
| Scottish | 181 | 0.7% |
| Serbian | 68 | 0.3% |
| Sioux | 3 | 0.0% |
| Slavic | 50 | 0.2% |
| Slovak | 74 | 0.3% |
| South American | 41 | 0.2% |
| South American Indian | 87 | 0.3% |
| Sri Lankan | 4 | 0.0% |
| Subsaharan African | 35 | 0.1% |
| Swiss | 19 | 0.1% |
| Thai | 49 | 0.2% |
| Welsh | 183 | 0.7% |
| Yaqui | 4 | 0.0% |
| Yugoslavian | 39 | 0.1% | View All 68 Rows |
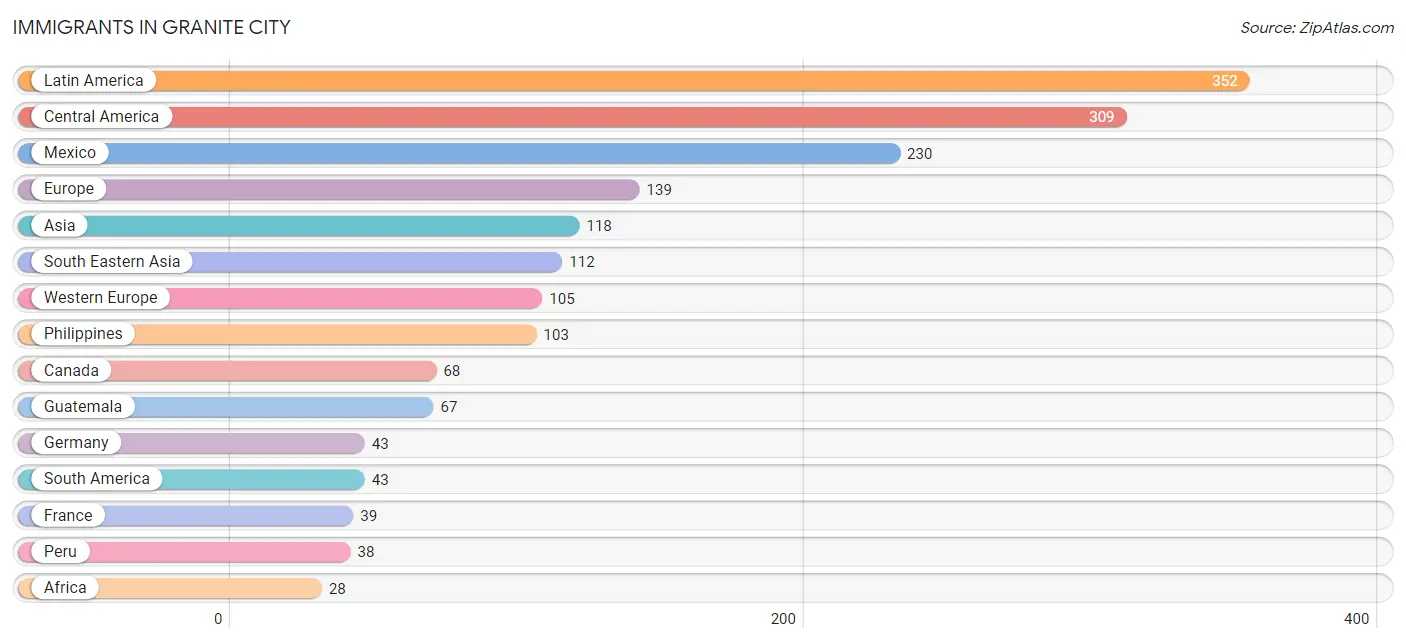
Immigrants in Granite City
The most numerous immigrant groups reported in Granite City came from Latin America (352 | 1.3%), Central America (309 | 1.1%), Mexico (230 | 0.9%), Europe (139 | 0.5%), and Asia (118 | 0.4%), together accounting for 4.2% of all Granite City residents.
| Immigration Origin | # Population | % Population |
| Africa | 28 | 0.1% |
| Asia | 118 | 0.4% |
| Canada | 68 | 0.3% |
| Central America | 309 | 1.1% |
| China | 6 | 0.0% |
| Colombia | 5 | 0.0% |
| Eastern Africa | 28 | 0.1% |
| Eastern Asia | 6 | 0.0% |
| El Salvador | 12 | 0.0% |
| Europe | 139 | 0.5% |
| France | 39 | 0.1% |
| Germany | 43 | 0.2% |
| Guatemala | 67 | 0.3% |
| Kenya | 7 | 0.0% |
| Latin America | 352 | 1.3% |
| Mexico | 230 | 0.9% |
| Netherlands | 23 | 0.1% |
| Northern Europe | 28 | 0.1% |
| Peru | 38 | 0.1% |
| Philippines | 103 | 0.4% |
| South America | 43 | 0.2% |
| South Eastern Asia | 112 | 0.4% |
| Southern Europe | 6 | 0.0% |
| Vietnam | 9 | 0.0% |
| Western Europe | 105 | 0.4% | View All 25 Rows |
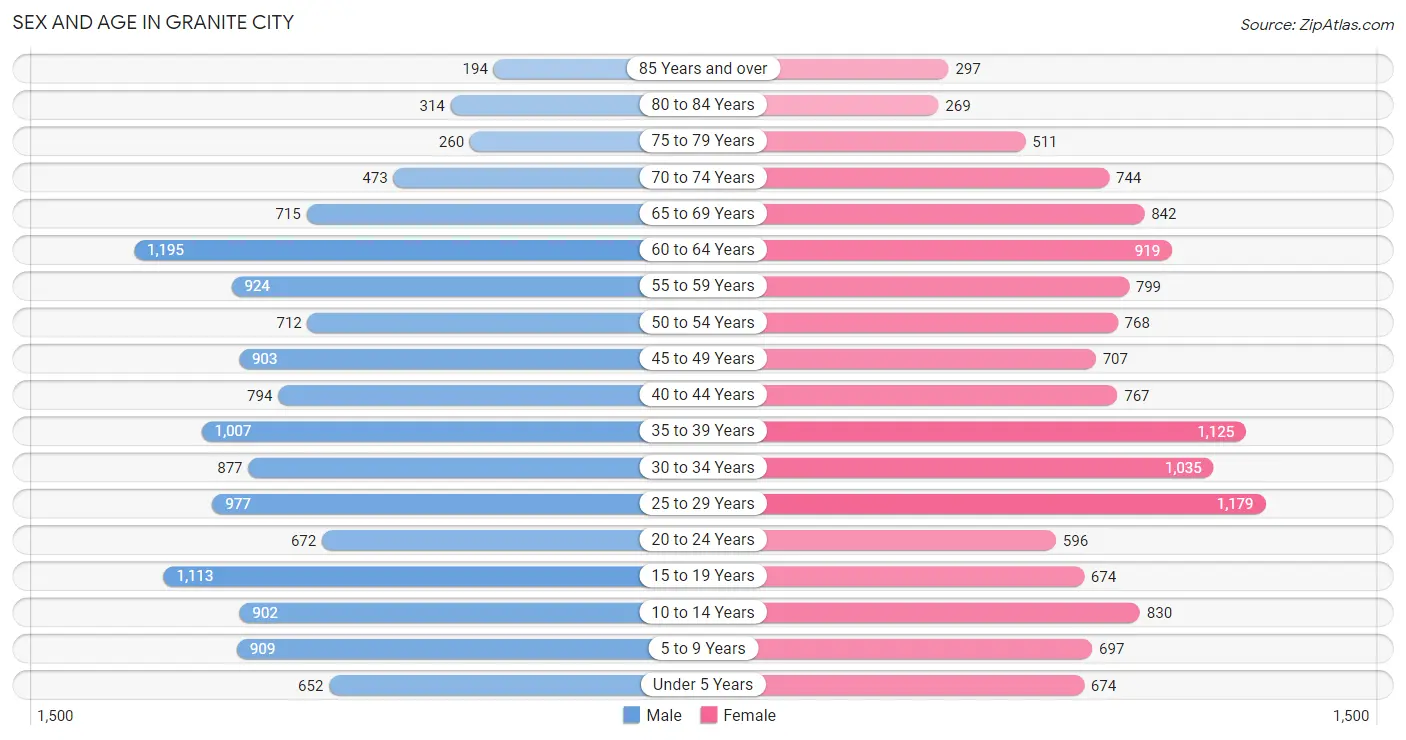
Sex and Age in Granite City
Sex and Age in Granite City
The most populous age groups in Granite City are 60 to 64 Years (1,195 | 8.8%) for men and 25 to 29 Years (1,179 | 8.8%) for women.
| Age Bracket | Male | Female |
| Under 5 Years | 652 (4.8%) | 674 (5.0%) |
| 5 to 9 Years | 909 (6.7%) | 697 (5.2%) |
| 10 to 14 Years | 902 (6.6%) | 830 (6.2%) |
| 15 to 19 Years | 1,113 (8.2%) | 674 (5.0%) |
| 20 to 24 Years | 672 (4.9%) | 596 (4.4%) |
| 25 to 29 Years | 977 (7.2%) | 1,179 (8.8%) |
| 30 to 34 Years | 877 (6.5%) | 1,035 (7.7%) |
| 35 to 39 Years | 1,007 (7.4%) | 1,125 (8.4%) |
| 40 to 44 Years | 794 (5.8%) | 767 (5.7%) |
| 45 to 49 Years | 903 (6.6%) | 707 (5.3%) |
| 50 to 54 Years | 712 (5.2%) | 768 (5.7%) |
| 55 to 59 Years | 924 (6.8%) | 799 (5.9%) |
| 60 to 64 Years | 1,195 (8.8%) | 919 (6.8%) |
| 65 to 69 Years | 715 (5.3%) | 842 (6.3%) |
| 70 to 74 Years | 473 (3.5%) | 744 (5.5%) |
| 75 to 79 Years | 260 (1.9%) | 511 (3.8%) |
| 80 to 84 Years | 314 (2.3%) | 269 (2.0%) |
| 85 Years and over | 194 (1.4%) | 297 (2.2%) |
| Total | 13,593 (100.0%) | 13,433 (100.0%) |
Families and Households in Granite City
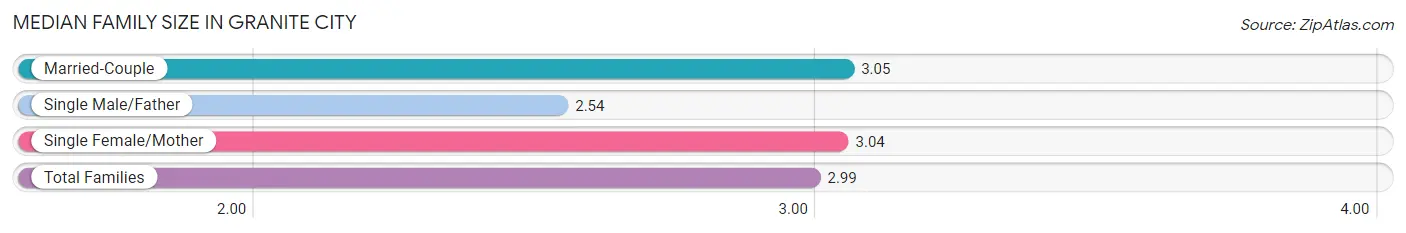
Median Family Size in Granite City
The median family size in Granite City is 2.99 persons per family, with married-couple families (4,192 | 60.7%) accounting for the largest median family size of 3.05 persons per family. On the other hand, single male/father families (741 | 10.7%) represent the smallest median family size with 2.54 persons per family.
| Family Type | # Families | Family Size |
| Married-Couple | 4,192 (60.7%) | 3.05 |
| Single Male/Father | 741 (10.7%) | 2.54 |
| Single Female/Mother | 1,976 (28.6%) | 3.04 |
| Total Families | 6,909 (100.0%) | 2.99 |
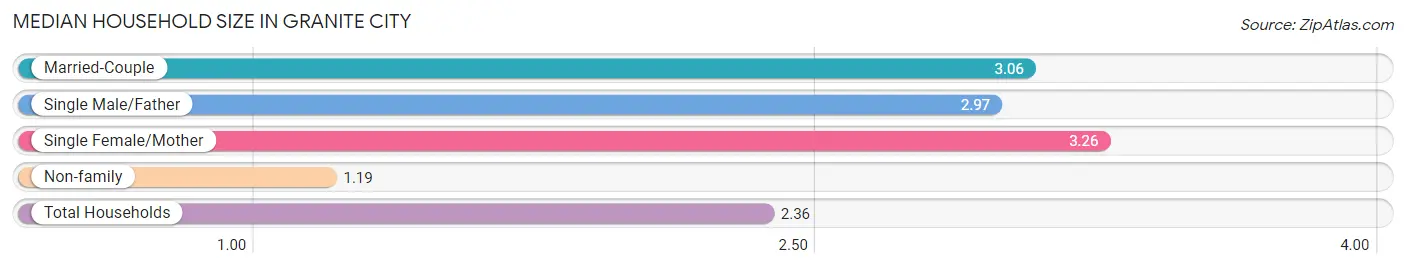
Median Household Size in Granite City
The median household size in Granite City is 2.36 persons per household, with single female/mother households (1,976 | 17.5%) accounting for the largest median household size of 3.26 persons per household. non-family households (4,395 | 38.9%) represent the smallest median household size with 1.19 persons per household.
| Household Type | # Households | Household Size |
| Married-Couple | 4,192 (37.1%) | 3.06 |
| Single Male/Father | 741 (6.6%) | 2.97 |
| Single Female/Mother | 1,976 (17.5%) | 3.26 |
| Non-family | 4,395 (38.9%) | 1.19 |
| Total Households | 11,304 (100.0%) | 2.36 |
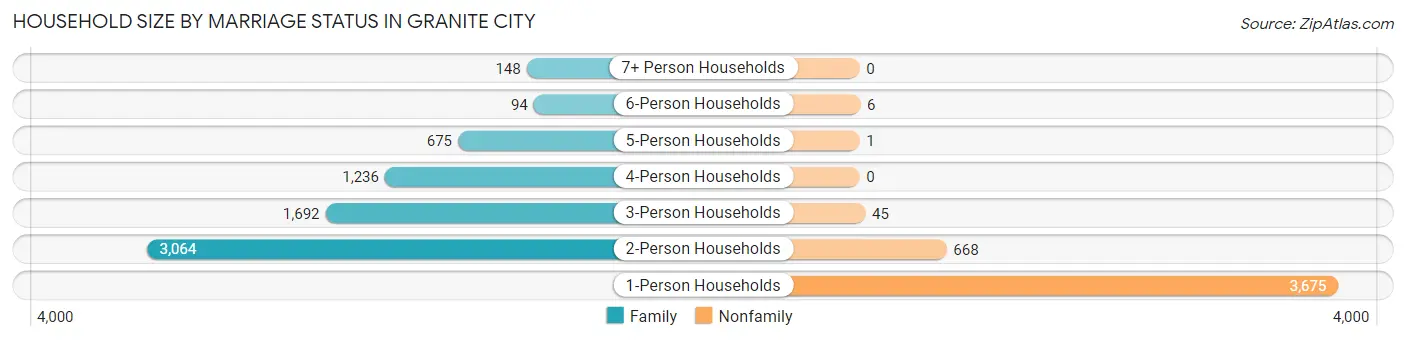
Household Size by Marriage Status in Granite City
Out of a total of 11,304 households in Granite City, 6,909 (61.1%) are family households, while 4,395 (38.9%) are nonfamily households. The most numerous type of family households are 2-person households, comprising 3,064, and the most common type of nonfamily households are 1-person households, comprising 3,675.
| Household Size | Family Households | Nonfamily Households |
| 1-Person Households | - | 3,675 (32.5%) |
| 2-Person Households | 3,064 (27.1%) | 668 (5.9%) |
| 3-Person Households | 1,692 (15.0%) | 45 (0.4%) |
| 4-Person Households | 1,236 (10.9%) | 0 (0.0%) |
| 5-Person Households | 675 (6.0%) | 1 (0.0%) |
| 6-Person Households | 94 (0.8%) | 6 (0.1%) |
| 7+ Person Households | 148 (1.3%) | 0 (0.0%) |
| Total | 6,909 (61.1%) | 4,395 (38.9%) |
Female Fertility in Granite City
Fertility by Age in Granite City
Average fertility rate in Granite City is 59.0 births per 1,000 women. Women in the age bracket of 20 to 34 years have the highest fertility rate with 100.0 births per 1,000 women. Women in the age bracket of 20 to 34 years acount for 77.0% of all women with births.
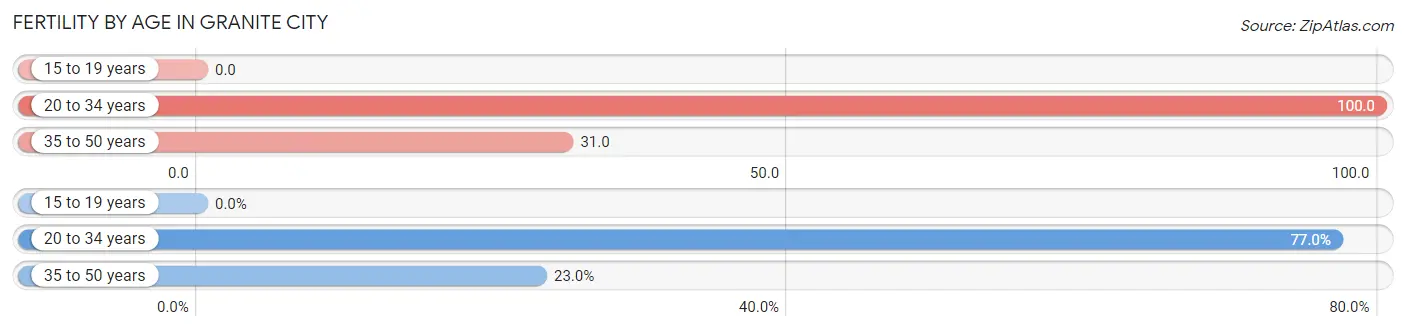
| Age Bracket | Women with Births | Births / 1,000 Women |
| 15 to 19 years | 0 (0.0%) | 0.0 |
| 20 to 34 years | 281 (77.0%) | 100.0 |
| 35 to 50 years | 84 (23.0%) | 31.0 |
| Total | 365 (100.0%) | 59.0 |
Fertility by Age by Marriage Status in Granite City
39.2% of women with births (365) in Granite City are married. The highest percentage of unmarried women with births falls into 35 to 50 years age bracket with 64.3% of them unmarried at the time of birth, while the lowest percentage of unmarried women with births belong to 20 to 34 years age bracket with 59.8% of them unmarried.
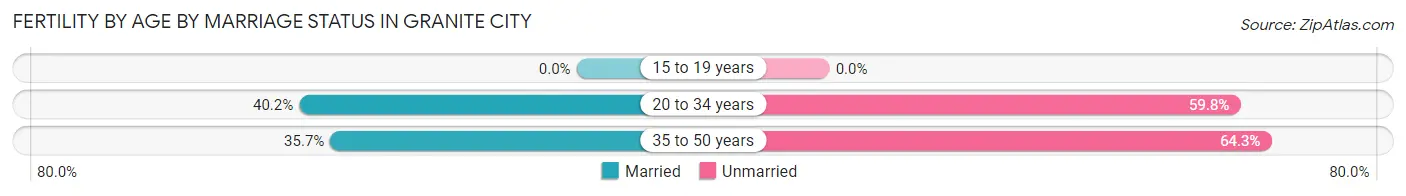
| Age Bracket | Married | Unmarried |
| 15 to 19 years | 0 (0.0%) | 0 (0.0%) |
| 20 to 34 years | 113 (40.2%) | 168 (59.8%) |
| 35 to 50 years | 30 (35.7%) | 54 (64.3%) |
| Total | 143 (39.2%) | 222 (60.8%) |
Fertility by Education in Granite City
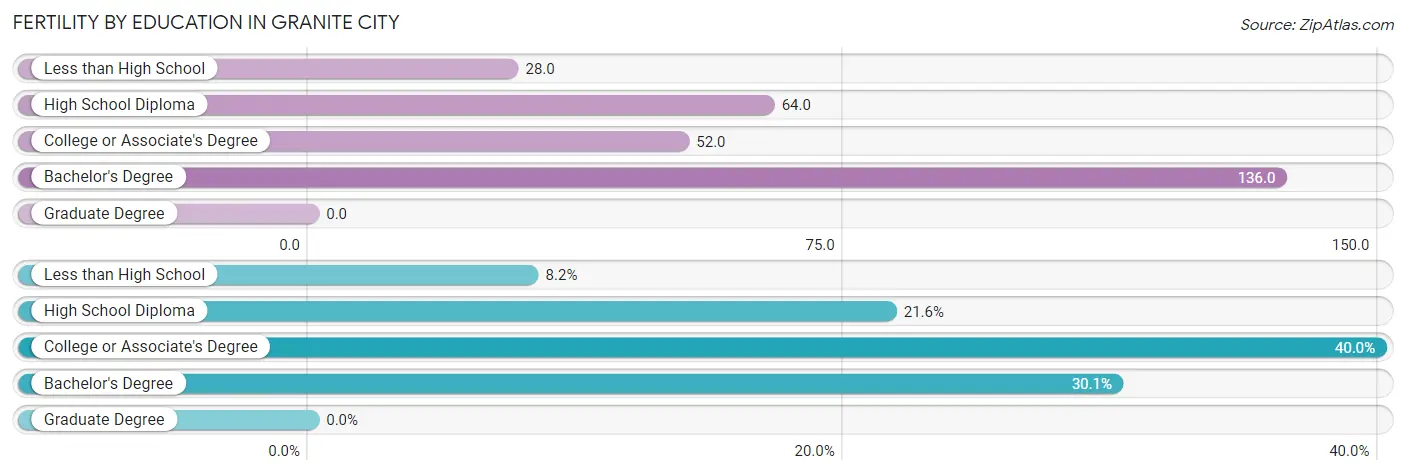
| Educational Attainment | Women with Births | Births / 1,000 Women |
| Less than High School | 30 (8.2%) | 28.0 |
| High School Diploma | 79 (21.6%) | 64.0 |
| College or Associate's Degree | 146 (40.0%) | 52.0 |
| Bachelor's Degree | 110 (30.1%) | 136.0 |
| Graduate Degree | 0 (0.0%) | 0.0 |
| Total | 365 (100.0%) | 59.0 |
Fertility by Education by Marriage Status in Granite City
60.8% of women with births in Granite City are unmarried. Women with the educational attainment of bachelor's degree are most likely to be married with 79.1% of them married at childbirth, while women with the educational attainment of less than high school are least likely to be married with 100.0% of them unmarried at childbirth.
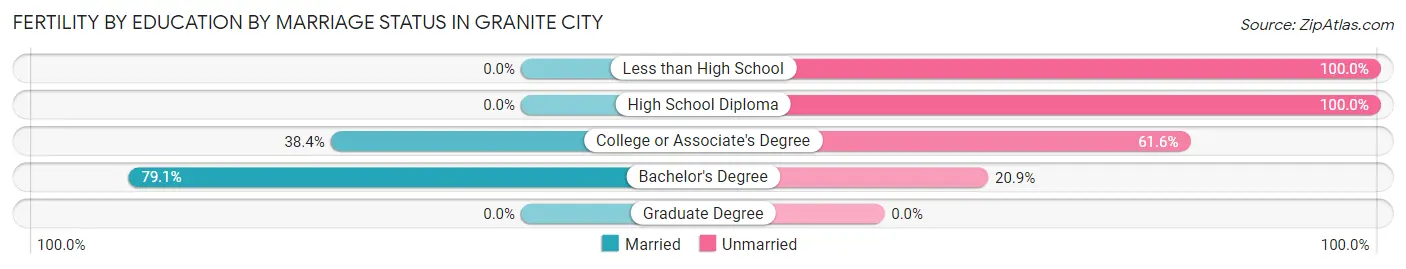
| Educational Attainment | Married | Unmarried |
| Less than High School | 0 (0.0%) | 30 (100.0%) |
| High School Diploma | 0 (0.0%) | 79 (100.0%) |
| College or Associate's Degree | 56 (38.4%) | 90 (61.6%) |
| Bachelor's Degree | 87 (79.1%) | 23 (20.9%) |
| Graduate Degree | 0 (0.0%) | 0 (0.0%) |
| Total | 143 (39.2%) | 222 (60.8%) |
Income in Granite City
Income Overview in Granite City
Per Capita Income in Granite City is $29,239, while median incomes of families and households are $75,250 and $58,681 respectively.
| Characteristic | Number | Measure |
| Per Capita Income | 27,026 | $29,239 |
| Median Family Income | 6,909 | $75,250 |
| Mean Family Income | 6,909 | $81,643 |
| Median Household Income | 11,304 | $58,681 |
| Mean Household Income | 11,304 | $68,755 |
| Income Deficit | 6,909 | $12,229 |
| Wage / Income Gap (%) | 27,026 | 23.90% |
| Wage / Income Gap ($) | 27,026 | 76.10¢ per $1 |
| Gini / Inequality Index | 27,026 | 0.42 |
Earnings by Sex in Granite City
Average Earnings in Granite City are $36,941, $41,310 for men and $31,437 for women, a difference of 23.9%.
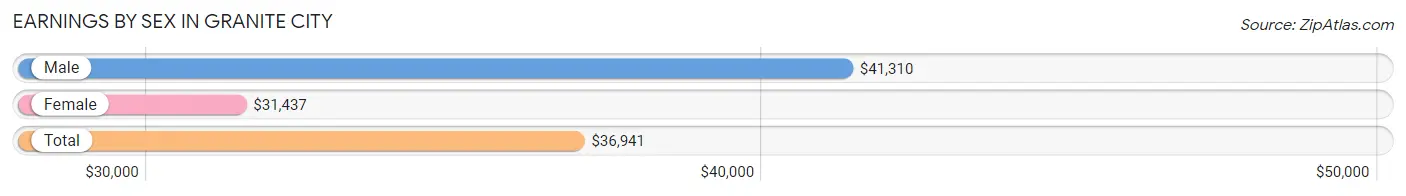
| Sex | Number | Average Earnings |
| Male | 7,243 (52.4%) | $41,310 |
| Female | 6,567 (47.5%) | $31,437 |
| Total | 13,810 (100.0%) | $36,941 |
Earnings by Sex by Income Bracket in Granite City
The most common earnings brackets in Granite City are $75,000 to $99,999 for men (957 | 13.2%) and $40,000 to $44,999 for women (597 | 9.1%).
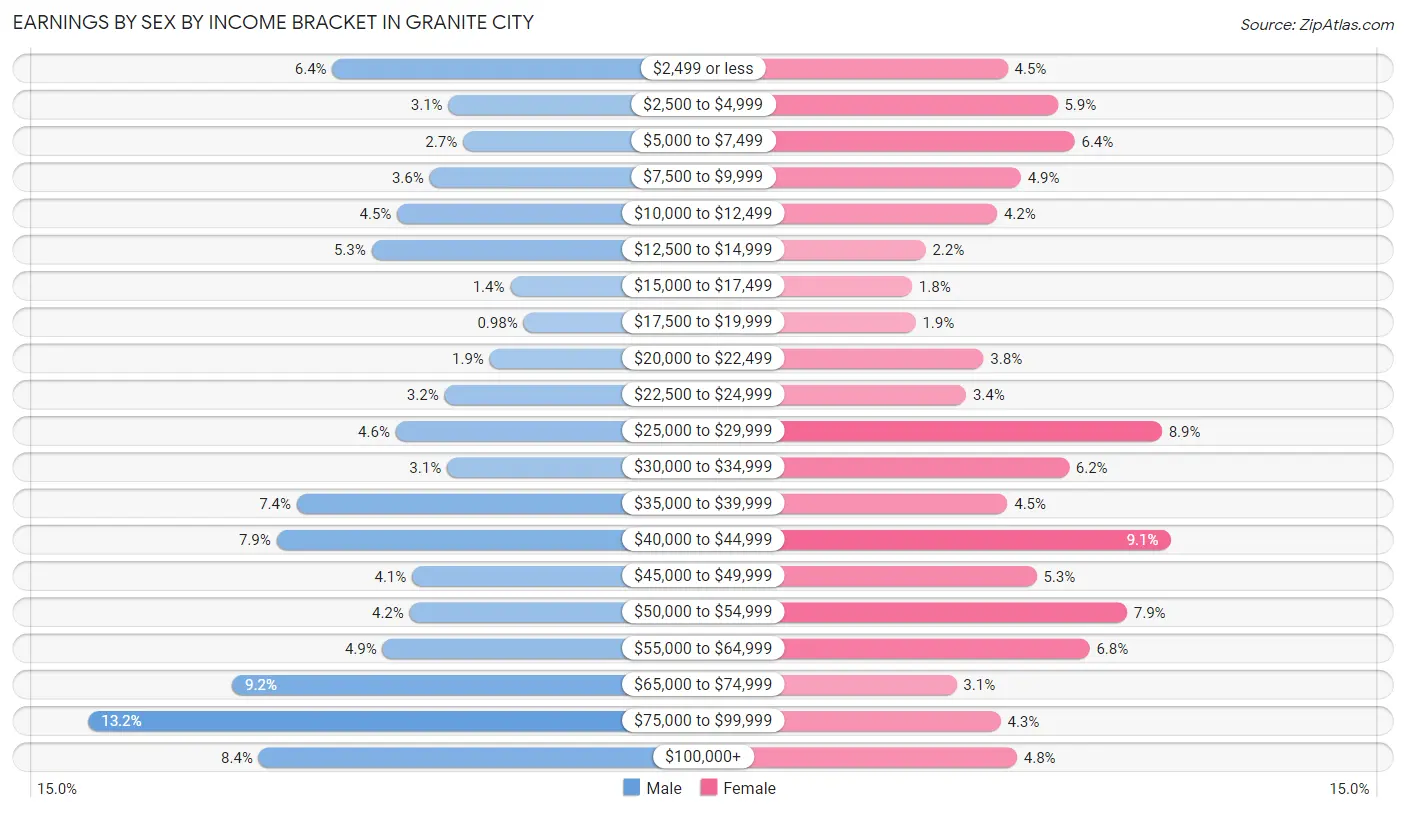
| Income | Male | Female |
| $2,499 or less | 460 (6.4%) | 297 (4.5%) |
| $2,500 to $4,999 | 224 (3.1%) | 389 (5.9%) |
| $5,000 to $7,499 | 194 (2.7%) | 420 (6.4%) |
| $7,500 to $9,999 | 262 (3.6%) | 321 (4.9%) |
| $10,000 to $12,499 | 328 (4.5%) | 277 (4.2%) |
| $12,500 to $14,999 | 380 (5.2%) | 145 (2.2%) |
| $15,000 to $17,499 | 98 (1.3%) | 120 (1.8%) |
| $17,500 to $19,999 | 71 (1.0%) | 127 (1.9%) |
| $20,000 to $22,499 | 140 (1.9%) | 252 (3.8%) |
| $22,500 to $24,999 | 232 (3.2%) | 220 (3.4%) |
| $25,000 to $29,999 | 331 (4.6%) | 581 (8.8%) |
| $30,000 to $34,999 | 227 (3.1%) | 410 (6.2%) |
| $35,000 to $39,999 | 532 (7.3%) | 296 (4.5%) |
| $40,000 to $44,999 | 574 (7.9%) | 597 (9.1%) |
| $45,000 to $49,999 | 298 (4.1%) | 350 (5.3%) |
| $50,000 to $54,999 | 303 (4.2%) | 517 (7.9%) |
| $55,000 to $64,999 | 358 (4.9%) | 448 (6.8%) |
| $65,000 to $74,999 | 664 (9.2%) | 202 (3.1%) |
| $75,000 to $99,999 | 957 (13.2%) | 284 (4.3%) |
| $100,000+ | 610 (8.4%) | 314 (4.8%) |
| Total | 7,243 (100.0%) | 6,567 (100.0%) |
Earnings by Sex by Educational Attainment in Granite City
Average earnings in Granite City are $45,559 for men and $35,182 for women, a difference of 22.8%. Men with an educational attainment of college or associate's degree enjoy the highest average annual earnings of $59,088, while those with less than high school education earn the least with $17,276. Women with an educational attainment of graduate degree earn the most with the average annual earnings of $86,042, while those with high school diploma education have the smallest earnings of $30,536.
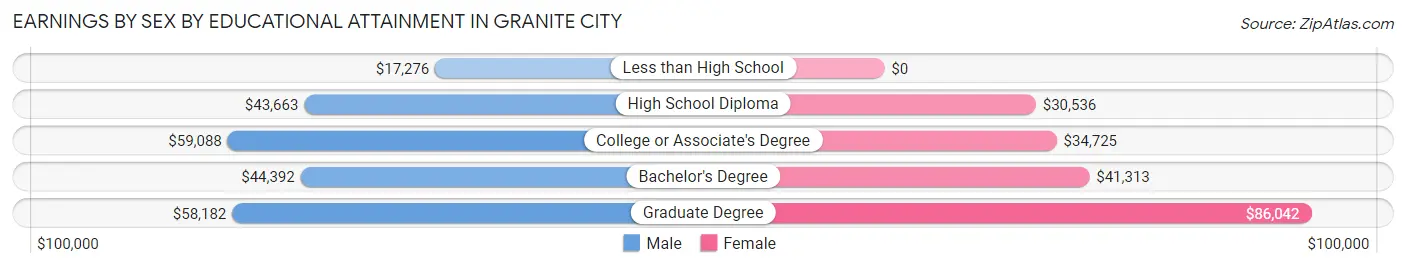
| Educational Attainment | Male Income | Female Income |
| Less than High School | $17,276 | $0 |
| High School Diploma | $43,663 | $30,536 |
| College or Associate's Degree | $59,088 | $34,725 |
| Bachelor's Degree | $44,392 | $41,313 |
| Graduate Degree | $58,182 | $86,042 |
| Total | $45,559 | $35,182 |
Family Income in Granite City
Family Income Brackets in Granite City
According to the Granite City family income data, there are 1,548 families falling into the $100,000 to $149,999 income range, which is the most common income bracket and makes up 22.4% of all families. Conversely, the $10,000 to $14,999 income bracket is the least frequent group with only 180 families (2.6%) belonging to this category.
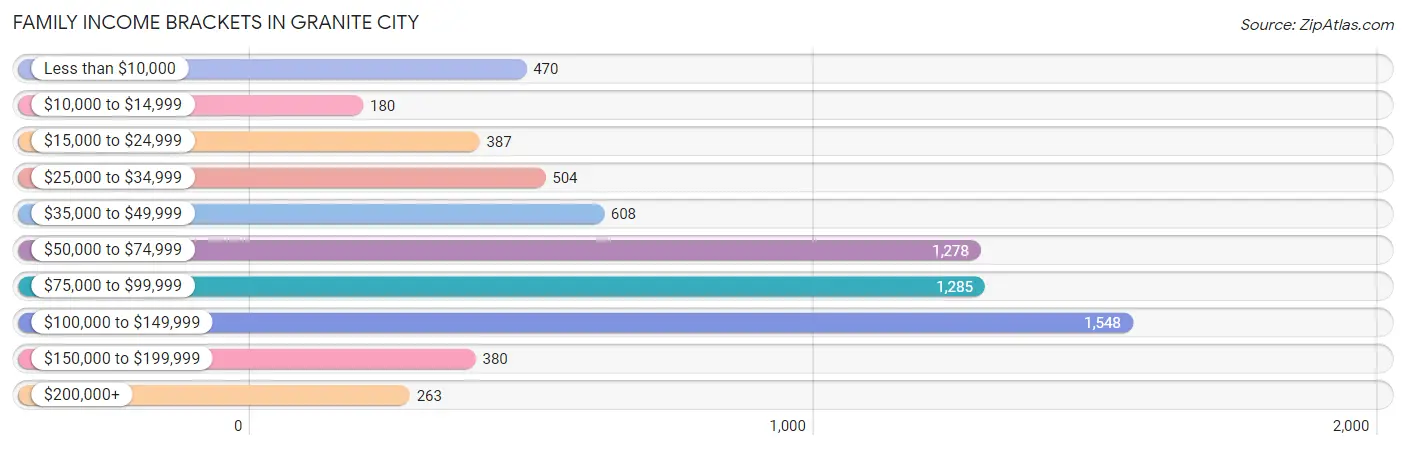
| Income Bracket | # Families | % Families |
| Less than $10,000 | 470 | 6.8% |
| $10,000 to $14,999 | 180 | 2.6% |
| $15,000 to $24,999 | 387 | 5.6% |
| $25,000 to $34,999 | 504 | 7.3% |
| $35,000 to $49,999 | 608 | 8.8% |
| $50,000 to $74,999 | 1,278 | 18.5% |
| $75,000 to $99,999 | 1,285 | 18.6% |
| $100,000 to $149,999 | 1,548 | 22.4% |
| $150,000 to $199,999 | 380 | 5.5% |
| $200,000+ | 263 | 3.8% |
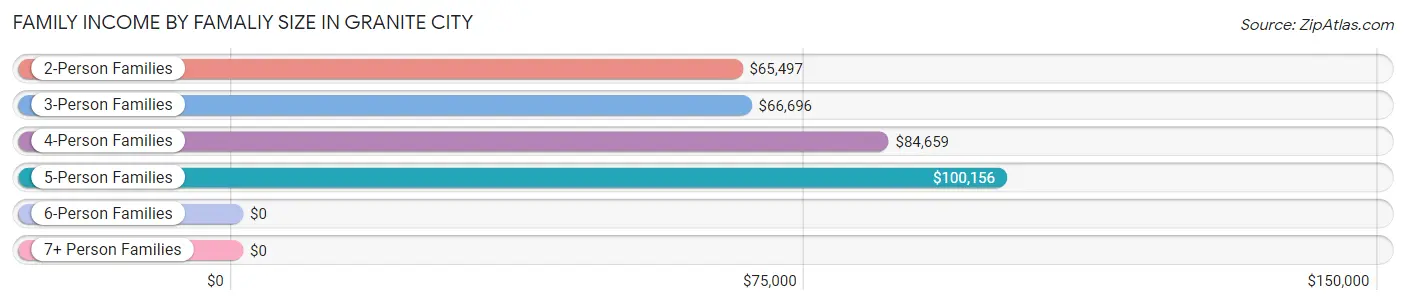
Family Income by Famaliy Size in Granite City
5-person families (634 | 9.2%) account for the highest median family income in Granite City with $100,156 per family, while 2-person families (3,473 | 50.3%) have the highest median income of $32,748 per family member.
| Income Bracket | # Families | Median Income |
| 2-Person Families | 3,473 (50.3%) | $65,497 |
| 3-Person Families | 1,441 (20.9%) | $66,696 |
| 4-Person Families | 1,208 (17.5%) | $84,659 |
| 5-Person Families | 634 (9.2%) | $100,156 |
| 6-Person Families | 47 (0.7%) | $0 |
| 7+ Person Families | 106 (1.5%) | $0 |
| Total | 6,909 (100.0%) | $75,250 |
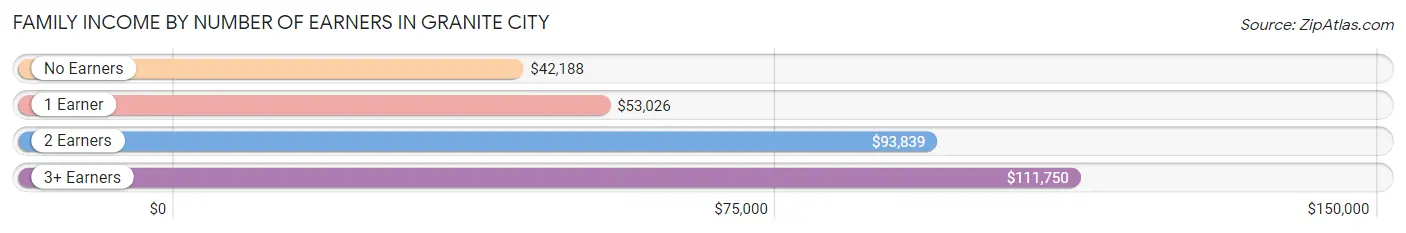
Family Income by Number of Earners in Granite City
The median family income in Granite City is $75,250, with families comprising 3+ earners (842) having the highest median family income of $111,750, while families with no earners (1,133) have the lowest median family income of $42,188, accounting for 12.2% and 16.4% of families, respectively.
| Number of Earners | # Families | Median Income |
| No Earners | 1,133 (16.4%) | $42,188 |
| 1 Earner | 2,577 (37.3%) | $53,026 |
| 2 Earners | 2,357 (34.1%) | $93,839 |
| 3+ Earners | 842 (12.2%) | $111,750 |
| Total | 6,909 (100.0%) | $75,250 |
Household Income in Granite City
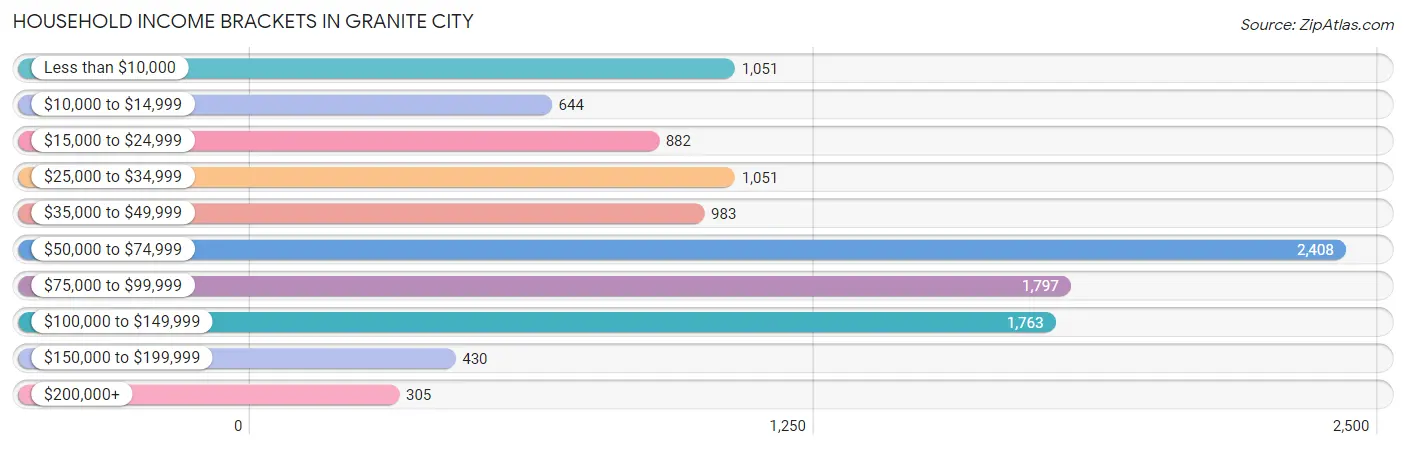
Household Income Brackets in Granite City
With 2,408 households falling in the category, the $50,000 to $74,999 income range is the most frequent in Granite City, accounting for 21.3% of all households. In contrast, only 305 households (2.7%) fall into the $200,000+ income bracket, making it the least populous group.
| Income Bracket | # Households | % Households |
| Less than $10,000 | 1,051 | 9.3% |
| $10,000 to $14,999 | 644 | 5.7% |
| $15,000 to $24,999 | 882 | 7.8% |
| $25,000 to $34,999 | 1,051 | 9.3% |
| $35,000 to $49,999 | 983 | 8.7% |
| $50,000 to $74,999 | 2,408 | 21.3% |
| $75,000 to $99,999 | 1,797 | 15.9% |
| $100,000 to $149,999 | 1,763 | 15.6% |
| $150,000 to $199,999 | 430 | 3.8% |
| $200,000+ | 305 | 2.7% |
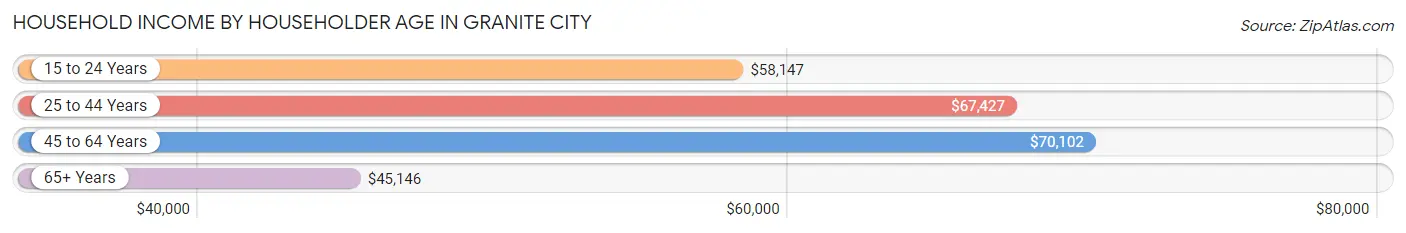
Household Income by Householder Age in Granite City
The median household income in Granite City is $58,681, with the highest median household income of $70,102 found in the 45 to 64 years age bracket for the primary householder. A total of 4,095 households (36.2%) fall into this category. Meanwhile, the 65+ years age bracket for the primary householder has the lowest median household income of $45,146, with 3,255 households (28.8%) in this group.
| Income Bracket | # Households | Median Income |
| 15 to 24 Years | 291 (2.6%) | $58,147 |
| 25 to 44 Years | 3,663 (32.4%) | $67,427 |
| 45 to 64 Years | 4,095 (36.2%) | $70,102 |
| 65+ Years | 3,255 (28.8%) | $45,146 |
| Total | 11,304 (100.0%) | $58,681 |
Poverty in Granite City
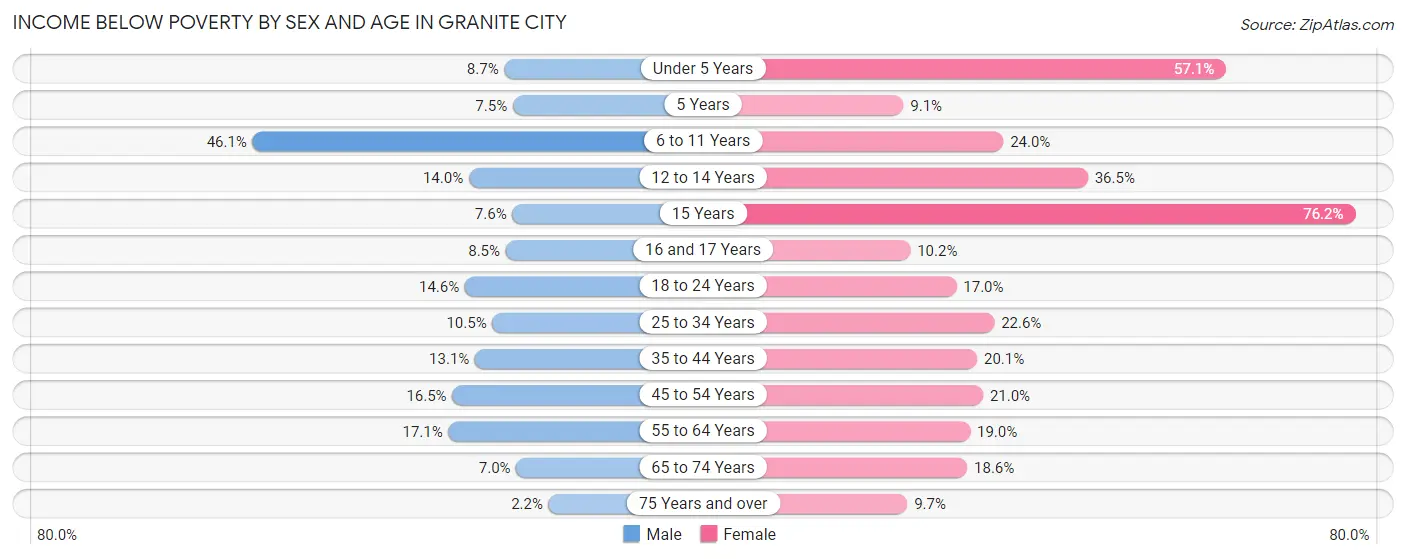
Income Below Poverty by Sex and Age in Granite City
With 15.0% poverty level for males and 22.2% for females among the residents of Granite City, 6 to 11 year old males and 15 year old females are the most vulnerable to poverty, with 519 males (46.1%) and 77 females (76.2%) in their respective age groups living below the poverty level.
| Age Bracket | Male | Female |
| Under 5 Years | 57 (8.7%) | 380 (57.1%) |
| 5 Years | 11 (7.5%) | 18 (9.1%) |
| 6 to 11 Years | 519 (46.1%) | 180 (24.0%) |
| 12 to 14 Years | 65 (14.0%) | 206 (36.5%) |
| 15 Years | 20 (7.5%) | 77 (76.2%) |
| 16 and 17 Years | 38 (8.5%) | 31 (10.2%) |
| 18 to 24 Years | 157 (14.6%) | 147 (17.0%) |
| 25 to 34 Years | 195 (10.5%) | 501 (22.6%) |
| 35 to 44 Years | 236 (13.1%) | 380 (20.1%) |
| 45 to 54 Years | 266 (16.5%) | 309 (21.0%) |
| 55 to 64 Years | 360 (17.1%) | 324 (19.0%) |
| 65 to 74 Years | 82 (7.0%) | 289 (18.6%) |
| 75 Years and over | 16 (2.2%) | 90 (9.7%) |
| Total | 2,022 (15.0%) | 2,932 (22.2%) |
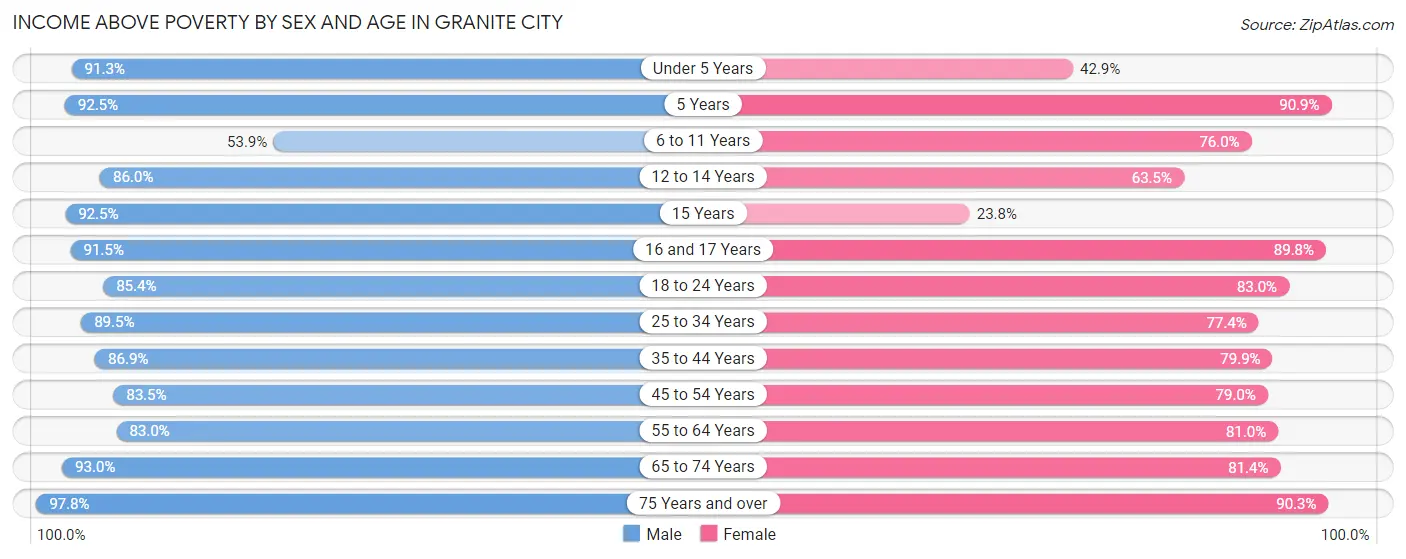
Income Above Poverty by Sex and Age in Granite City
According to the poverty statistics in Granite City, males aged 75 years and over and females aged 5 years are the age groups that are most secure financially, with 97.8% of males and 90.9% of females in these age groups living above the poverty line.
| Age Bracket | Male | Female |
| Under 5 Years | 595 (91.3%) | 286 (42.9%) |
| 5 Years | 136 (92.5%) | 179 (90.9%) |
| 6 to 11 Years | 606 (53.9%) | 571 (76.0%) |
| 12 to 14 Years | 399 (86.0%) | 358 (63.5%) |
| 15 Years | 245 (92.4%) | 24 (23.8%) |
| 16 and 17 Years | 407 (91.5%) | 274 (89.8%) |
| 18 to 24 Years | 918 (85.4%) | 717 (83.0%) |
| 25 to 34 Years | 1,659 (89.5%) | 1,713 (77.4%) |
| 35 to 44 Years | 1,565 (86.9%) | 1,512 (79.9%) |
| 45 to 54 Years | 1,349 (83.5%) | 1,165 (79.0%) |
| 55 to 64 Years | 1,752 (83.0%) | 1,378 (81.0%) |
| 65 to 74 Years | 1,094 (93.0%) | 1,264 (81.4%) |
| 75 Years and over | 726 (97.8%) | 837 (90.3%) |
| Total | 11,451 (85.0%) | 10,278 (77.8%) |
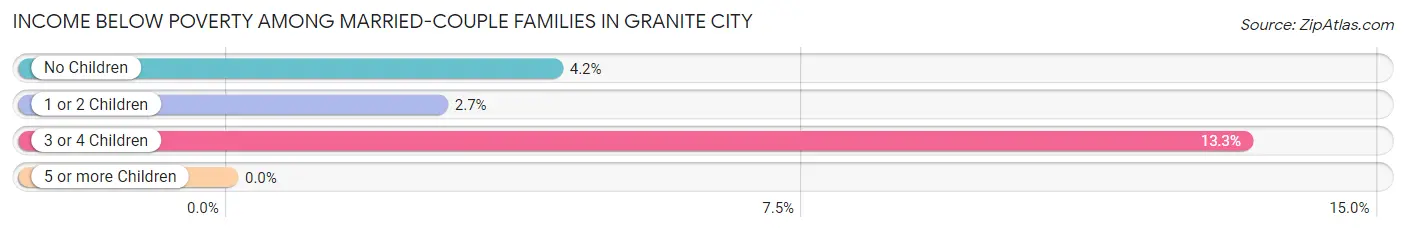
Income Below Poverty Among Married-Couple Families in Granite City
The poverty statistics for married-couple families in Granite City show that 4.3% or 182 of the total 4,192 families live below the poverty line. Families with 3 or 4 children have the highest poverty rate of 13.3%, comprising of 33 families. On the other hand, families with 1 or 2 children have the lowest poverty rate of 2.7%, which includes 33 families.
| Children | Above Poverty | Below Poverty |
| No Children | 2,621 (95.8%) | 116 (4.2%) |
| 1 or 2 Children | 1,173 (97.3%) | 33 (2.7%) |
| 3 or 4 Children | 216 (86.8%) | 33 (13.3%) |
| 5 or more Children | 0 (0.0%) | 0 (0.0%) |
| Total | 4,010 (95.7%) | 182 (4.3%) |
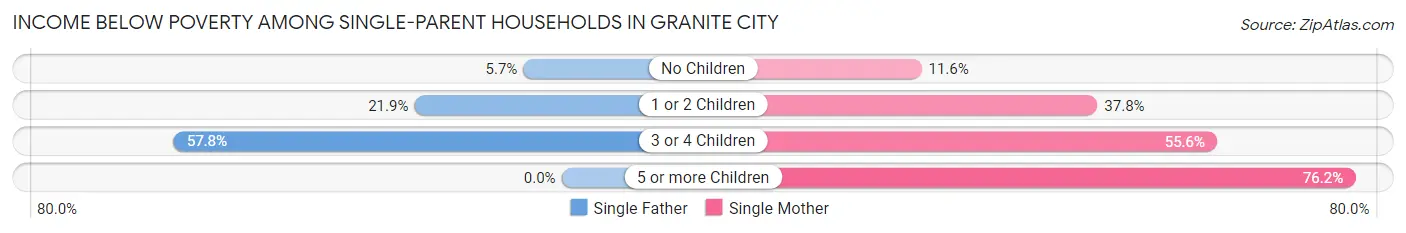
Income Below Poverty Among Single-Parent Households in Granite City
According to the poverty data in Granite City, 20.6% or 153 single-father households and 32.2% or 636 single-mother households are living below the poverty line. Among single-father households, those with 3 or 4 children have the highest poverty rate, with 67 households (57.8%) experiencing poverty. Likewise, among single-mother households, those with 5 or more children have the highest poverty rate, with 16 households (76.2%) falling below the poverty line.
| Children | Single Father | Single Mother |
| No Children | 18 (5.7%) | 76 (11.6%) |
| 1 or 2 Children | 68 (21.9%) | 380 (37.8%) |
| 3 or 4 Children | 67 (57.8%) | 164 (55.6%) |
| 5 or more Children | 0 (0.0%) | 16 (76.2%) |
| Total | 153 (20.6%) | 636 (32.2%) |
Income Below Poverty Among Married-Couple vs Single-Parent Households in Granite City
The poverty data for Granite City shows that 182 of the married-couple family households (4.3%) and 789 of the single-parent households (29.0%) are living below the poverty level. Within the married-couple family households, those with 3 or 4 children have the highest poverty rate, with 33 households (13.3%) falling below the poverty line. Among the single-parent households, those with 5 or more children have the highest poverty rate, with 16 household (76.2%) living below poverty.
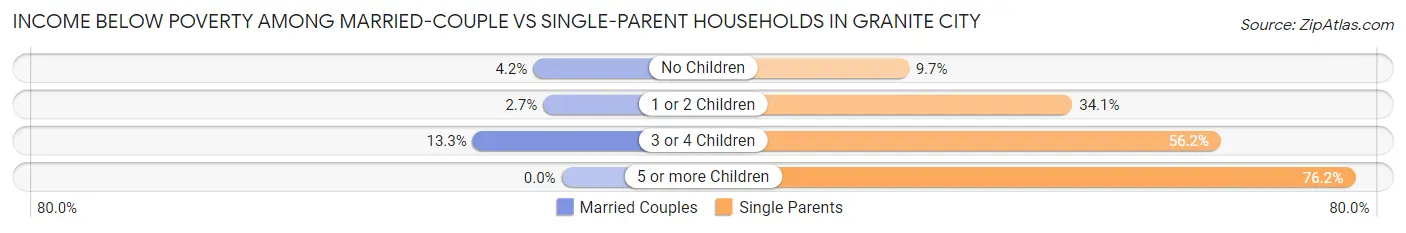
| Children | Married-Couple Families | Single-Parent Households |
| No Children | 116 (4.2%) | 94 (9.7%) |
| 1 or 2 Children | 33 (2.7%) | 448 (34.1%) |
| 3 or 4 Children | 33 (13.3%) | 231 (56.2%) |
| 5 or more Children | 0 (0.0%) | 16 (76.2%) |
| Total | 182 (4.3%) | 789 (29.0%) |
Employment Characteristics in Granite City
Employment by Class of Employer in Granite City
Among the 12,054 employed individuals in Granite City, private company employees (8,746 | 72.6%), not-for-profit organizations (1,240 | 10.3%), and local government employees (883 | 7.3%) make up the most common classes of employment.
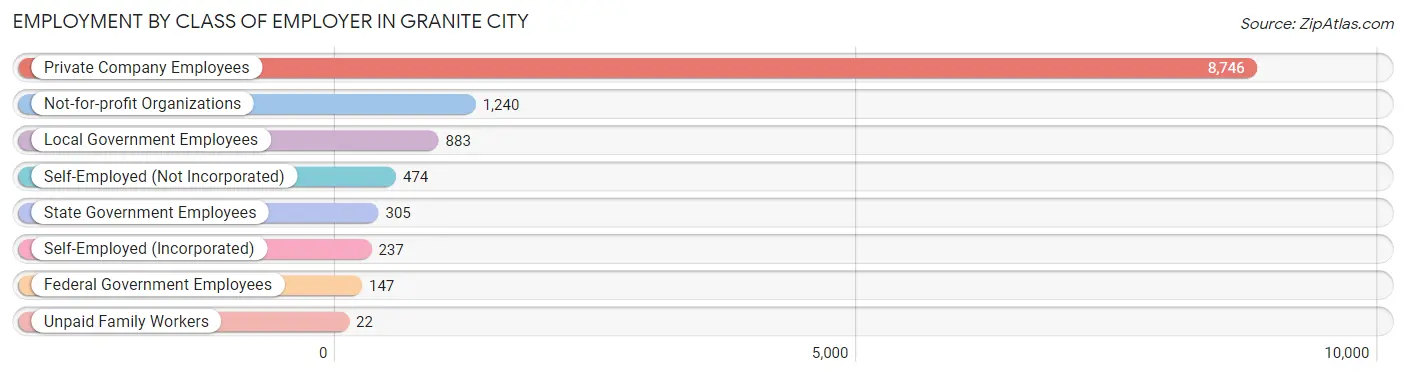
| Employer Class | # Employees | % Employees |
| Private Company Employees | 8,746 | 72.6% |
| Self-Employed (Incorporated) | 237 | 2.0% |
| Self-Employed (Not Incorporated) | 474 | 3.9% |
| Not-for-profit Organizations | 1,240 | 10.3% |
| Local Government Employees | 883 | 7.3% |
| State Government Employees | 305 | 2.5% |
| Federal Government Employees | 147 | 1.2% |
| Unpaid Family Workers | 22 | 0.2% |
| Total | 12,054 | 100.0% |
Employment Status by Age in Granite City
According to the labor force statistics for Granite City, out of the total population over 16 years of age (21,996), 61.0% or 13,418 individuals are in the labor force, with 8.0% or 1,073 of them unemployed. The age group with the highest labor force participation rate is 30 to 34 years, with 87.6% or 1,675 individuals in the labor force. Within the labor force, the 16 to 19 years age range has the highest percentage of unemployed individuals, with 37.6% or 331 of them being unemployed.
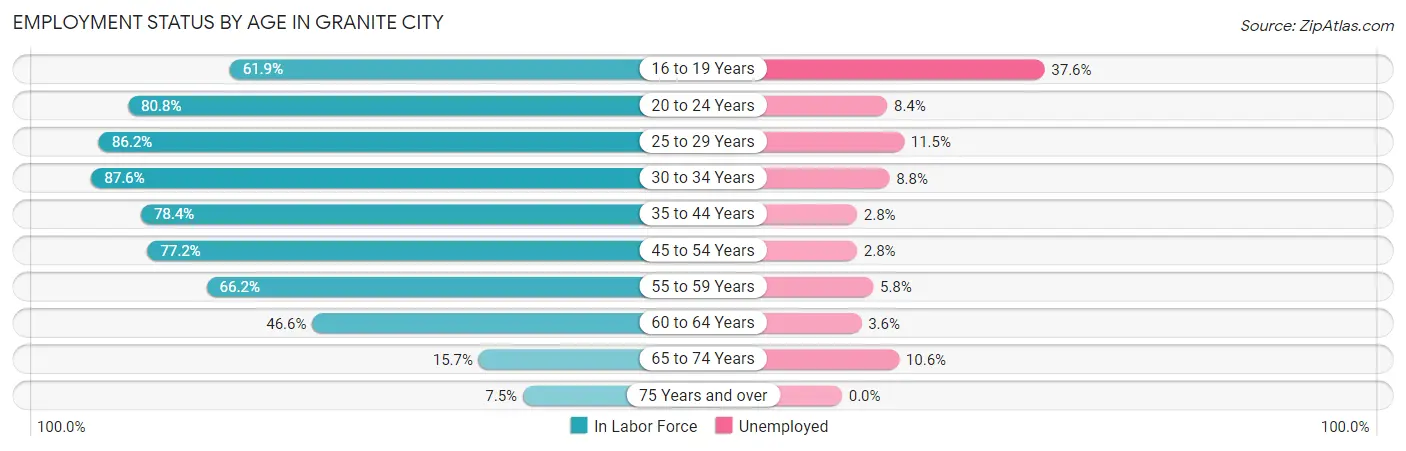
| Age Bracket | In Labor Force | Unemployed |
| 16 to 19 Years | 880 (61.9%) | 331 (37.6%) |
| 20 to 24 Years | 1,025 (80.8%) | 86 (8.4%) |
| 25 to 29 Years | 1,858 (86.2%) | 214 (11.5%) |
| 30 to 34 Years | 1,675 (87.6%) | 147 (8.8%) |
| 35 to 44 Years | 2,895 (78.4%) | 81 (2.8%) |
| 45 to 54 Years | 2,385 (77.2%) | 67 (2.8%) |
| 55 to 59 Years | 1,141 (66.2%) | 66 (5.8%) |
| 60 to 64 Years | 985 (46.6%) | 35 (3.6%) |
| 65 to 74 Years | 436 (15.7%) | 46 (10.6%) |
| 75 Years and over | 138 (7.5%) | 0 (0.0%) |
| Total | 13,418 (61.0%) | 1,073 (8.0%) |
Employment Status by Educational Attainment in Granite City
According to labor force statistics for Granite City, 74.5% of individuals (10,943) out of the total population between 25 and 64 years of age (14,688) are in the labor force, with 5.6% or 613 of them being unemployed. The group with the highest labor force participation rate are those with the educational attainment of bachelor's degree or higher, with 84.0% or 1,812 individuals in the labor force. Within the labor force, individuals with less than high school education have the highest percentage of unemployment, with 14.2% or 109 of them being unemployed.
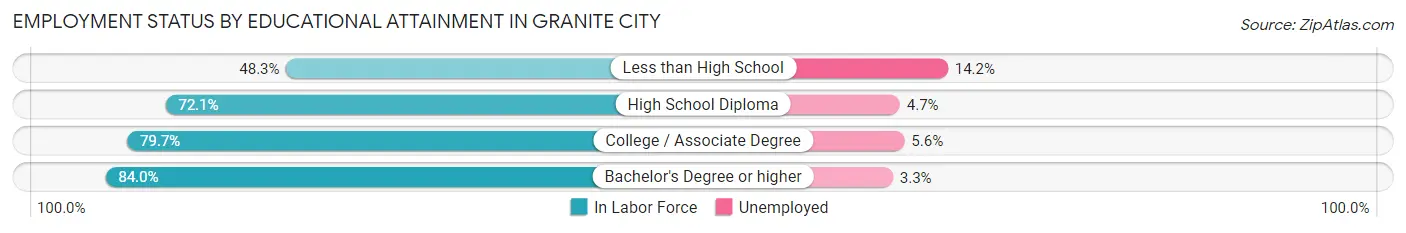
| Educational Attainment | In Labor Force | Unemployed |
| Less than High School | 766 (48.3%) | 225 (14.2%) |
| High School Diploma | 3,419 (72.1%) | 223 (4.7%) |
| College / Associate Degree | 4,945 (79.7%) | 347 (5.6%) |
| Bachelor's Degree or higher | 1,812 (84.0%) | 71 (3.3%) |
| Total | 10,943 (74.5%) | 823 (5.6%) |
Employment Occupations by Sex in Granite City
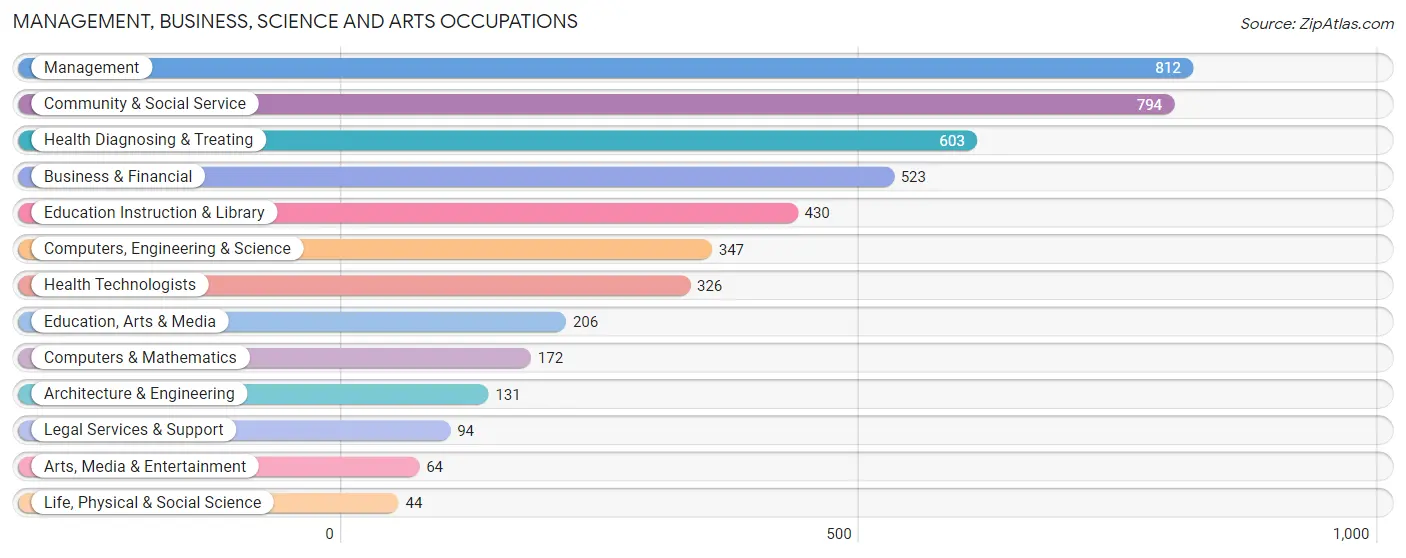
Management, Business, Science and Arts Occupations
The most common Management, Business, Science and Arts occupations in Granite City are Management (812 | 6.6%), Community & Social Service (794 | 6.4%), Health Diagnosing & Treating (603 | 4.9%), Business & Financial (523 | 4.2%), and Education Instruction & Library (430 | 3.5%).
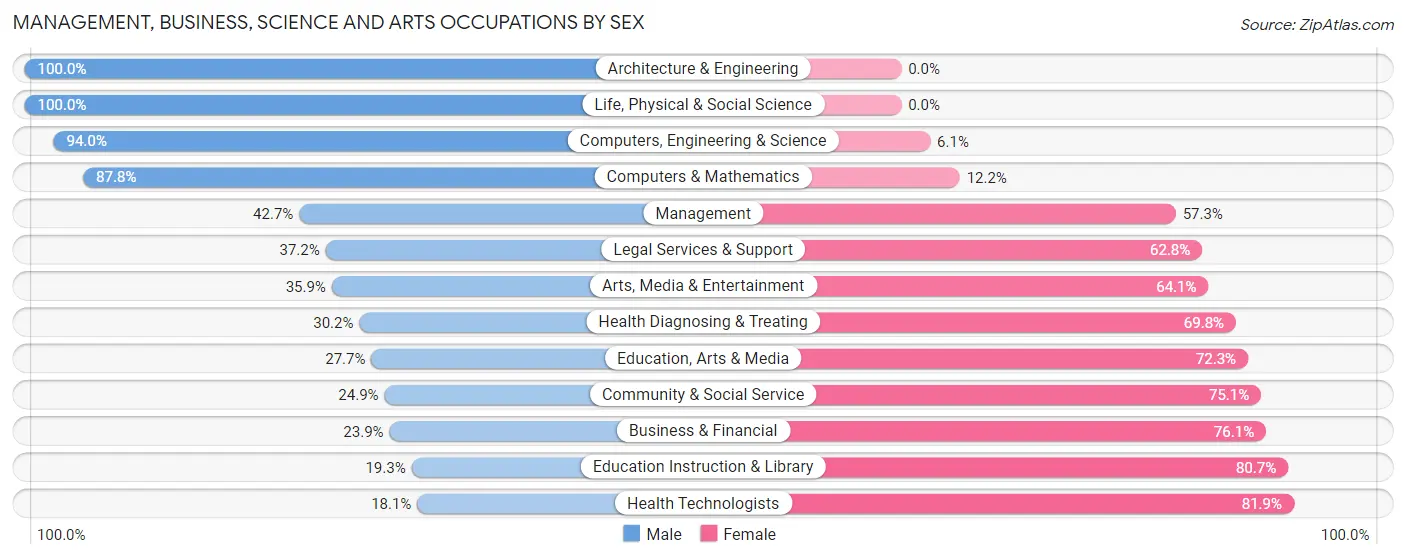
Management, Business, Science and Arts Occupations by Sex
Within the Management, Business, Science and Arts occupations in Granite City, the most male-oriented occupations are Architecture & Engineering (100.0%), Life, Physical & Social Science (100.0%), and Computers, Engineering & Science (94.0%), while the most female-oriented occupations are Health Technologists (81.9%), Education Instruction & Library (80.7%), and Business & Financial (76.1%).
| Occupation | Male | Female |
| Management | 347 (42.7%) | 465 (57.3%) |
| Business & Financial | 125 (23.9%) | 398 (76.1%) |
| Computers, Engineering & Science | 326 (94.0%) | 21 (6.0%) |
| Computers & Mathematics | 151 (87.8%) | 21 (12.2%) |
| Architecture & Engineering | 131 (100.0%) | 0 (0.0%) |
| Life, Physical & Social Science | 44 (100.0%) | 0 (0.0%) |
| Community & Social Service | 198 (24.9%) | 596 (75.1%) |
| Education, Arts & Media | 57 (27.7%) | 149 (72.3%) |
| Legal Services & Support | 35 (37.2%) | 59 (62.8%) |
| Education Instruction & Library | 83 (19.3%) | 347 (80.7%) |
| Arts, Media & Entertainment | 23 (35.9%) | 41 (64.1%) |
| Health Diagnosing & Treating | 182 (30.2%) | 421 (69.8%) |
| Health Technologists | 59 (18.1%) | 267 (81.9%) |
| Total (Category) | 1,178 (38.3%) | 1,901 (61.7%) |
| Total (Overall) | 6,542 (53.0%) | 5,803 (47.0%) |
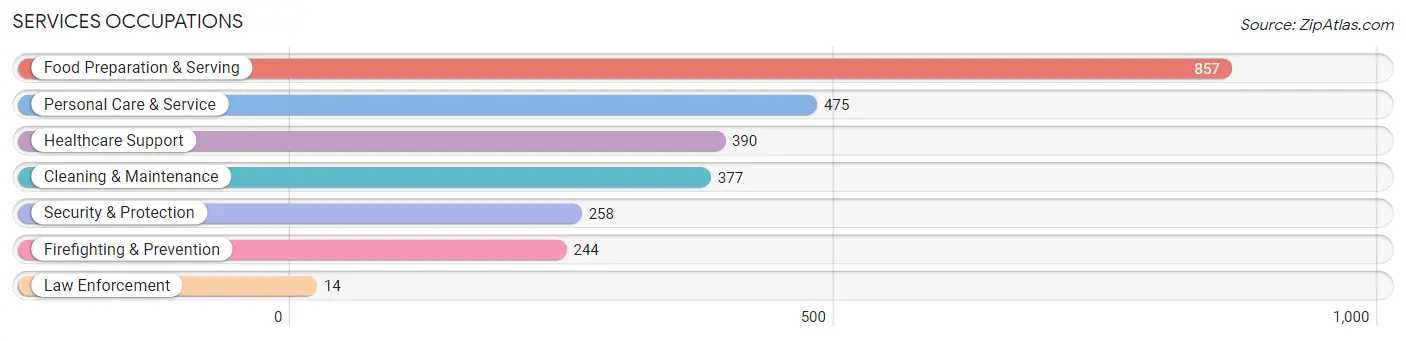
Services Occupations
The most common Services occupations in Granite City are Food Preparation & Serving (857 | 6.9%), Personal Care & Service (475 | 3.8%), Healthcare Support (390 | 3.2%), Cleaning & Maintenance (377 | 3.0%), and Security & Protection (258 | 2.1%).
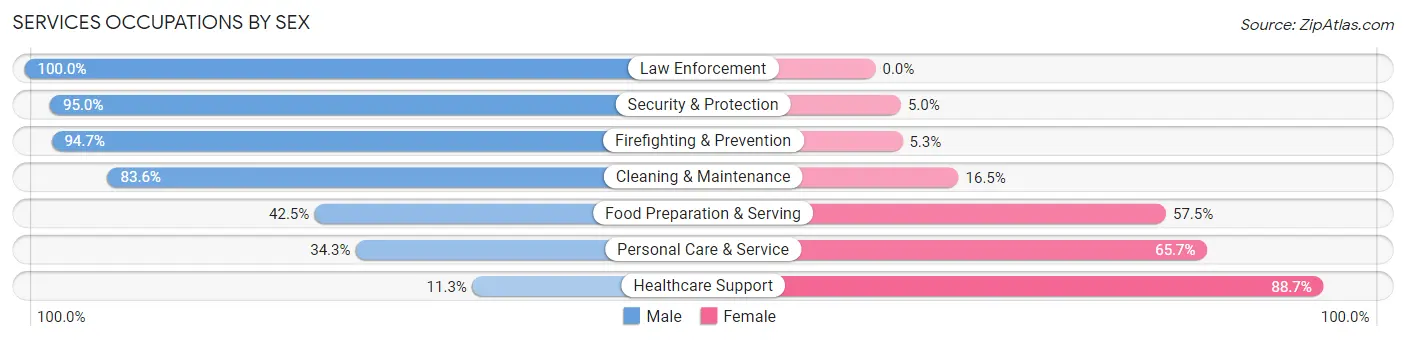
Services Occupations by Sex
Within the Services occupations in Granite City, the most male-oriented occupations are Law Enforcement (100.0%), Security & Protection (95.0%), and Firefighting & Prevention (94.7%), while the most female-oriented occupations are Healthcare Support (88.7%), Personal Care & Service (65.7%), and Food Preparation & Serving (57.5%).
| Occupation | Male | Female |
| Healthcare Support | 44 (11.3%) | 346 (88.7%) |
| Security & Protection | 245 (95.0%) | 13 (5.0%) |
| Firefighting & Prevention | 231 (94.7%) | 13 (5.3%) |
| Law Enforcement | 14 (100.0%) | 0 (0.0%) |
| Food Preparation & Serving | 364 (42.5%) | 493 (57.5%) |
| Cleaning & Maintenance | 315 (83.6%) | 62 (16.5%) |
| Personal Care & Service | 163 (34.3%) | 312 (65.7%) |
| Total (Category) | 1,131 (48.0%) | 1,226 (52.0%) |
| Total (Overall) | 6,542 (53.0%) | 5,803 (47.0%) |
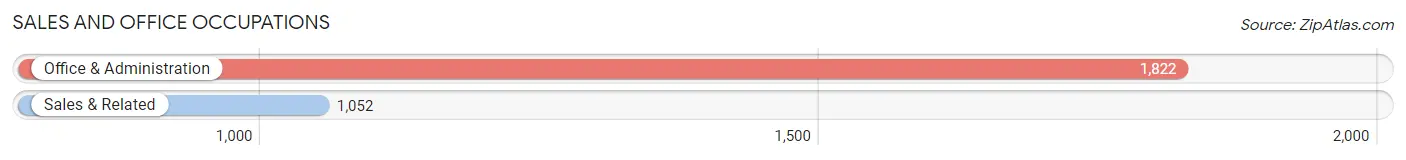
Sales and Office Occupations
The most common Sales and Office occupations in Granite City are Office & Administration (1,822 | 14.8%), and Sales & Related (1,052 | 8.5%).
Sales and Office Occupations by Sex
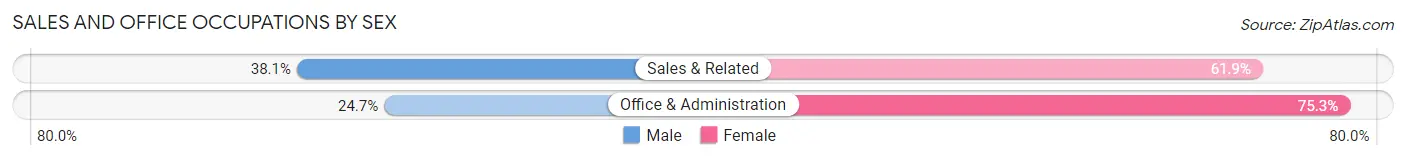
| Occupation | Male | Female |
| Sales & Related | 401 (38.1%) | 651 (61.9%) |
| Office & Administration | 450 (24.7%) | 1,372 (75.3%) |
| Total (Category) | 851 (29.6%) | 2,023 (70.4%) |
| Total (Overall) | 6,542 (53.0%) | 5,803 (47.0%) |
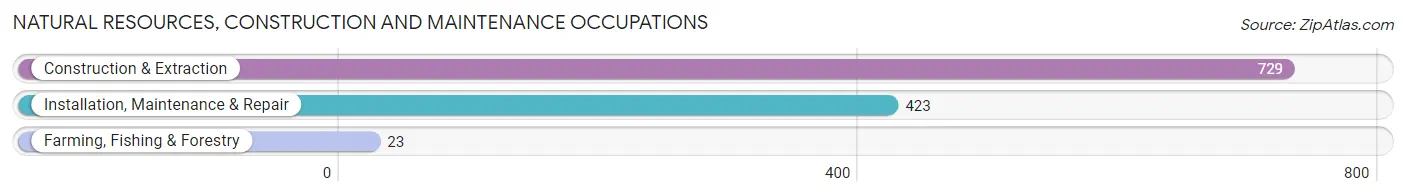
Natural Resources, Construction and Maintenance Occupations
The most common Natural Resources, Construction and Maintenance occupations in Granite City are Construction & Extraction (729 | 5.9%), Installation, Maintenance & Repair (423 | 3.4%), and Farming, Fishing & Forestry (23 | 0.2%).
Natural Resources, Construction and Maintenance Occupations by Sex
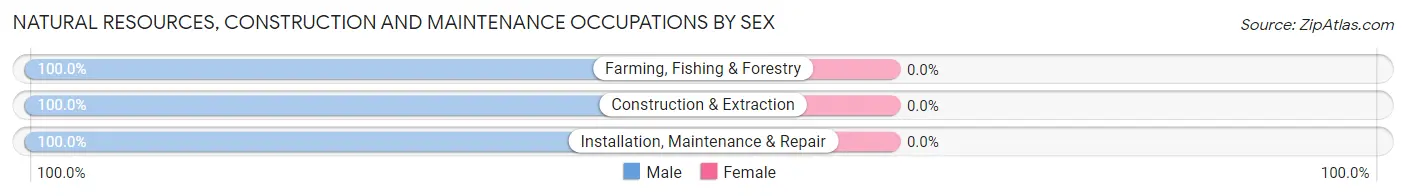
| Occupation | Male | Female |
| Farming, Fishing & Forestry | 23 (100.0%) | 0 (0.0%) |
| Construction & Extraction | 729 (100.0%) | 0 (0.0%) |
| Installation, Maintenance & Repair | 423 (100.0%) | 0 (0.0%) |
| Total (Category) | 1,175 (100.0%) | 0 (0.0%) |
| Total (Overall) | 6,542 (53.0%) | 5,803 (47.0%) |
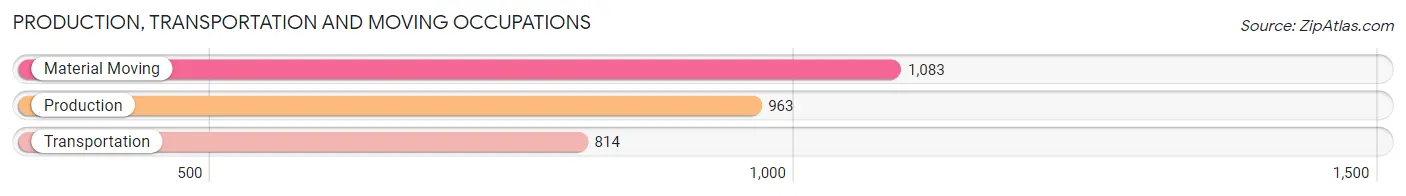
Production, Transportation and Moving Occupations
The most common Production, Transportation and Moving occupations in Granite City are Material Moving (1,083 | 8.8%), Production (963 | 7.8%), and Transportation (814 | 6.6%).
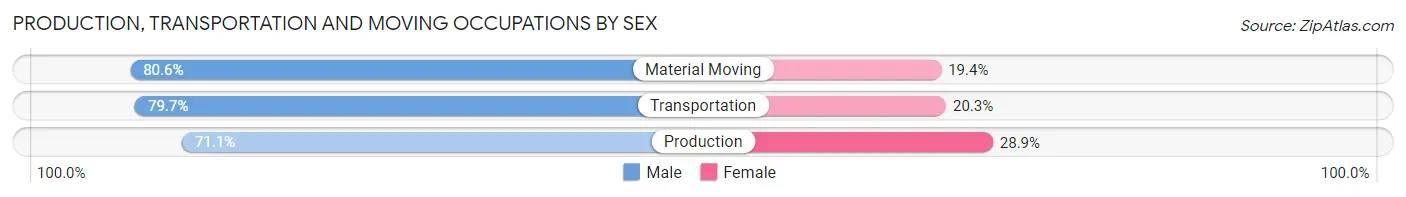
Production, Transportation and Moving Occupations by Sex
| Occupation | Male | Female |
| Production | 685 (71.1%) | 278 (28.9%) |
| Transportation | 649 (79.7%) | 165 (20.3%) |
| Material Moving | 873 (80.6%) | 210 (19.4%) |
| Total (Category) | 2,207 (77.2%) | 653 (22.8%) |
| Total (Overall) | 6,542 (53.0%) | 5,803 (47.0%) |
Employment Industries by Sex in Granite City
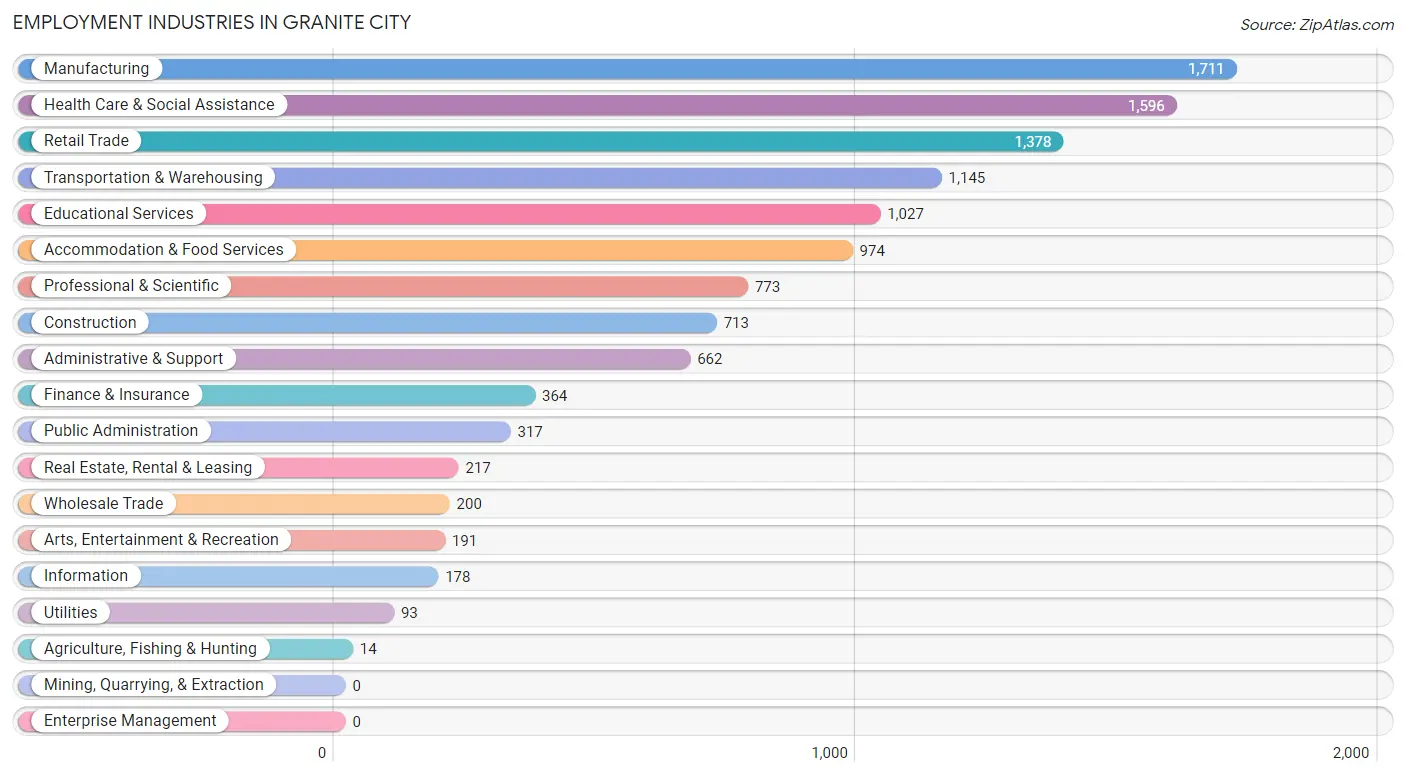
Employment Industries in Granite City
The major employment industries in Granite City include Manufacturing (1,711 | 13.9%), Health Care & Social Assistance (1,596 | 12.9%), Retail Trade (1,378 | 11.2%), Transportation & Warehousing (1,145 | 9.3%), and Educational Services (1,027 | 8.3%).
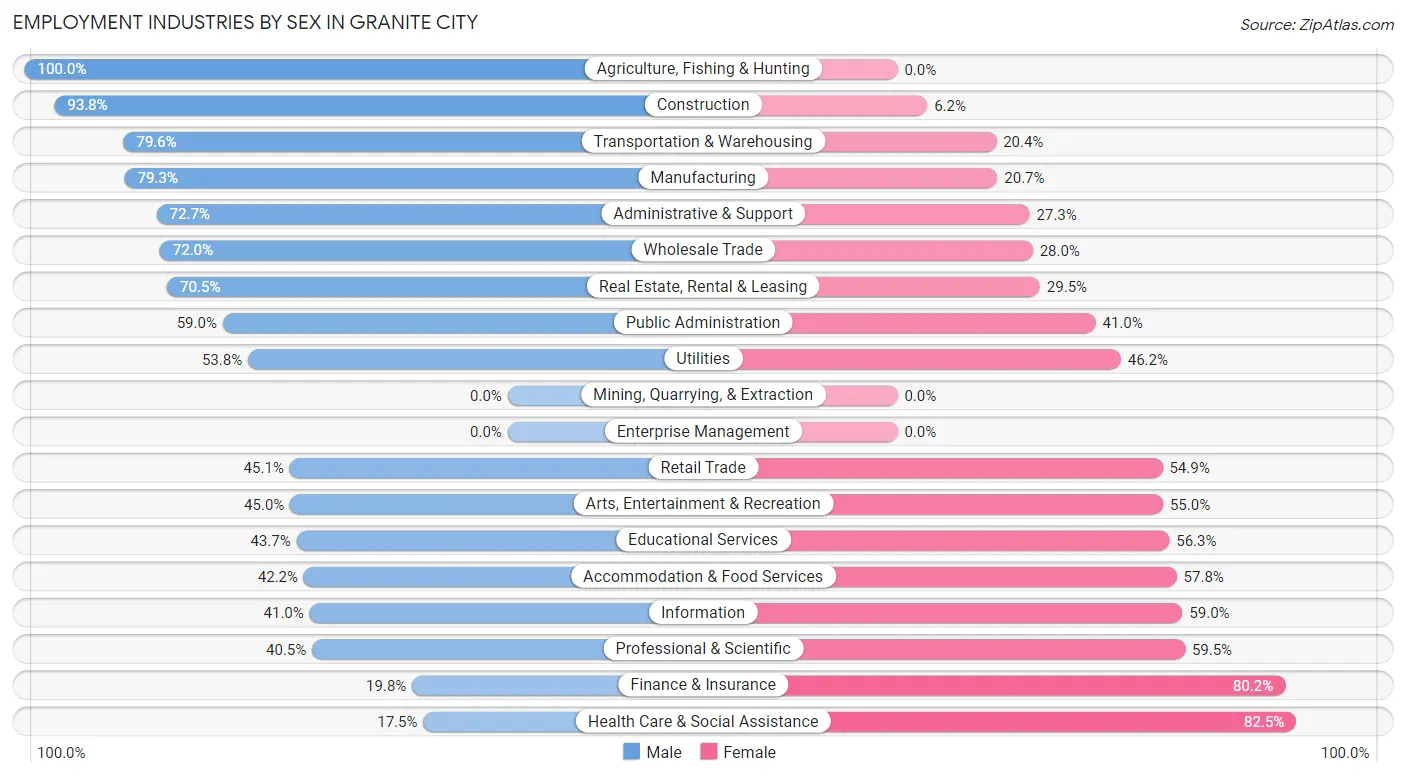
Employment Industries by Sex in Granite City
The Granite City industries that see more men than women are Agriculture, Fishing & Hunting (100.0%), Construction (93.8%), and Transportation & Warehousing (79.6%), whereas the industries that tend to have a higher number of women are Health Care & Social Assistance (82.5%), Finance & Insurance (80.2%), and Professional & Scientific (59.5%).
| Industry | Male | Female |
| Agriculture, Fishing & Hunting | 14 (100.0%) | 0 (0.0%) |
| Mining, Quarrying, & Extraction | 0 (0.0%) | 0 (0.0%) |
| Construction | 669 (93.8%) | 44 (6.2%) |
| Manufacturing | 1,357 (79.3%) | 354 (20.7%) |
| Wholesale Trade | 144 (72.0%) | 56 (28.0%) |
| Retail Trade | 622 (45.1%) | 756 (54.9%) |
| Transportation & Warehousing | 911 (79.6%) | 234 (20.4%) |
| Utilities | 50 (53.8%) | 43 (46.2%) |
| Information | 73 (41.0%) | 105 (59.0%) |
| Finance & Insurance | 72 (19.8%) | 292 (80.2%) |
| Real Estate, Rental & Leasing | 153 (70.5%) | 64 (29.5%) |
| Professional & Scientific | 313 (40.5%) | 460 (59.5%) |
| Enterprise Management | 0 (0.0%) | 0 (0.0%) |
| Administrative & Support | 481 (72.7%) | 181 (27.3%) |
| Educational Services | 449 (43.7%) | 578 (56.3%) |
| Health Care & Social Assistance | 279 (17.5%) | 1,317 (82.5%) |
| Arts, Entertainment & Recreation | 86 (45.0%) | 105 (55.0%) |
| Accommodation & Food Services | 411 (42.2%) | 563 (57.8%) |
| Public Administration | 187 (59.0%) | 130 (41.0%) |
| Total | 6,542 (53.0%) | 5,803 (47.0%) |
Education in Granite City
School Enrollment in Granite City
The most common levels of schooling among the 6,089 students in Granite City are middle school (1,475 | 24.2%), high school (1,401 | 23.0%), and elementary school (1,285 | 21.1%).
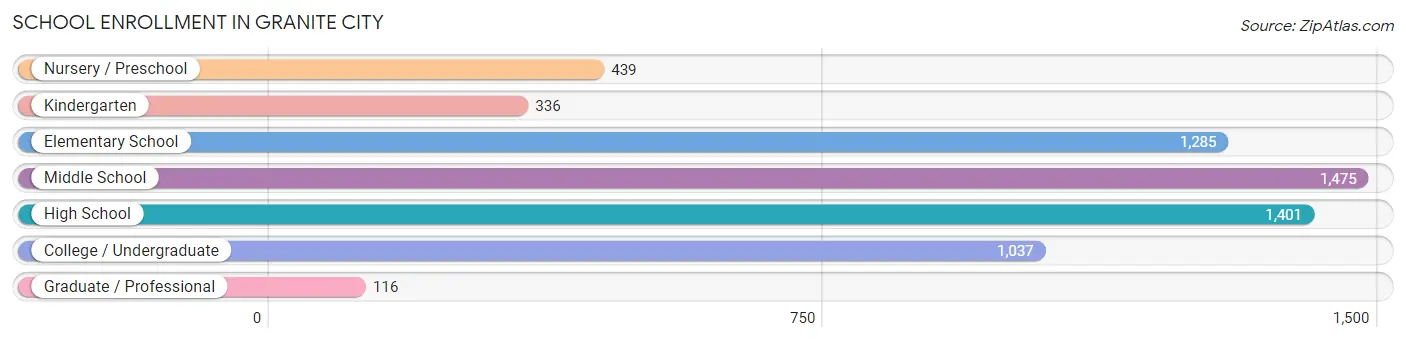
| School Level | # Students | % Students |
| Nursery / Preschool | 439 | 7.2% |
| Kindergarten | 336 | 5.5% |
| Elementary School | 1,285 | 21.1% |
| Middle School | 1,475 | 24.2% |
| High School | 1,401 | 23.0% |
| College / Undergraduate | 1,037 | 17.0% |
| Graduate / Professional | 116 | 1.9% |
| Total | 6,089 | 100.0% |
School Enrollment by Age by Funding Source in Granite City
Out of a total of 6,089 students who are enrolled in schools in Granite City, 895 (14.7%) attend a private institution, while the remaining 5,194 (85.3%) are enrolled in public schools. The age group of 5 to 9 year old has the highest likelihood of being enrolled in private schools, with 431 (27.1% in the age bracket) enrolled. Conversely, the age group of 35 years and over has the lowest likelihood of being enrolled in a private school, with 139 (100.0% in the age bracket) attending a public institution.
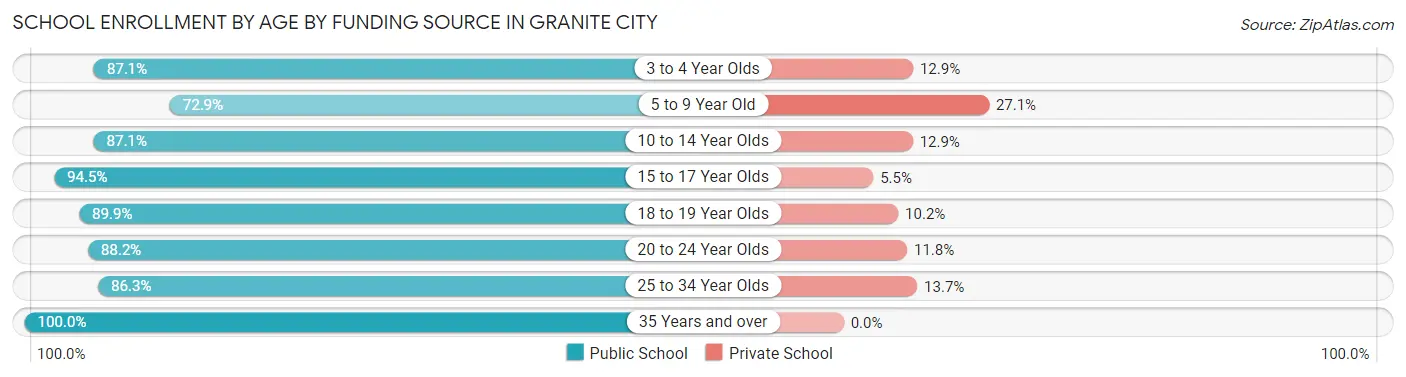
| Age Bracket | Public School | Private School |
| 3 to 4 Year Olds | 263 (87.1%) | 39 (12.9%) |
| 5 to 9 Year Old | 1,162 (72.9%) | 431 (27.1%) |
| 10 to 14 Year Olds | 1,477 (87.1%) | 218 (12.9%) |
| 15 to 17 Year Olds | 1,049 (94.5%) | 61 (5.5%) |
| 18 to 19 Year Olds | 407 (89.8%) | 46 (10.2%) |
| 20 to 24 Year Olds | 426 (88.2%) | 57 (11.8%) |
| 25 to 34 Year Olds | 271 (86.3%) | 43 (13.7%) |
| 35 Years and over | 139 (100.0%) | 0 (0.0%) |
| Total | 5,194 (85.3%) | 895 (14.7%) |
Educational Attainment by Field of Study in Granite City
Education (562 | 18.2%), business (358 | 11.6%), visual & performing arts (258 | 8.4%), science & technology (247 | 8.0%), and bio, nature & agricultural (242 | 7.9%) are the most common fields of study among 3,084 individuals in Granite City who have obtained a bachelor's degree or higher.
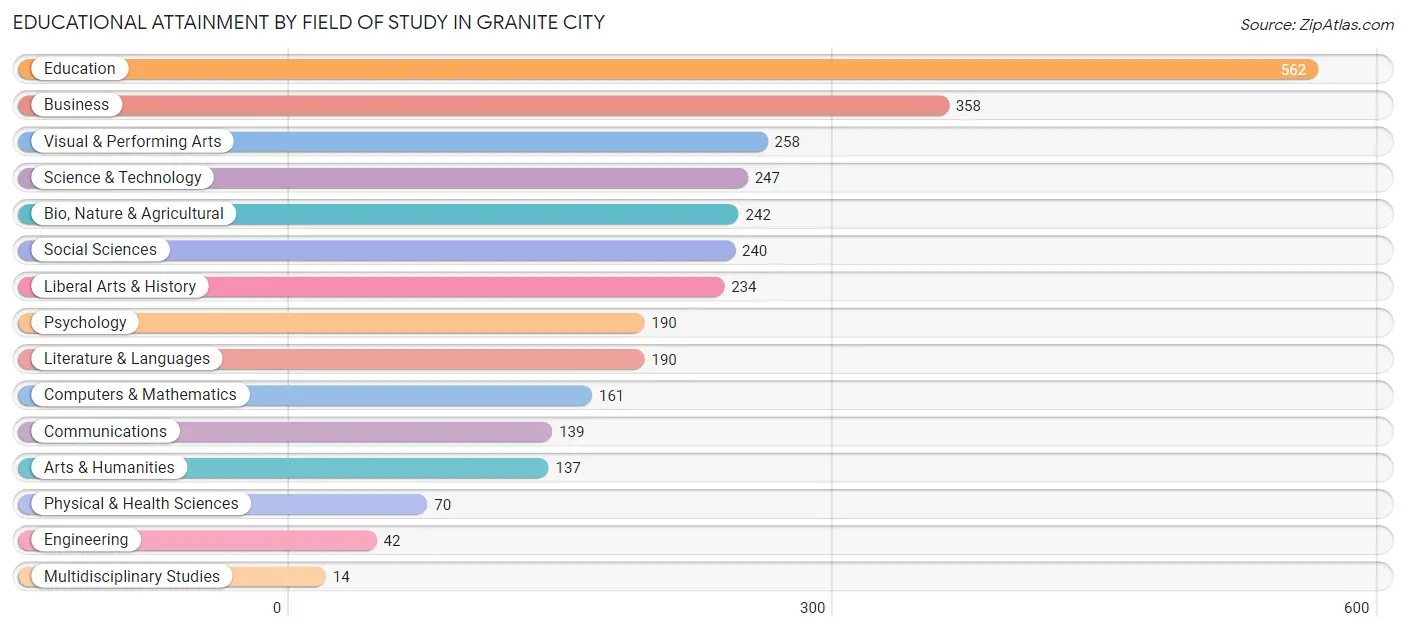
| Field of Study | # Graduates | % Graduates |
| Computers & Mathematics | 161 | 5.2% |
| Bio, Nature & Agricultural | 242 | 7.9% |
| Physical & Health Sciences | 70 | 2.3% |
| Psychology | 190 | 6.2% |
| Social Sciences | 240 | 7.8% |
| Engineering | 42 | 1.4% |
| Multidisciplinary Studies | 14 | 0.4% |
| Science & Technology | 247 | 8.0% |
| Business | 358 | 11.6% |
| Education | 562 | 18.2% |
| Literature & Languages | 190 | 6.2% |
| Liberal Arts & History | 234 | 7.6% |
| Visual & Performing Arts | 258 | 8.4% |
| Communications | 139 | 4.5% |
| Arts & Humanities | 137 | 4.4% |
| Total | 3,084 | 100.0% |
Transportation & Commute in Granite City
Vehicle Availability by Sex in Granite City
The most prevalent vehicle ownership categories in Granite City are males with 2 vehicles (2,765, accounting for 42.7%) and females with 2 vehicles (1,888, making up 49.7%).
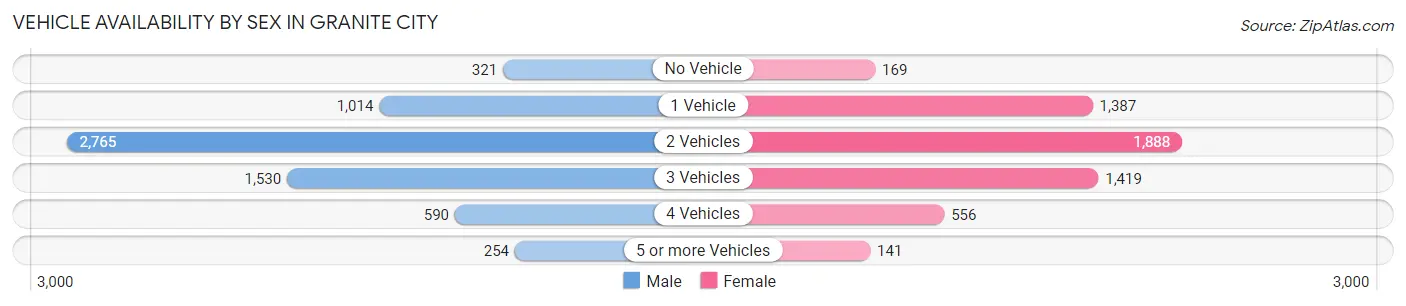
| Vehicles Available | Male | Female |
| No Vehicle | 321 (5.0%) | 169 (3.0%) |
| 1 Vehicle | 1,014 (15.7%) | 1,387 (24.9%) |
| 2 Vehicles | 2,765 (42.7%) | 1,888 (34.0%) |
| 3 Vehicles | 1,530 (23.6%) | 1,419 (25.5%) |
| 4 Vehicles | 590 (9.1%) | 556 (10.0%) |
| 5 or more Vehicles | 254 (3.9%) | 141 (2.5%) |
| Total | 6,474 (100.0%) | 5,560 (100.0%) |
Commute Time in Granite City
The most frequently occuring commute durations in Granite City are 10 to 14 minutes (1,748 commuters, 15.4%), 5 to 9 minutes (1,745 commuters, 15.4%), and 30 to 34 minutes (1,679 commuters, 14.8%).
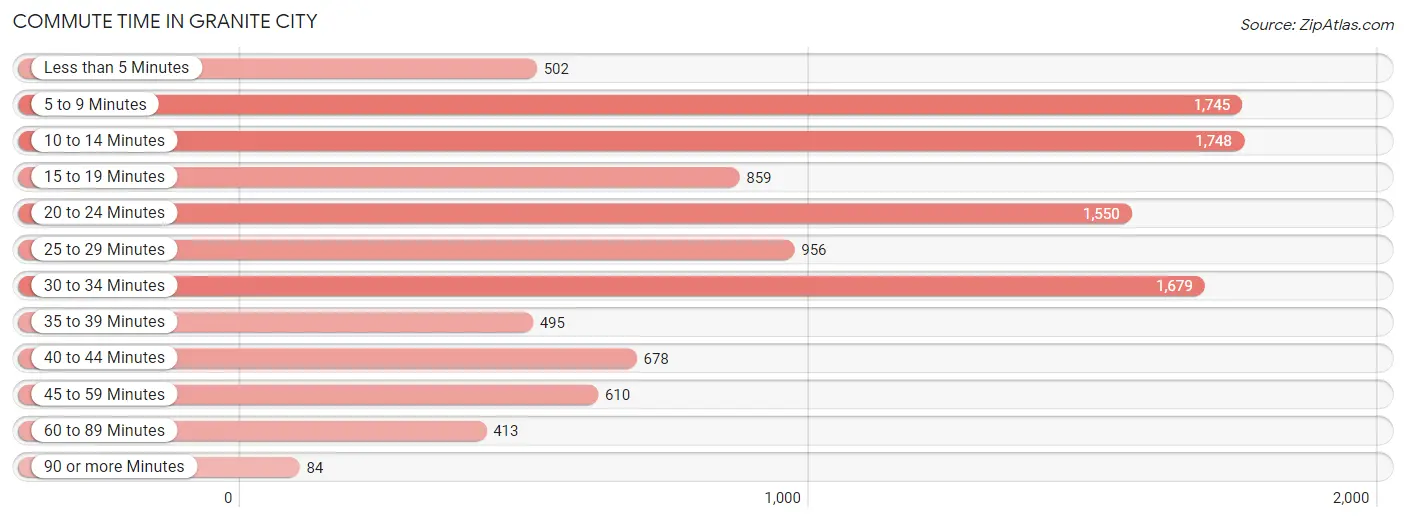
| Commute Time | # Commuters | % Commuters |
| Less than 5 Minutes | 502 | 4.4% |
| 5 to 9 Minutes | 1,745 | 15.4% |
| 10 to 14 Minutes | 1,748 | 15.4% |
| 15 to 19 Minutes | 859 | 7.6% |
| 20 to 24 Minutes | 1,550 | 13.7% |
| 25 to 29 Minutes | 956 | 8.5% |
| 30 to 34 Minutes | 1,679 | 14.8% |
| 35 to 39 Minutes | 495 | 4.4% |
| 40 to 44 Minutes | 678 | 6.0% |
| 45 to 59 Minutes | 610 | 5.4% |
| 60 to 89 Minutes | 413 | 3.6% |
| 90 or more Minutes | 84 | 0.7% |
Commute Time by Sex in Granite City
The most common commute times in Granite City are 10 to 14 minutes (1,175 commuters, 19.0%) for males and 30 to 34 minutes (889 commuters, 17.3%) for females.
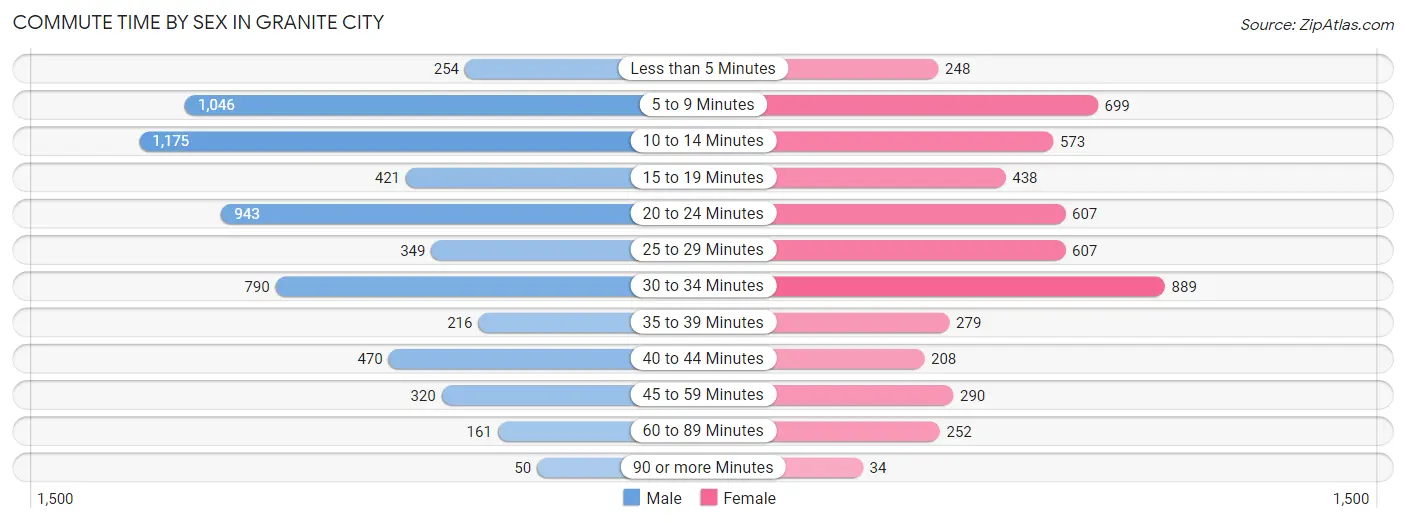
| Commute Time | Male | Female |
| Less than 5 Minutes | 254 (4.1%) | 248 (4.8%) |
| 5 to 9 Minutes | 1,046 (16.9%) | 699 (13.6%) |
| 10 to 14 Minutes | 1,175 (19.0%) | 573 (11.2%) |
| 15 to 19 Minutes | 421 (6.8%) | 438 (8.6%) |
| 20 to 24 Minutes | 943 (15.2%) | 607 (11.8%) |
| 25 to 29 Minutes | 349 (5.6%) | 607 (11.8%) |
| 30 to 34 Minutes | 790 (12.8%) | 889 (17.3%) |
| 35 to 39 Minutes | 216 (3.5%) | 279 (5.4%) |
| 40 to 44 Minutes | 470 (7.6%) | 208 (4.1%) |
| 45 to 59 Minutes | 320 (5.2%) | 290 (5.7%) |
| 60 to 89 Minutes | 161 (2.6%) | 252 (4.9%) |
| 90 or more Minutes | 50 (0.8%) | 34 (0.7%) |
Time of Departure to Work by Sex in Granite City
The most frequent times of departure to work in Granite City are 12:00 PM to 3:59 PM (926, 14.9%) for males and 7:30 AM to 7:59 AM (720, 14.1%) for females.
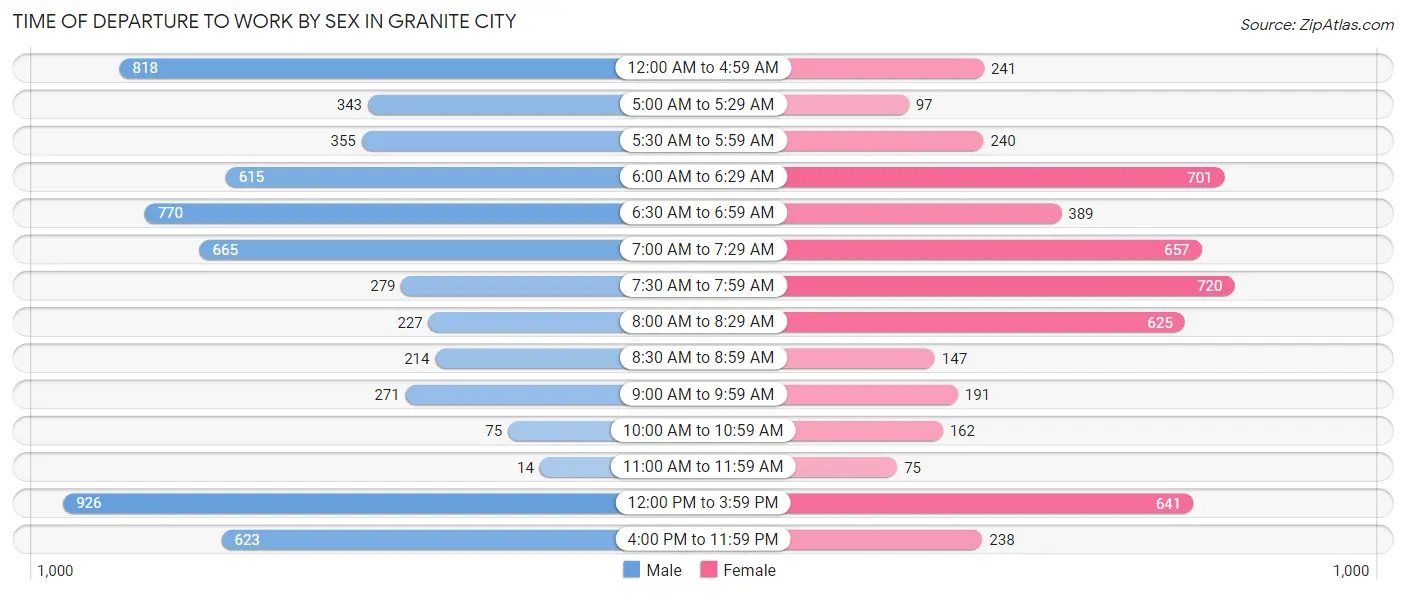
| Time of Departure | Male | Female |
| 12:00 AM to 4:59 AM | 818 (13.2%) | 241 (4.7%) |
| 5:00 AM to 5:29 AM | 343 (5.5%) | 97 (1.9%) |
| 5:30 AM to 5:59 AM | 355 (5.7%) | 240 (4.7%) |
| 6:00 AM to 6:29 AM | 615 (9.9%) | 701 (13.7%) |
| 6:30 AM to 6:59 AM | 770 (12.4%) | 389 (7.6%) |
| 7:00 AM to 7:29 AM | 665 (10.7%) | 657 (12.8%) |
| 7:30 AM to 7:59 AM | 279 (4.5%) | 720 (14.1%) |
| 8:00 AM to 8:29 AM | 227 (3.7%) | 625 (12.2%) |
| 8:30 AM to 8:59 AM | 214 (3.5%) | 147 (2.9%) |
| 9:00 AM to 9:59 AM | 271 (4.4%) | 191 (3.7%) |
| 10:00 AM to 10:59 AM | 75 (1.2%) | 162 (3.2%) |
| 11:00 AM to 11:59 AM | 14 (0.2%) | 75 (1.5%) |
| 12:00 PM to 3:59 PM | 926 (14.9%) | 641 (12.5%) |
| 4:00 PM to 11:59 PM | 623 (10.1%) | 238 (4.6%) |
| Total | 6,195 (100.0%) | 5,124 (100.0%) |
Housing Occupancy in Granite City
Occupancy by Ownership in Granite City
Of the total 11,304 dwellings in Granite City, owner-occupied units account for 7,828 (69.3%), while renter-occupied units make up 3,476 (30.7%).
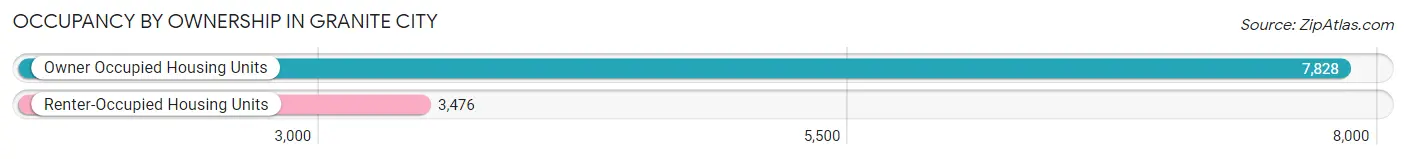
| Occupancy | # Housing Units | % Housing Units |
| Owner Occupied Housing Units | 7,828 | 69.3% |
| Renter-Occupied Housing Units | 3,476 | 30.7% |
| Total Occupied Housing Units | 11,304 | 100.0% |
Occupancy by Household Size in Granite City
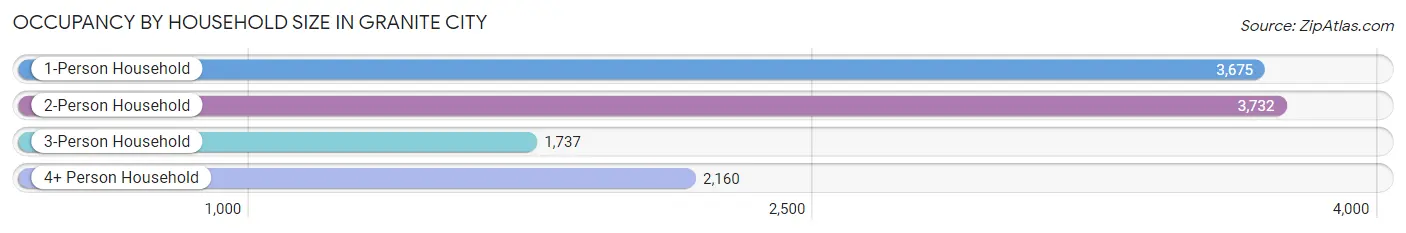
| Household Size | # Housing Units | % Housing Units |
| 1-Person Household | 3,675 | 32.5% |
| 2-Person Household | 3,732 | 33.0% |
| 3-Person Household | 1,737 | 15.4% |
| 4+ Person Household | 2,160 | 19.1% |
| Total Housing Units | 11,304 | 100.0% |
Occupancy by Ownership by Household Size in Granite City
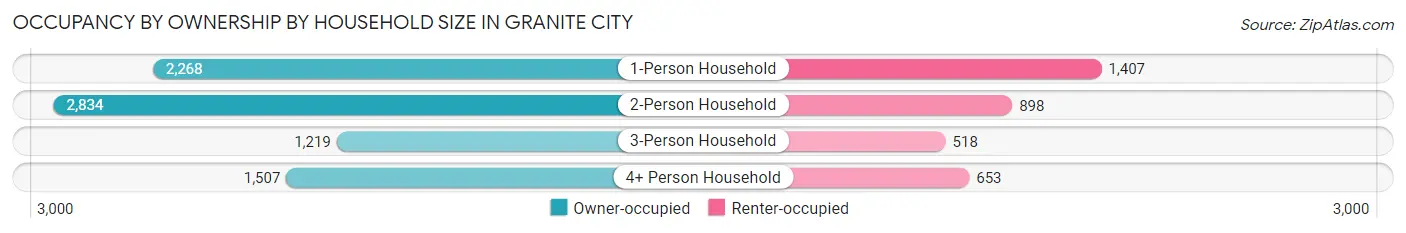
| Household Size | Owner-occupied | Renter-occupied |
| 1-Person Household | 2,268 (61.7%) | 1,407 (38.3%) |
| 2-Person Household | 2,834 (75.9%) | 898 (24.1%) |
| 3-Person Household | 1,219 (70.2%) | 518 (29.8%) |
| 4+ Person Household | 1,507 (69.8%) | 653 (30.2%) |
| Total Housing Units | 7,828 (69.3%) | 3,476 (30.7%) |
Occupancy by Educational Attainment in Granite City
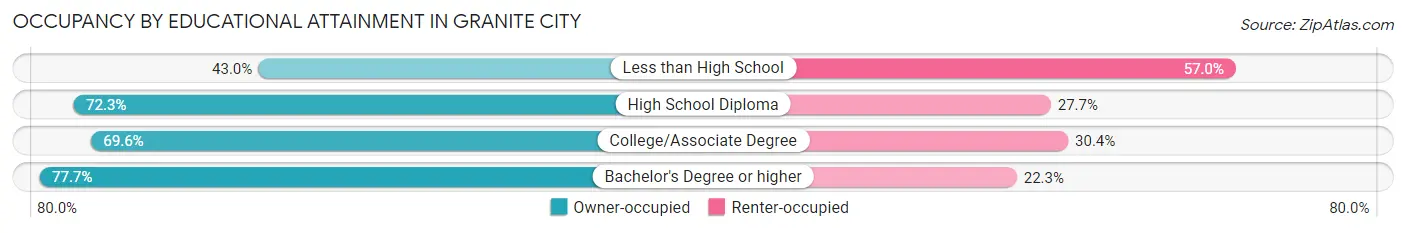
| Household Size | Owner-occupied | Renter-occupied |
| Less than High School | 464 (43.0%) | 616 (57.0%) |
| High School Diploma | 2,665 (72.3%) | 1,021 (27.7%) |
| College/Associate Degree | 3,257 (69.6%) | 1,425 (30.4%) |
| Bachelor's Degree or higher | 1,442 (77.7%) | 414 (22.3%) |
Occupancy by Age of Householder in Granite City
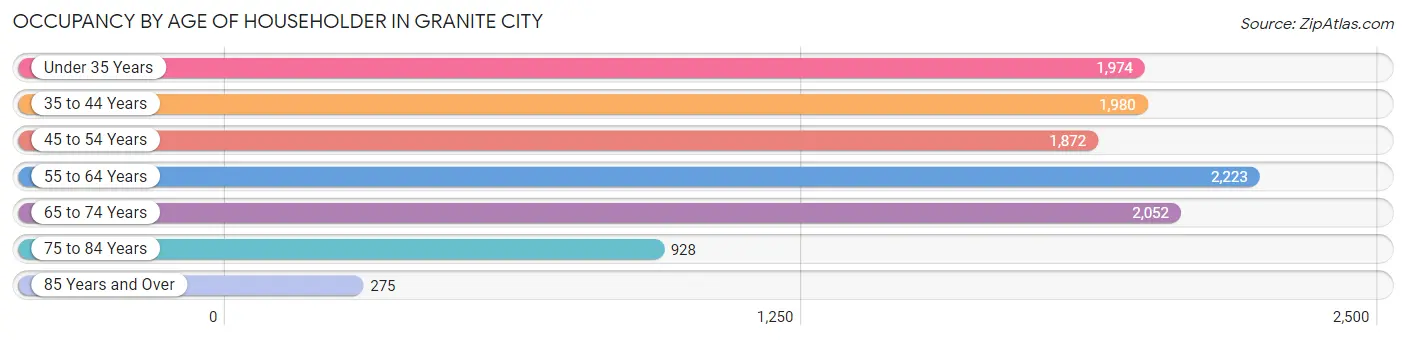
| Age Bracket | # Households | % Households |
| Under 35 Years | 1,974 | 17.5% |
| 35 to 44 Years | 1,980 | 17.5% |
| 45 to 54 Years | 1,872 | 16.6% |
| 55 to 64 Years | 2,223 | 19.7% |
| 65 to 74 Years | 2,052 | 18.1% |
| 75 to 84 Years | 928 | 8.2% |
| 85 Years and Over | 275 | 2.4% |
| Total | 11,304 | 100.0% |
Housing Finances in Granite City
Median Income by Occupancy in Granite City
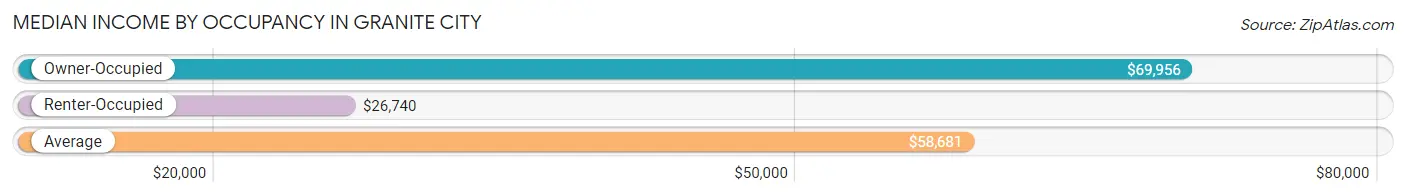
| Occupancy Type | # Households | Median Income |
| Owner-Occupied | 7,828 (69.3%) | $69,956 |
| Renter-Occupied | 3,476 (30.7%) | $26,740 |
| Average | 11,304 (100.0%) | $58,681 |
Occupancy by Householder Income Bracket in Granite City
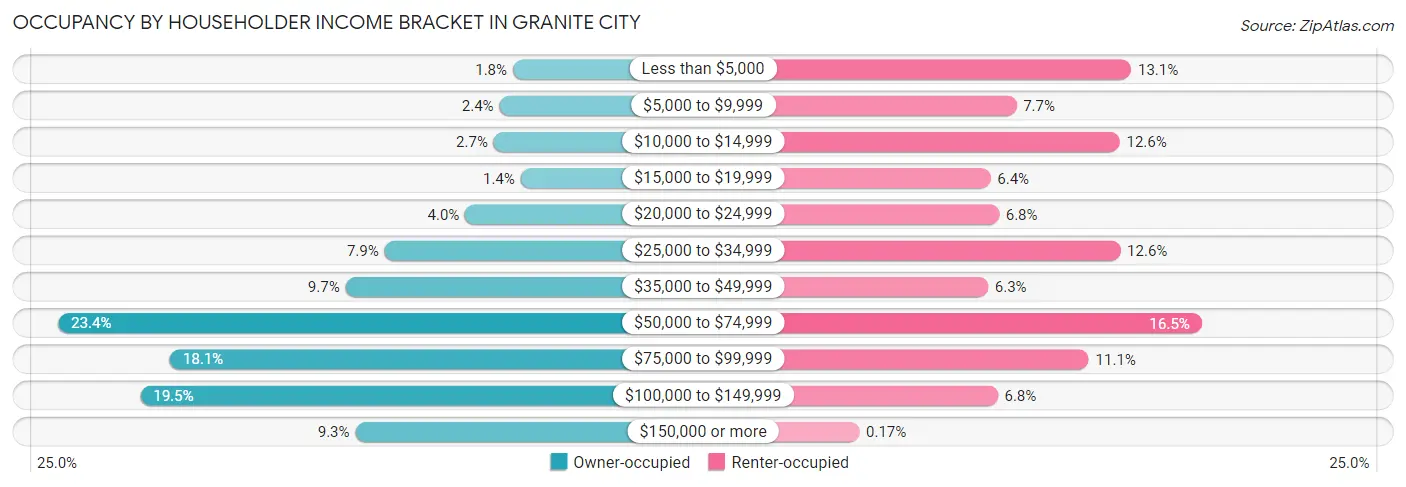
| Income Bracket | Owner-occupied | Renter-occupied |
| Less than $5,000 | 137 (1.8%) | 456 (13.1%) |
| $5,000 to $9,999 | 187 (2.4%) | 266 (7.6%) |
| $10,000 to $14,999 | 208 (2.7%) | 437 (12.6%) |
| $15,000 to $19,999 | 108 (1.4%) | 223 (6.4%) |
| $20,000 to $24,999 | 315 (4.0%) | 237 (6.8%) |
| $25,000 to $34,999 | 615 (7.9%) | 438 (12.6%) |
| $35,000 to $49,999 | 761 (9.7%) | 219 (6.3%) |
| $50,000 to $74,999 | 1,832 (23.4%) | 573 (16.5%) |
| $75,000 to $99,999 | 1,415 (18.1%) | 386 (11.1%) |
| $100,000 to $149,999 | 1,526 (19.5%) | 235 (6.8%) |
| $150,000 or more | 724 (9.2%) | 6 (0.2%) |
| Total | 7,828 (100.0%) | 3,476 (100.0%) |
Monthly Housing Cost Tiers in Granite City
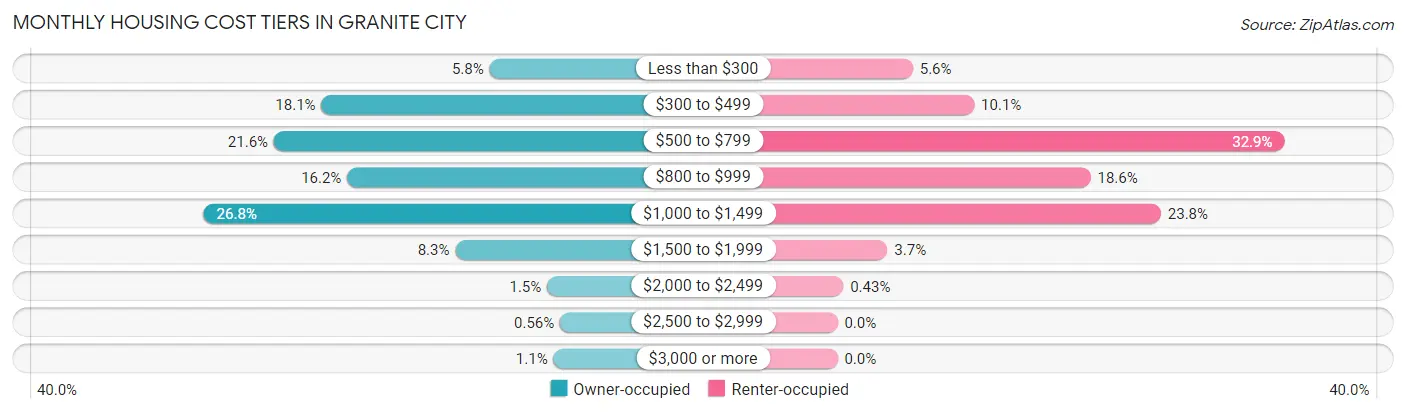
| Monthly Cost | Owner-occupied | Renter-occupied |
| Less than $300 | 451 (5.8%) | 193 (5.6%) |
| $300 to $499 | 1,420 (18.1%) | 350 (10.1%) |
| $500 to $799 | 1,694 (21.6%) | 1,144 (32.9%) |
| $800 to $999 | 1,271 (16.2%) | 648 (18.6%) |
| $1,000 to $1,499 | 2,099 (26.8%) | 828 (23.8%) |
| $1,500 to $1,999 | 648 (8.3%) | 128 (3.7%) |
| $2,000 to $2,499 | 119 (1.5%) | 15 (0.4%) |
| $2,500 to $2,999 | 44 (0.6%) | 0 (0.0%) |
| $3,000 or more | 82 (1.1%) | 0 (0.0%) |
| Total | 7,828 (100.0%) | 3,476 (100.0%) |
Physical Housing Characteristics in Granite City
Housing Structures in Granite City
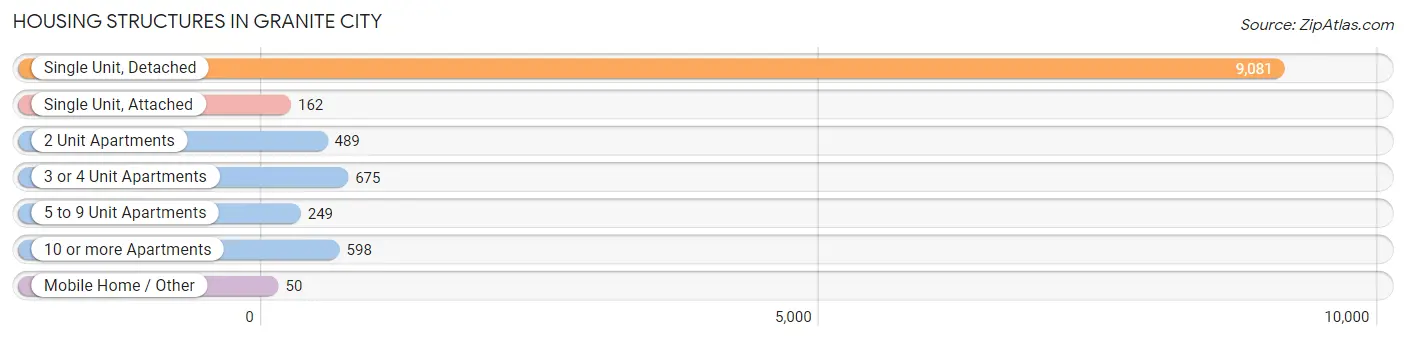
| Structure Type | # Housing Units | % Housing Units |
| Single Unit, Detached | 9,081 | 80.3% |
| Single Unit, Attached | 162 | 1.4% |
| 2 Unit Apartments | 489 | 4.3% |
| 3 or 4 Unit Apartments | 675 | 6.0% |
| 5 to 9 Unit Apartments | 249 | 2.2% |
| 10 or more Apartments | 598 | 5.3% |
| Mobile Home / Other | 50 | 0.4% |
| Total | 11,304 | 100.0% |
Housing Structures by Occupancy in Granite City
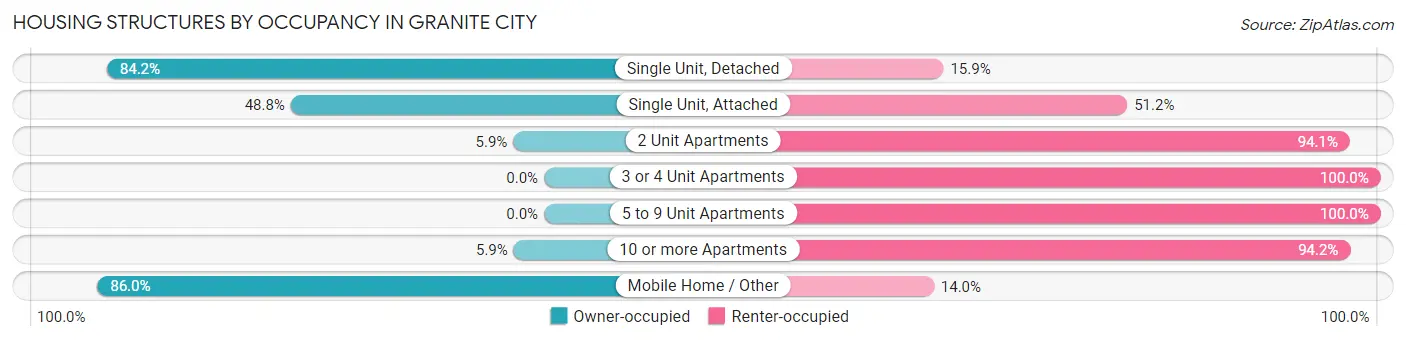
| Structure Type | Owner-occupied | Renter-occupied |
| Single Unit, Detached | 7,642 (84.2%) | 1,439 (15.9%) |
| Single Unit, Attached | 79 (48.8%) | 83 (51.2%) |
| 2 Unit Apartments | 29 (5.9%) | 460 (94.1%) |
| 3 or 4 Unit Apartments | 0 (0.0%) | 675 (100.0%) |
| 5 to 9 Unit Apartments | 0 (0.0%) | 249 (100.0%) |
| 10 or more Apartments | 35 (5.9%) | 563 (94.2%) |
| Mobile Home / Other | 43 (86.0%) | 7 (14.0%) |
| Total | 7,828 (69.3%) | 3,476 (30.7%) |
Housing Structures by Number of Rooms in Granite City
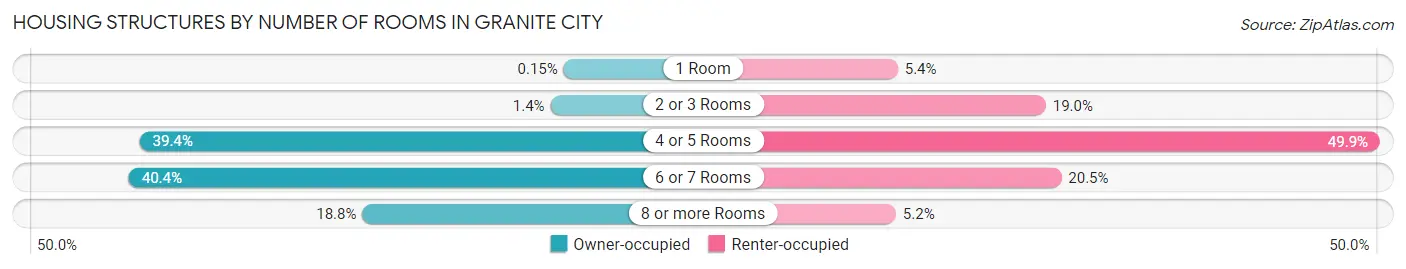
| Number of Rooms | Owner-occupied | Renter-occupied |
| 1 Room | 12 (0.2%) | 186 (5.3%) |
| 2 or 3 Rooms | 107 (1.4%) | 662 (19.0%) |
| 4 or 5 Rooms | 3,081 (39.4%) | 1,736 (49.9%) |
| 6 or 7 Rooms | 3,159 (40.4%) | 712 (20.5%) |
| 8 or more Rooms | 1,469 (18.8%) | 180 (5.2%) |
| Total | 7,828 (100.0%) | 3,476 (100.0%) |
Housing Structure by Heating Type in Granite City
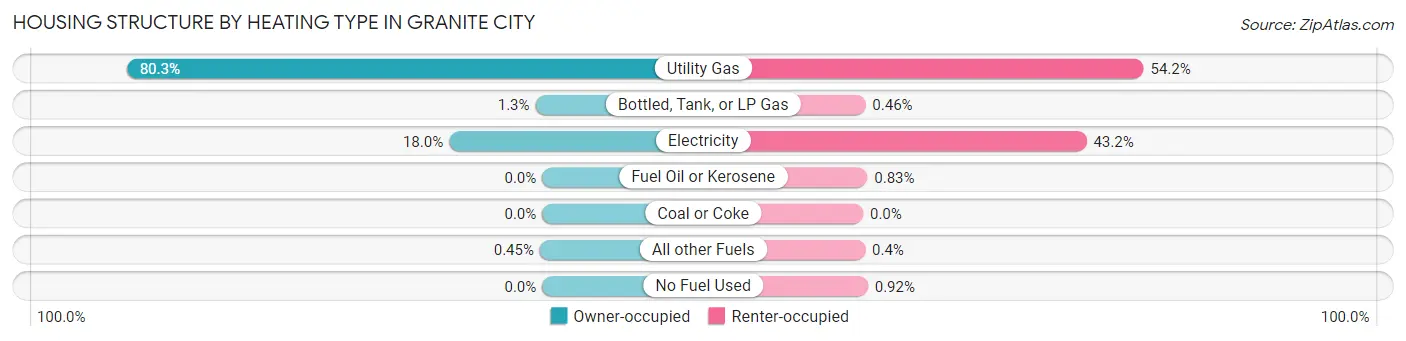
| Heating Type | Owner-occupied | Renter-occupied |
| Utility Gas | 6,283 (80.3%) | 1,884 (54.2%) |
| Bottled, Tank, or LP Gas | 102 (1.3%) | 16 (0.5%) |
| Electricity | 1,408 (18.0%) | 1,501 (43.2%) |
| Fuel Oil or Kerosene | 0 (0.0%) | 29 (0.8%) |
| Coal or Coke | 0 (0.0%) | 0 (0.0%) |
| All other Fuels | 35 (0.4%) | 14 (0.4%) |
| No Fuel Used | 0 (0.0%) | 32 (0.9%) |
| Total | 7,828 (100.0%) | 3,476 (100.0%) |
Household Vehicle Usage in Granite City
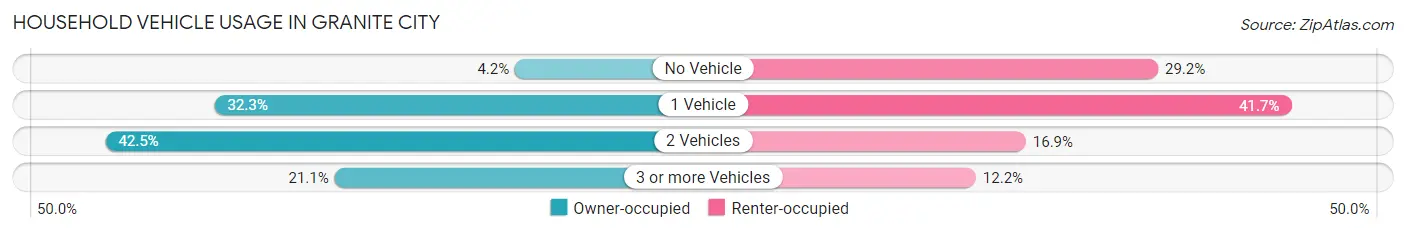
| Vehicles per Household | Owner-occupied | Renter-occupied |
| No Vehicle | 330 (4.2%) | 1,016 (29.2%) |
| 1 Vehicle | 2,526 (32.3%) | 1,448 (41.7%) |
| 2 Vehicles | 3,323 (42.4%) | 587 (16.9%) |
| 3 or more Vehicles | 1,649 (21.1%) | 425 (12.2%) |
| Total | 7,828 (100.0%) | 3,476 (100.0%) |
Real Estate & Mortgages in Granite City
Real Estate and Mortgage Overview in Granite City
| Characteristic | Without Mortgage | With Mortgage |
| Housing Units | 3,090 | 4,738 |
| Median Property Value | $90,800 | $98,300 |
| Median Household Income | $56,358 | $523 |
| Monthly Housing Costs | $477 | $82 |
| Real Estate Taxes | $1,743 | $197 |
Property Value by Mortgage Status in Granite City
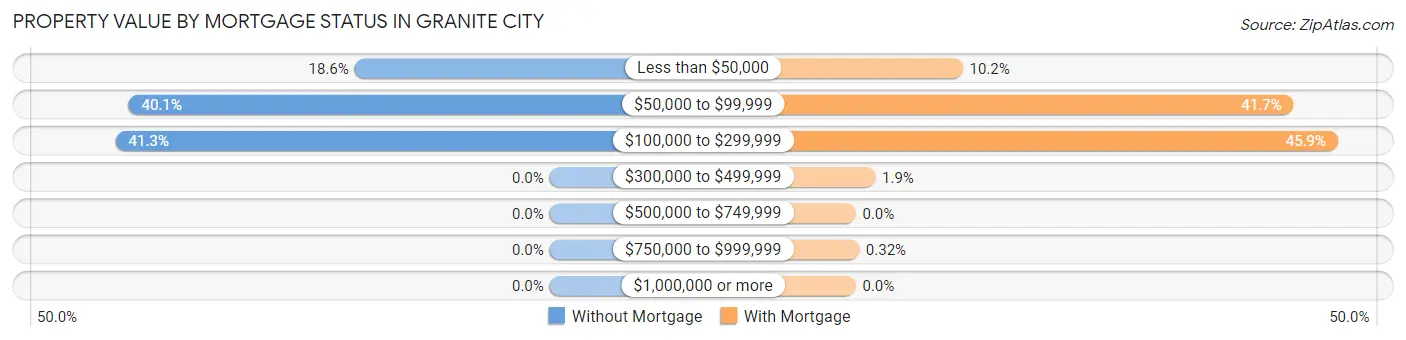
| Property Value | Without Mortgage | With Mortgage |
| Less than $50,000 | 574 (18.6%) | 483 (10.2%) |
| $50,000 to $99,999 | 1,239 (40.1%) | 1,976 (41.7%) |
| $100,000 to $299,999 | 1,277 (41.3%) | 2,176 (45.9%) |
| $300,000 to $499,999 | 0 (0.0%) | 88 (1.9%) |
| $500,000 to $749,999 | 0 (0.0%) | 0 (0.0%) |
| $750,000 to $999,999 | 0 (0.0%) | 15 (0.3%) |
| $1,000,000 or more | 0 (0.0%) | 0 (0.0%) |
| Total | 3,090 (100.0%) | 4,738 (100.0%) |
Household Income by Mortgage Status in Granite City
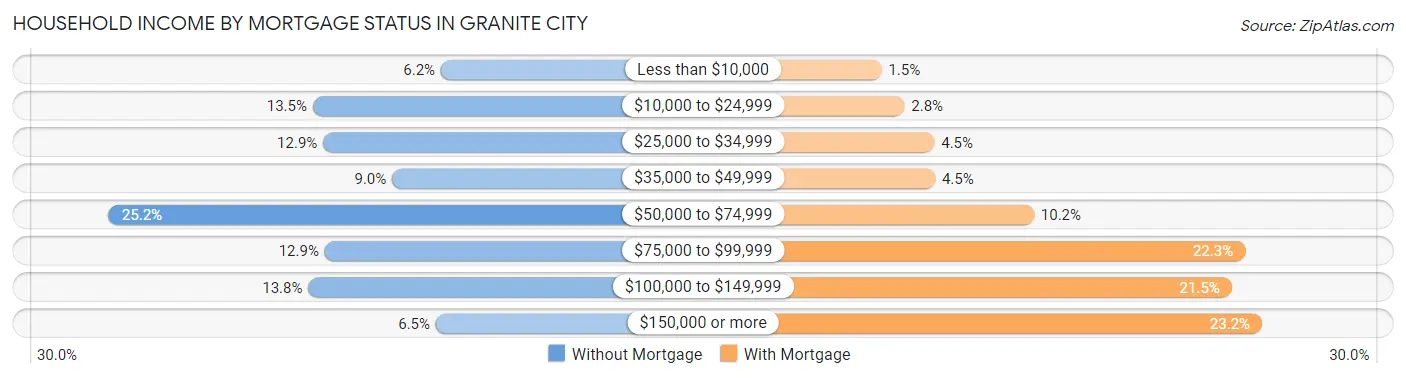
| Household Income | Without Mortgage | With Mortgage |
| Less than $10,000 | 192 (6.2%) | 70 (1.5%) |
| $10,000 to $24,999 | 418 (13.5%) | 132 (2.8%) |
| $25,000 to $34,999 | 400 (12.9%) | 213 (4.5%) |
| $35,000 to $49,999 | 278 (9.0%) | 215 (4.5%) |
| $50,000 to $74,999 | 778 (25.2%) | 483 (10.2%) |
| $75,000 to $99,999 | 397 (12.9%) | 1,054 (22.3%) |
| $100,000 to $149,999 | 426 (13.8%) | 1,018 (21.5%) |
| $150,000 or more | 201 (6.5%) | 1,100 (23.2%) |
| Total | 3,090 (100.0%) | 4,738 (100.0%) |
Property Value to Household Income Ratio in Granite City
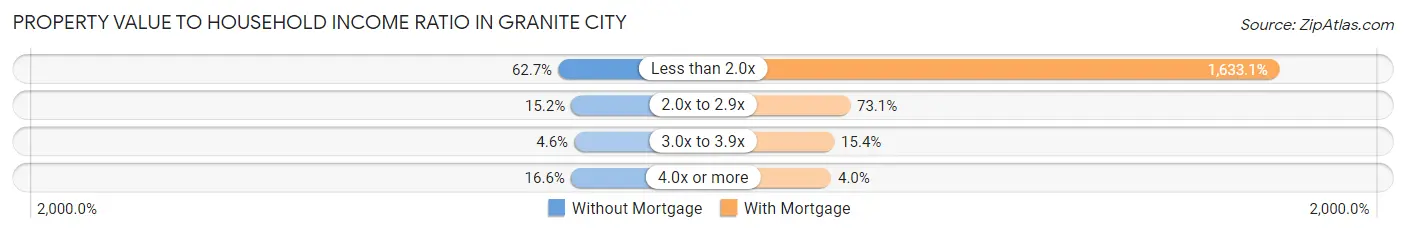
| Value-to-Income Ratio | Without Mortgage | With Mortgage |
| Less than 2.0x | 1,938 (62.7%) | 77,378 (1,633.1%) |
| 2.0x to 2.9x | 469 (15.2%) | 3,462 (73.1%) |
| 3.0x to 3.9x | 142 (4.6%) | 728 (15.4%) |
| 4.0x or more | 512 (16.6%) | 189 (4.0%) |
| Total | 3,090 (100.0%) | 4,738 (100.0%) |
Real Estate Taxes by Mortgage Status in Granite City
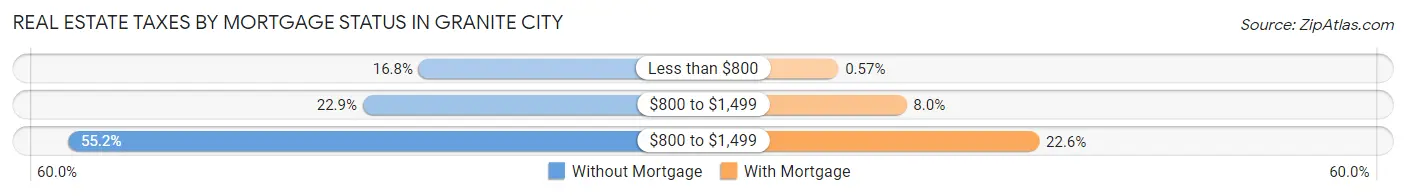
| Property Taxes | Without Mortgage | With Mortgage |
| Less than $800 | 519 (16.8%) | 27 (0.6%) |
| $800 to $1,499 | 709 (22.9%) | 381 (8.0%) |
| $800 to $1,499 | 1,707 (55.2%) | 1,070 (22.6%) |
| Total | 3,090 (100.0%) | 4,738 (100.0%) |
Health & Disability in Granite City
Health Insurance Coverage by Age in Granite City
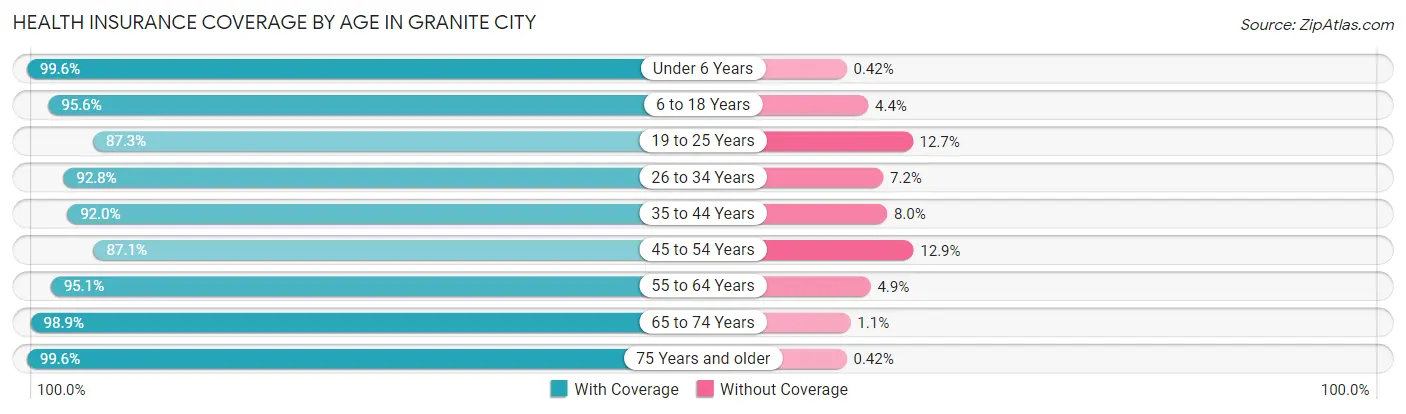
| Age Bracket | With Coverage | Without Coverage |
| Under 6 Years | 1,678 (99.6%) | 7 (0.4%) |
| 6 to 18 Years | 4,308 (95.6%) | 200 (4.4%) |
| 19 to 25 Years | 1,652 (87.3%) | 241 (12.7%) |
| 26 to 34 Years | 3,433 (92.8%) | 268 (7.2%) |
| 35 to 44 Years | 3,399 (92.0%) | 294 (8.0%) |
| 45 to 54 Years | 2,691 (87.1%) | 398 (12.9%) |
| 55 to 64 Years | 3,628 (95.1%) | 186 (4.9%) |
| 65 to 74 Years | 2,698 (98.9%) | 31 (1.1%) |
| 75 Years and older | 1,662 (99.6%) | 7 (0.4%) |
| Total | 25,149 (93.9%) | 1,632 (6.1%) |
Health Insurance Coverage by Citizenship Status in Granite City
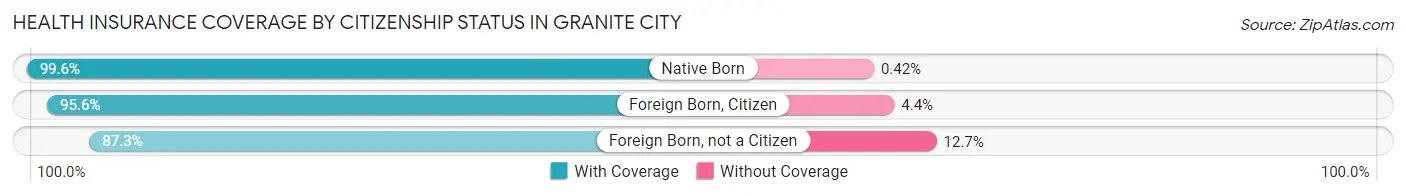
| Citizenship Status | With Coverage | Without Coverage |
| Native Born | 1,678 (99.6%) | 7 (0.4%) |
| Foreign Born, Citizen | 4,308 (95.6%) | 200 (4.4%) |
| Foreign Born, not a Citizen | 1,652 (87.3%) | 241 (12.7%) |
Health Insurance Coverage by Household Income in Granite City
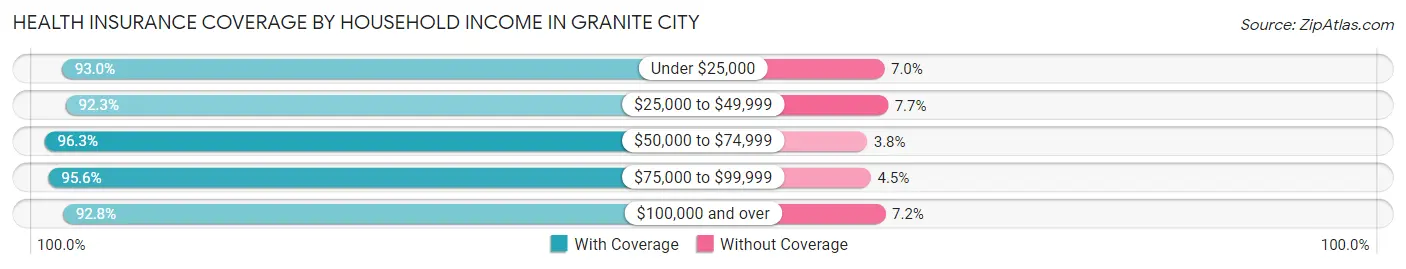
| Household Income | With Coverage | Without Coverage |
| Under $25,000 | 4,396 (93.0%) | 330 (7.0%) |
| $25,000 to $49,999 | 3,696 (92.3%) | 307 (7.7%) |
| $50,000 to $74,999 | 5,003 (96.3%) | 195 (3.7%) |
| $75,000 to $99,999 | 4,166 (95.6%) | 194 (4.4%) |
| $100,000 and over | 7,840 (92.8%) | 606 (7.2%) |
Public vs Private Health Insurance Coverage by Age in Granite City
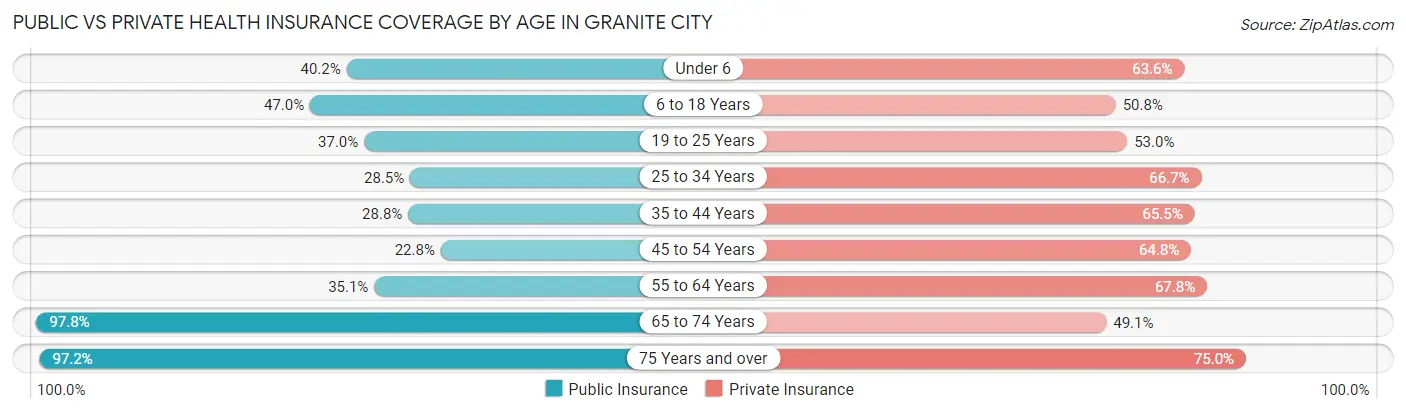
| Age Bracket | Public Insurance | Private Insurance |
| Under 6 | 678 (40.2%) | 1,071 (63.6%) |
| 6 to 18 Years | 2,119 (47.0%) | 2,292 (50.8%) |
| 19 to 25 Years | 700 (37.0%) | 1,003 (53.0%) |
| 25 to 34 Years | 1,053 (28.4%) | 2,470 (66.7%) |
| 35 to 44 Years | 1,064 (28.8%) | 2,418 (65.5%) |
| 45 to 54 Years | 703 (22.8%) | 2,003 (64.8%) |
| 55 to 64 Years | 1,339 (35.1%) | 2,585 (67.8%) |
| 65 to 74 Years | 2,669 (97.8%) | 1,340 (49.1%) |
| 75 Years and over | 1,623 (97.2%) | 1,252 (75.0%) |
| Total | 11,948 (44.6%) | 16,434 (61.4%) |
Disability Status by Sex by Age in Granite City
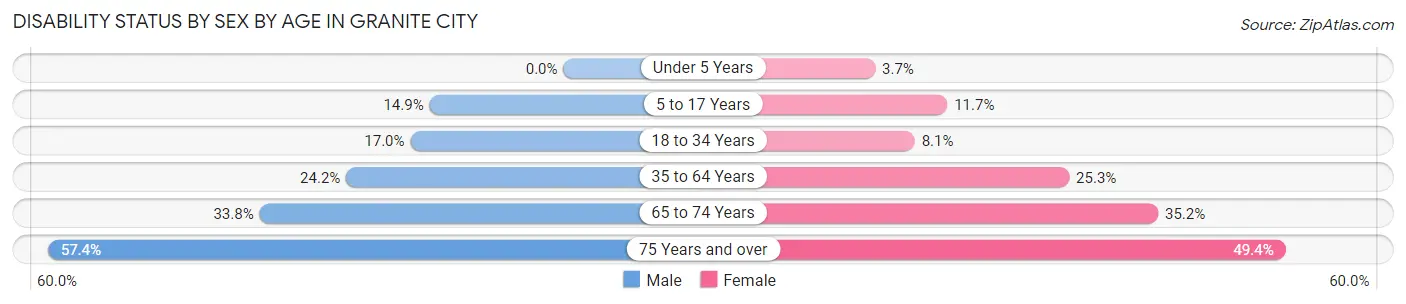
| Age Bracket | Male | Female |
| Under 5 Years | 0 (0.0%) | 25 (3.7%) |
| 5 to 17 Years | 376 (14.9%) | 227 (11.7%) |
| 18 to 34 Years | 499 (17.0%) | 250 (8.1%) |
| 35 to 64 Years | 1,337 (24.2%) | 1,283 (25.3%) |
| 65 to 74 Years | 398 (33.8%) | 547 (35.2%) |
| 75 Years and over | 426 (57.4%) | 458 (49.4%) |
Disability Class by Sex by Age in Granite City
Disability Class: Hearing Difficulty
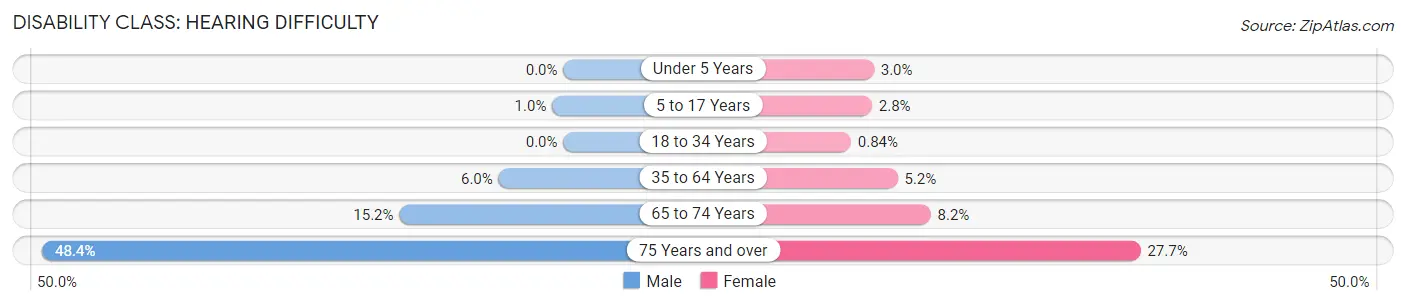
| Age Bracket | Male | Female |
| Under 5 Years | 0 (0.0%) | 20 (3.0%) |
| 5 to 17 Years | 26 (1.0%) | 54 (2.8%) |
| 18 to 34 Years | 0 (0.0%) | 26 (0.8%) |
| 35 to 64 Years | 332 (6.0%) | 262 (5.2%) |
| 65 to 74 Years | 179 (15.2%) | 128 (8.2%) |
| 75 Years and over | 359 (48.4%) | 257 (27.7%) |
Disability Class: Vision Difficulty
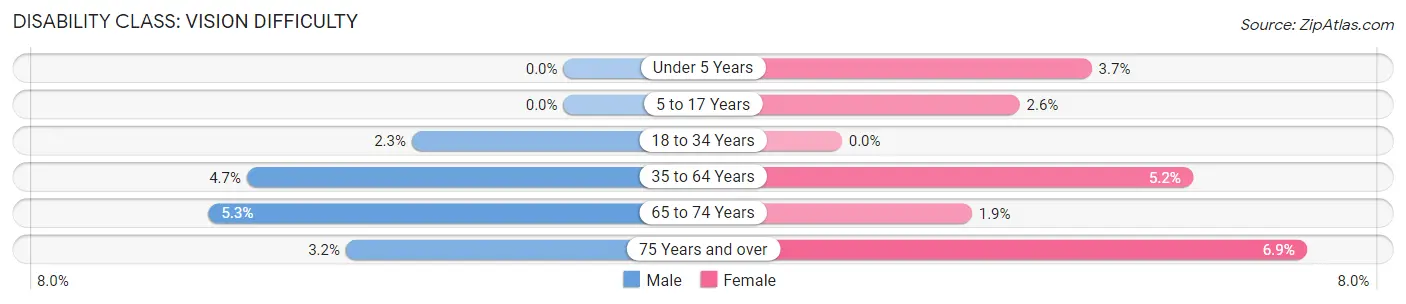
| Age Bracket | Male | Female |
| Under 5 Years | 0 (0.0%) | 25 (3.7%) |
| 5 to 17 Years | 0 (0.0%) | 51 (2.6%) |
| 18 to 34 Years | 66 (2.2%) | 0 (0.0%) |
| 35 to 64 Years | 260 (4.7%) | 264 (5.2%) |
| 65 to 74 Years | 62 (5.3%) | 30 (1.9%) |
| 75 Years and over | 24 (3.2%) | 64 (6.9%) |
Disability Class: Cognitive Difficulty
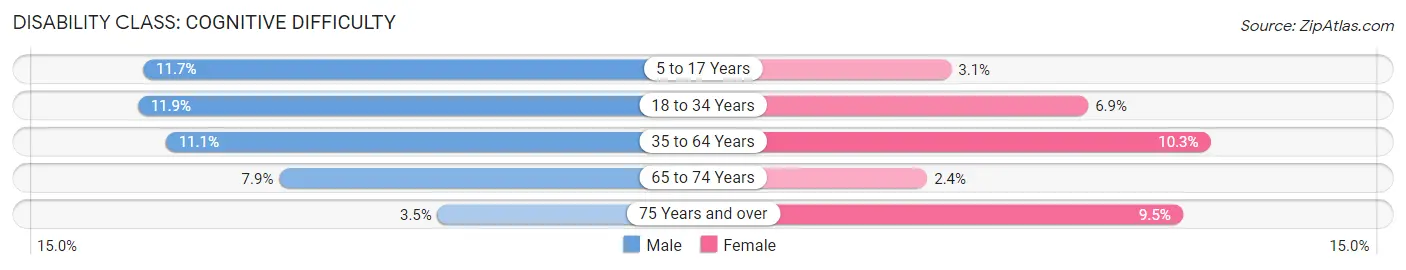
| Age Bracket | Male | Female |
| 5 to 17 Years | 295 (11.7%) | 59 (3.0%) |
| 18 to 34 Years | 347 (11.8%) | 211 (6.9%) |
| 35 to 64 Years | 612 (11.1%) | 520 (10.3%) |
| 65 to 74 Years | 93 (7.9%) | 37 (2.4%) |
| 75 Years and over | 26 (3.5%) | 88 (9.5%) |
Disability Class: Ambulatory Difficulty
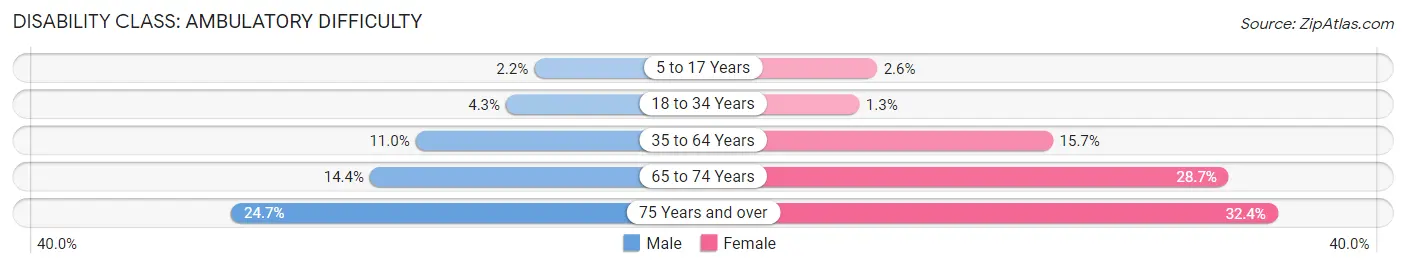
| Age Bracket | Male | Female |
| 5 to 17 Years | 55 (2.2%) | 50 (2.6%) |
| 18 to 34 Years | 125 (4.3%) | 39 (1.3%) |
| 35 to 64 Years | 607 (11.0%) | 793 (15.7%) |
| 65 to 74 Years | 169 (14.4%) | 446 (28.7%) |
| 75 Years and over | 183 (24.7%) | 300 (32.4%) |
Disability Class: Self-Care Difficulty
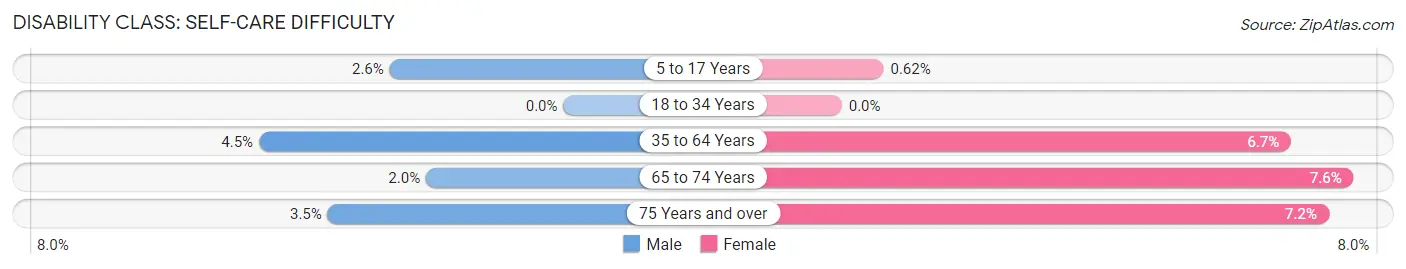
| Age Bracket | Male | Female |
| 5 to 17 Years | 65 (2.6%) | 12 (0.6%) |
| 18 to 34 Years | 0 (0.0%) | 0 (0.0%) |
| 35 to 64 Years | 250 (4.5%) | 338 (6.7%) |
| 65 to 74 Years | 24 (2.0%) | 118 (7.6%) |
| 75 Years and over | 26 (3.5%) | 67 (7.2%) |
Technology Access in Granite City
Computing Device Access in Granite City
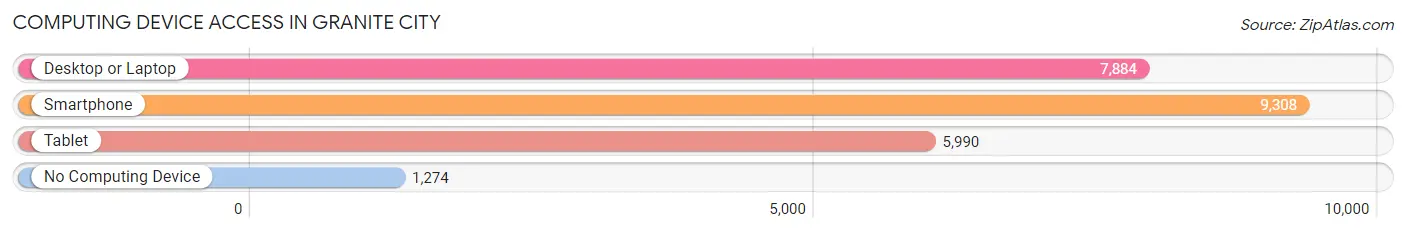
| Device Type | # Households | % Households |
| Desktop or Laptop | 7,884 | 69.8% |
| Smartphone | 9,308 | 82.3% |
| Tablet | 5,990 | 53.0% |
| No Computing Device | 1,274 | 11.3% |
| Total | 11,304 | 100.0% |
Internet Access in Granite City
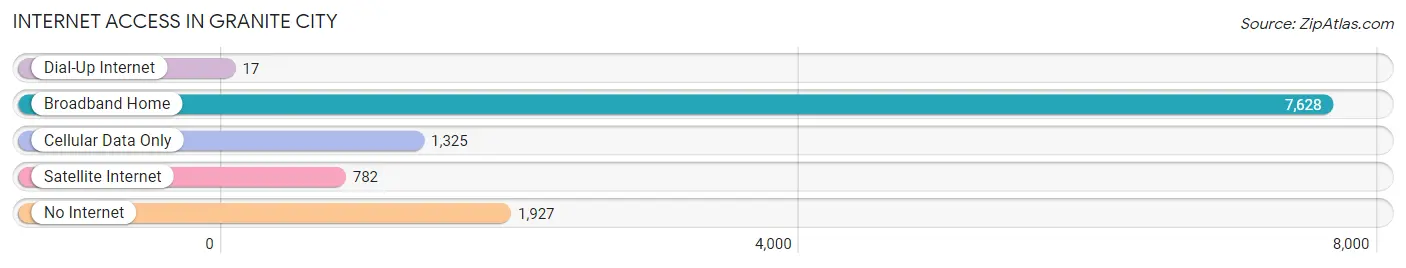
| Internet Type | # Households | % Households |
| Dial-Up Internet | 17 | 0.2% |
| Broadband Home | 7,628 | 67.5% |
| Cellular Data Only | 1,325 | 11.7% |
| Satellite Internet | 782 | 6.9% |
| No Internet | 1,927 | 17.1% |
| Total | 11,304 | 100.0% |
Granite City Summary
Granite City, Illinois is a city located in Madison County, Illinois, United States, part of the Greater St. Louis metropolitan area. It is located on the Mississippi River, just east of St. Louis, Missouri. The population was 29,849 at the 2010 census, making it the second largest city in the Metro East region of the St. Louis Metropolitan Area.
History
Granite City was founded in 1896 by German immigrants who named it after the granite quarries that were located in the area. The city was incorporated in 1900 and grew rapidly due to the steel industry. The city was home to the National Steel Car Company, which produced railroad cars, and the Granite City Steel Company, which produced steel products. The city was also home to the Granite City Brewing Company, which produced beer from 1896 to 1933.
In the early 20th century, Granite City was a major industrial center and was home to many immigrants from Europe. The city was also home to a large African American population, which was concentrated in the city's north end.
Geography
Granite City is located at 38°41'25" North, 90°10'17" West (38.690278, -90.171389). According to the 2010 census, the city has a total area of 16.1 square miles (41.7 km2), of which 15.9 square miles (41.2 km2) is land and 0.2 square miles (0.5 km2) is water.
Economy
Granite City is home to several major industries, including steel production, manufacturing, and transportation. The city is home to the National Steel Car Company, which produces railroad cars, and the Granite City Steel Company, which produces steel products. The city is also home to several other manufacturing companies, including the Granite City Tool Company, which produces tools and machinery, and the Granite City Foundry, which produces castings.
Granite City is also home to several transportation companies, including the Granite City Transit Company, which provides bus service to the city, and the Granite City Railroad, which provides freight service to the city.
Demographics
As of the 2010 census, there were 29,849 people, 11,945 households, and 7,845 families residing in the city. The population density was 1,876.3 people per square mile (724.2/km2). There were 12,845 housing units at an average density of 798.3 per square mile (308.3/km2). The racial makeup of the city was 87.2% White, 8.7% African American, 0.3% Native American, 0.7% Asian, 0.1% Pacific Islander, 1.2% from other races, and 2.0% from two or more races. Hispanic or Latino of any race were 3.3% of the population.
There were 11,945 households, out of which 30.2% had children under the age of 18 living with them, 44.2% were married couples living together, 15.3% had a female householder with no husband present, and 35.7% were non-families. 30.2% of all households were made up of individuals, and 11.7% had someone living alone who was 65 years of age or older. The average household size was 2.45 and the average family size was 3.04.
In the city, the population was spread out, with 24.7% under the age of 18, 8.7% from 18 to 24, 28.7% from 25 to 44, 22.7% from 45 to 64, and 15.2% who were 65 years of age or older. The median age was 37 years. For every 100 females, there were 93.2 males. For every 100 females age 18 and over, there were 88.7 males.
The median income for a household in the city was $37,890, and the median income for a family was $45,945. Males had a median income of $37,890 versus $27,890 for females. The per capita income for the city was $19,890. About 10.2% of families and 12.7% of the population were below the poverty line, including 17.2% of those under age 18 and 8.2% of those age 65 or over.
Common Questions
What is the Total Population of Granite City?
Total Population of Granite City is 27,026.
What is the Total Male Population of Granite City?
Total Male Population of Granite City is 13,593.
What is the Total Female Population of Granite City?
Total Female Population of Granite City is 13,433.
What is the Ratio of Males per 100 Females in Granite City?
There are 101.19 Males per 100 Females in Granite City.
What is the Ratio of Females per 100 Males in Granite City?
There are 98.82 Females per 100 Males in Granite City.
What is the Median Population Age in Granite City?
Median Population Age in Granite City is 38.8 Years.
What is the Average Family Size in Granite City
Average Family Size in Granite City is 3.0 People.
What is the Average Household Size in Granite City
Average Household Size in Granite City is 2.4 People.
What is Per Capita Income in Granite City?
Per Capita income in Granite City is $29,239.
What is the Median Family Income in Granite City?
Median Family Income in Granite City is $75,250.
What is the Median Household income in Granite City?
Median Household Income in Granite City is $58,681.
What is Income or Wage Gap in Granite City?
Income or Wage Gap in Granite City is 23.9%.
Women in Granite City earn 76.1 cents for every dollar earned by a man.
What is Family Income Deficit in Granite City?
Family Income Deficit in Granite City is $12,229.
Families that are below poverty line in Granite City earn $12,229 less on average than the poverty threshold level.
What is Inequality or Gini Index in Granite City?
Inequality or Gini Index in Granite City is 0.42.
How Large is the Labor Force in Granite City?
There are 13,418 People in the Labor Forcein in Granite City.
What is the Percentage of People in the Labor Force in Granite City?
61.0% of People are in the Labor Force in Granite City.
What is the Unemployment Rate in Granite City?
Unemployment Rate in Granite City is 8.0%.