Mahomet, IL
Mahomet Map
Mahomet Overview
9,545
TOTAL POPULATION
4,733
MALE POPULATION
4,812
FEMALE POPULATION
98.36
MALES / 100 FEMALES
101.67
FEMALES / 100 MALES
37.1
MEDIAN AGE
3.4
AVG FAMILY SIZE
3.0
AVG HOUSEHOLD SIZE
$47,023
PER CAPITA INCOME
$140,435
AVG FAMILY INCOME
$114,083
AVG HOUSEHOLD INCOME
42.5%
WAGE / INCOME GAP [ % ]
57.5¢/ $1
WAGE / INCOME GAP [ $ ]
0.37
INEQUALITY / GINI INDEX
4,794
LABOR FORCE [ PEOPLE ]
69.9%
PERCENT IN LABOR FORCE
1.0%
UNEMPLOYMENT RATE
Mahomet Zip Codes
Mahomet Area Codes
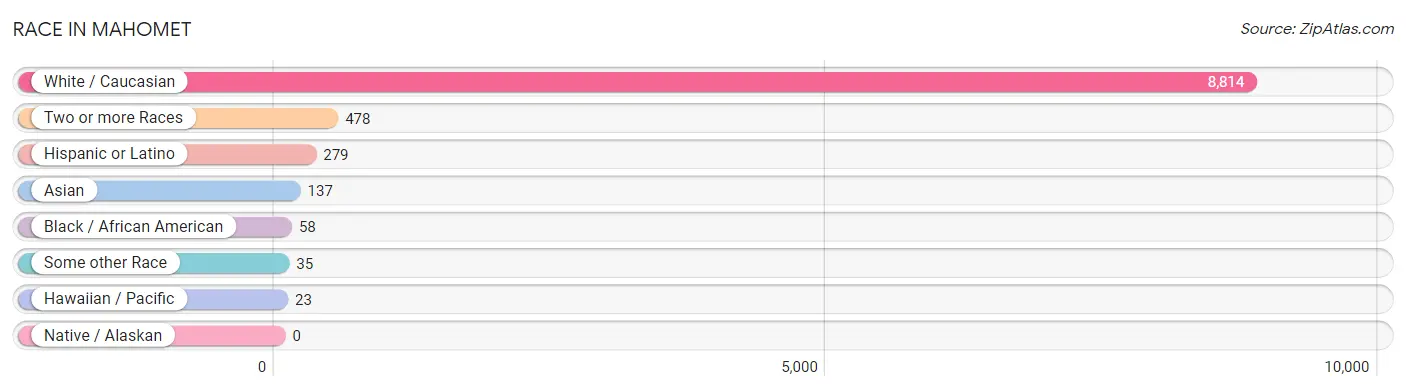
Race in Mahomet
The most populous races in Mahomet are White / Caucasian (8,814 | 92.3%), Two or more Races (478 | 5.0%), and Hispanic or Latino (279 | 2.9%).
| Race | # Population | % Population |
| Asian | 137 | 1.4% |
| Black / African American | 58 | 0.6% |
| Hawaiian / Pacific | 23 | 0.2% |
| Hispanic or Latino | 279 | 2.9% |
| Native / Alaskan | 0 | 0.0% |
| White / Caucasian | 8,814 | 92.3% |
| Two or more Races | 478 | 5.0% |
| Some other Race | 35 | 0.4% |
| Total | 9,545 | 100.0% |
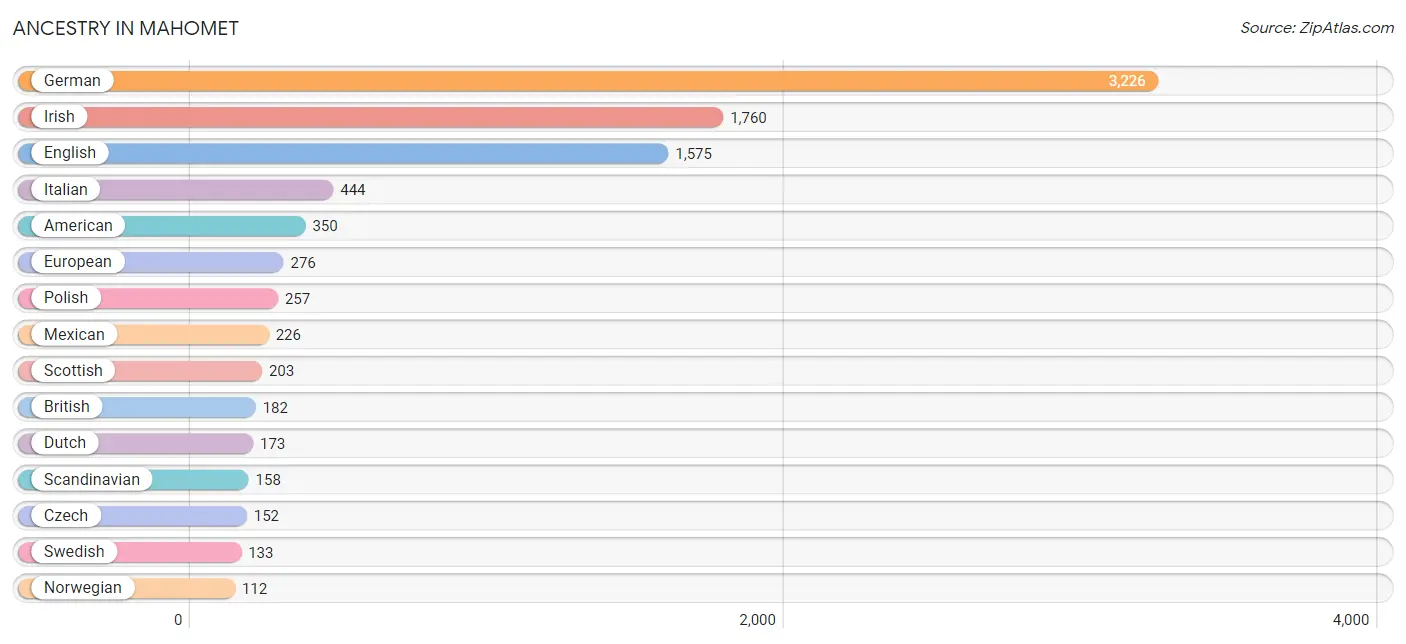
Ancestry in Mahomet
The most populous ancestries reported in Mahomet are German (3,226 | 33.8%), Irish (1,760 | 18.4%), English (1,575 | 16.5%), Italian (444 | 4.6%), and American (350 | 3.7%), together accounting for 77.1% of all Mahomet residents.
| Ancestry | # Population | % Population |
| American | 350 | 3.7% |
| Arab | 30 | 0.3% |
| Austrian | 30 | 0.3% |
| Belgian | 36 | 0.4% |
| Bhutanese | 67 | 0.7% |
| British | 182 | 1.9% |
| Central American | 53 | 0.6% |
| Cherokee | 11 | 0.1% |
| Chickasaw | 24 | 0.3% |
| Costa Rican | 30 | 0.3% |
| Czech | 152 | 1.6% |
| Danish | 110 | 1.1% |
| Dutch | 173 | 1.8% |
| Eastern European | 19 | 0.2% |
| English | 1,575 | 16.5% |
| European | 276 | 2.9% |
| French | 108 | 1.1% |
| French Canadian | 26 | 0.3% |
| German | 3,226 | 33.8% |
| Greek | 54 | 0.6% |
| Guamanian / Chamorro | 23 | 0.2% |
| Guatemalan | 23 | 0.2% |
| Hungarian | 17 | 0.2% |
| Indian (Asian) | 103 | 1.1% |
| Indonesian | 87 | 0.9% |
| Irish | 1,760 | 18.4% |
| Italian | 444 | 4.6% |
| Lebanese | 30 | 0.3% |
| Lithuanian | 13 | 0.1% |
| Mexican | 226 | 2.4% |
| Northern European | 80 | 0.8% |
| Norwegian | 112 | 1.2% |
| Polish | 257 | 2.7% |
| Russian | 87 | 0.9% |
| Scandinavian | 158 | 1.7% |
| Scotch-Irish | 96 | 1.0% |
| Scottish | 203 | 2.1% |
| Slovak | 13 | 0.1% |
| Swedish | 133 | 1.4% |
| Swiss | 28 | 0.3% |
| Welsh | 46 | 0.5% | View All 41 Rows |
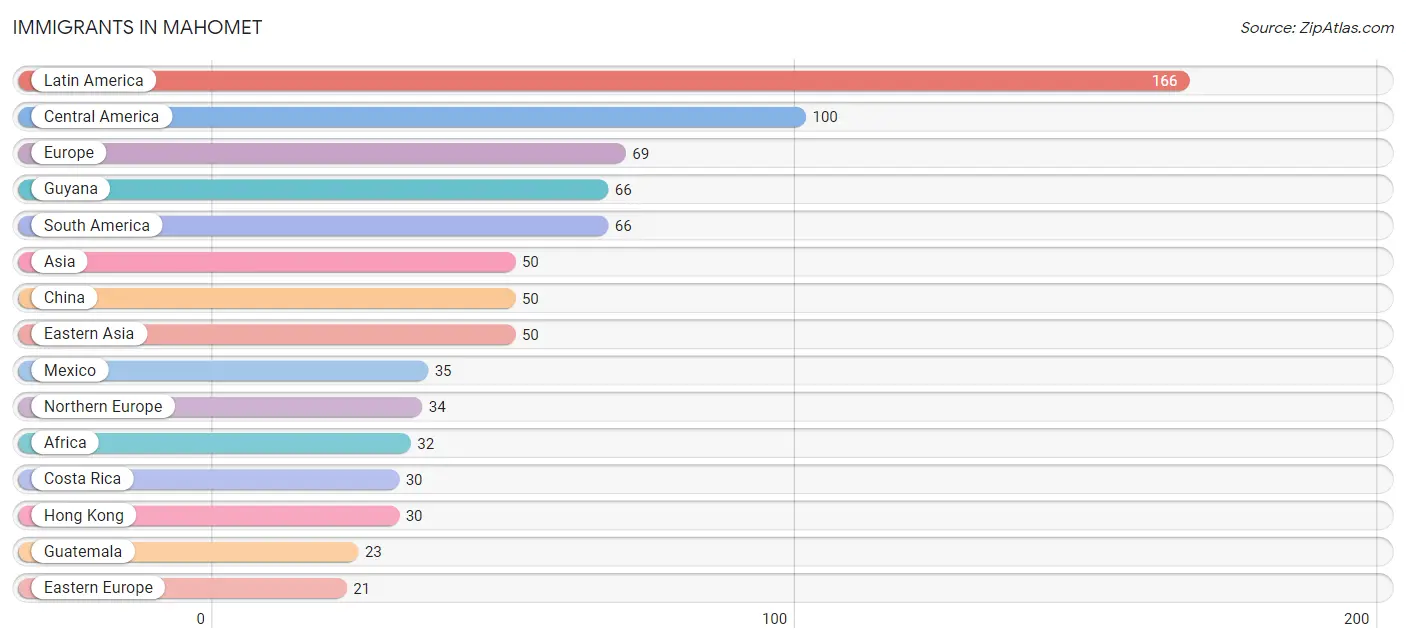
Immigrants in Mahomet
The most numerous immigrant groups reported in Mahomet came from Latin America (166 | 1.7%), Central America (100 | 1.1%), Europe (69 | 0.7%), Guyana (66 | 0.7%), and South America (66 | 0.7%), together accounting for 4.9% of all Mahomet residents.
| Immigration Origin | # Population | % Population |
| Africa | 32 | 0.3% |
| Asia | 50 | 0.5% |
| Austria | 14 | 0.2% |
| Belize | 12 | 0.1% |
| Canada | 12 | 0.1% |
| Central America | 100 | 1.1% |
| China | 50 | 0.5% |
| Costa Rica | 30 | 0.3% |
| Eastern Asia | 50 | 0.5% |
| Eastern Europe | 21 | 0.2% |
| Europe | 69 | 0.7% |
| Guatemala | 23 | 0.2% |
| Guyana | 66 | 0.7% |
| Hong Kong | 30 | 0.3% |
| Latin America | 166 | 1.7% |
| Mexico | 35 | 0.4% |
| Nigeria | 19 | 0.2% |
| Northern Europe | 34 | 0.4% |
| Russia | 21 | 0.2% |
| South Africa | 13 | 0.1% |
| South America | 66 | 0.7% |
| Western Africa | 19 | 0.2% |
| Western Europe | 14 | 0.2% | View All 23 Rows |
Sex and Age in Mahomet
Sex and Age in Mahomet
The most populous age groups in Mahomet are 40 to 44 Years (601 | 12.7%) for men and 5 to 9 Years (527 | 11.0%) for women.
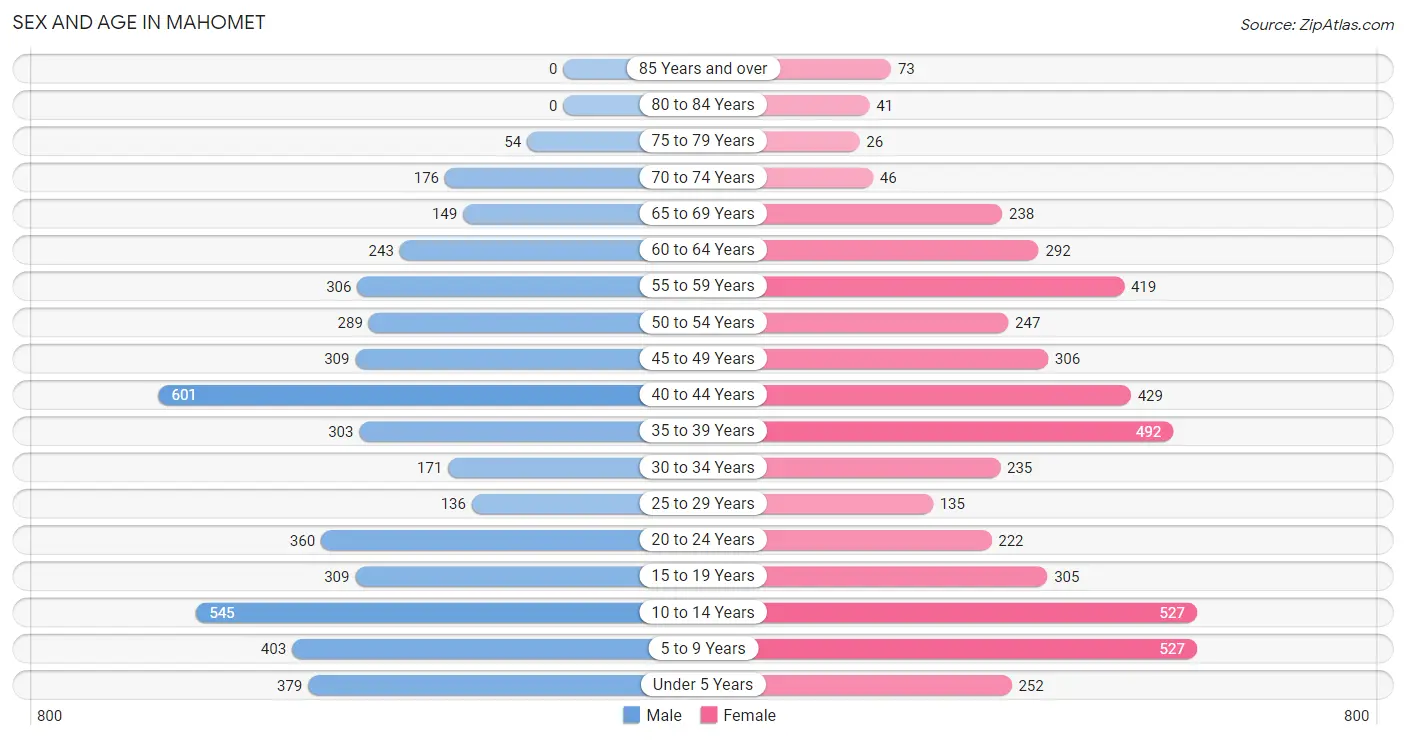
| Age Bracket | Male | Female |
| Under 5 Years | 379 (8.0%) | 252 (5.2%) |
| 5 to 9 Years | 403 (8.5%) | 527 (11.0%) |
| 10 to 14 Years | 545 (11.5%) | 527 (11.0%) |
| 15 to 19 Years | 309 (6.5%) | 305 (6.3%) |
| 20 to 24 Years | 360 (7.6%) | 222 (4.6%) |
| 25 to 29 Years | 136 (2.9%) | 135 (2.8%) |
| 30 to 34 Years | 171 (3.6%) | 235 (4.9%) |
| 35 to 39 Years | 303 (6.4%) | 492 (10.2%) |
| 40 to 44 Years | 601 (12.7%) | 429 (8.9%) |
| 45 to 49 Years | 309 (6.5%) | 306 (6.4%) |
| 50 to 54 Years | 289 (6.1%) | 247 (5.1%) |
| 55 to 59 Years | 306 (6.5%) | 419 (8.7%) |
| 60 to 64 Years | 243 (5.1%) | 292 (6.1%) |
| 65 to 69 Years | 149 (3.2%) | 238 (5.0%) |
| 70 to 74 Years | 176 (3.7%) | 46 (1.0%) |
| 75 to 79 Years | 54 (1.1%) | 26 (0.5%) |
| 80 to 84 Years | 0 (0.0%) | 41 (0.9%) |
| 85 Years and over | 0 (0.0%) | 73 (1.5%) |
| Total | 4,733 (100.0%) | 4,812 (100.0%) |
Families and Households in Mahomet
Median Family Size in Mahomet
The median family size in Mahomet is 3.42 persons per family, with married-couple families (2,372 | 90.7%) accounting for the largest median family size of 3.46 persons per family. On the other hand, single male/father families (36 | 1.4%) represent the smallest median family size with 1.89 persons per family.
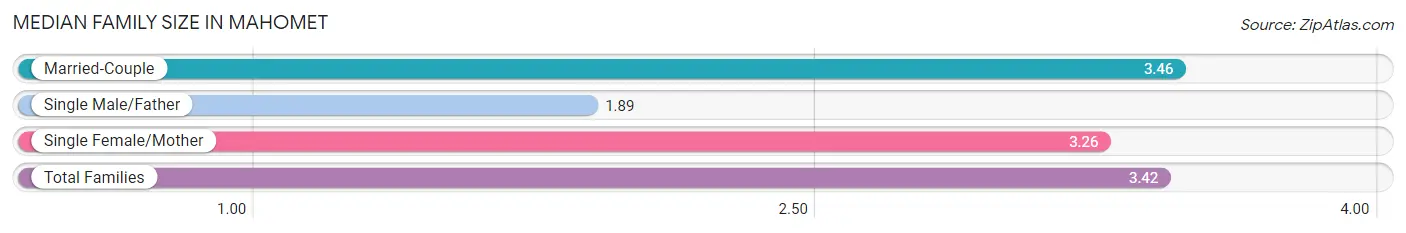
| Family Type | # Families | Family Size |
| Married-Couple | 2,372 (90.7%) | 3.46 |
| Single Male/Father | 36 (1.4%) | 1.89 |
| Single Female/Mother | 207 (7.9%) | 3.26 |
| Total Families | 2,615 (100.0%) | 3.42 |
Median Household Size in Mahomet
The median household size in Mahomet is 3.03 persons per household, with married-couple households (2,372 | 75.3%) accounting for the largest median household size of 3.47 persons per household. non-family households (535 | 17.0%) represent the smallest median household size with 1.04 persons per household.
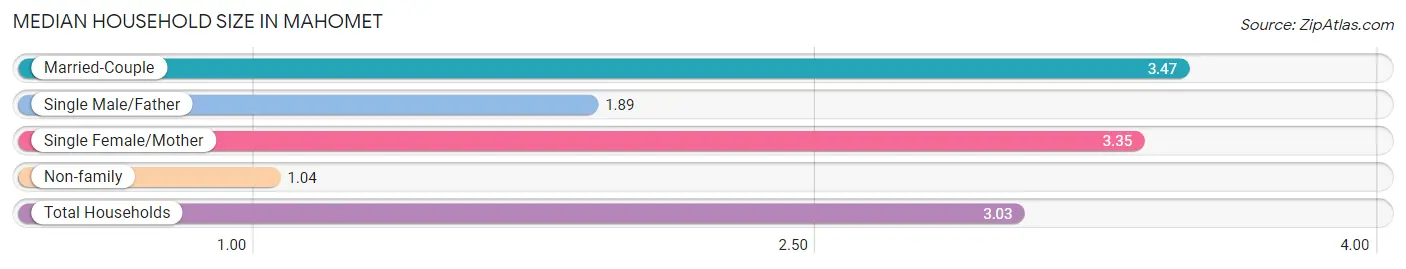
| Household Type | # Households | Household Size |
| Married-Couple | 2,372 (75.3%) | 3.47 |
| Single Male/Father | 36 (1.1%) | 1.89 |
| Single Female/Mother | 207 (6.6%) | 3.35 |
| Non-family | 535 (17.0%) | 1.04 |
| Total Households | 3,150 (100.0%) | 3.03 |
Household Size by Marriage Status in Mahomet
Out of a total of 3,150 households in Mahomet, 2,615 (83.0%) are family households, while 535 (17.0%) are nonfamily households. The most numerous type of family households are 2-person households, comprising 1,050, and the most common type of nonfamily households are 1-person households, comprising 506.
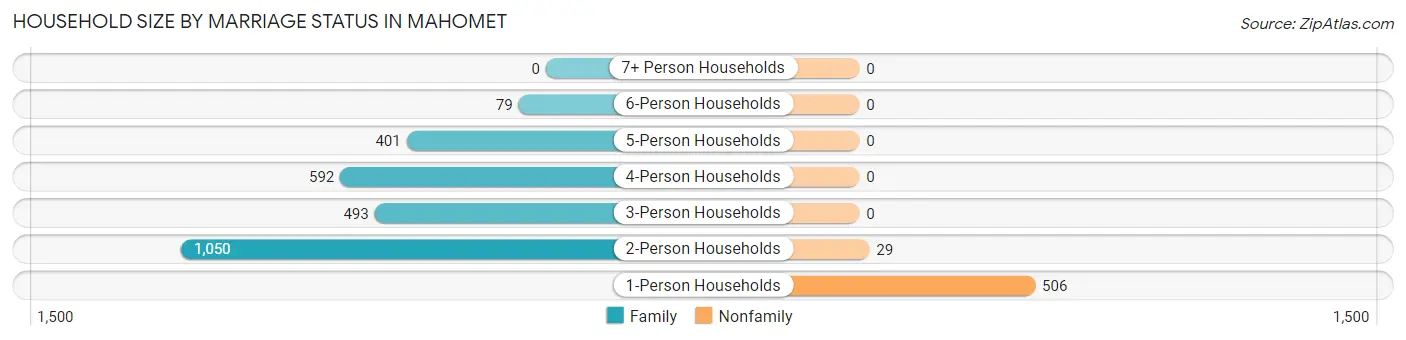
| Household Size | Family Households | Nonfamily Households |
| 1-Person Households | - | 506 (16.1%) |
| 2-Person Households | 1,050 (33.3%) | 29 (0.9%) |
| 3-Person Households | 493 (15.7%) | 0 (0.0%) |
| 4-Person Households | 592 (18.8%) | 0 (0.0%) |
| 5-Person Households | 401 (12.7%) | 0 (0.0%) |
| 6-Person Households | 79 (2.5%) | 0 (0.0%) |
| 7+ Person Households | 0 (0.0%) | 0 (0.0%) |
| Total | 2,615 (83.0%) | 535 (17.0%) |
Female Fertility in Mahomet
Fertility by Age in Mahomet
Average fertility rate in Mahomet is 88.0 births per 1,000 women. Women in the age bracket of 20 to 34 years have the highest fertility rate with 209.0 births per 1,000 women. Women in the age bracket of 20 to 34 years acount for 64.2% of all women with births.
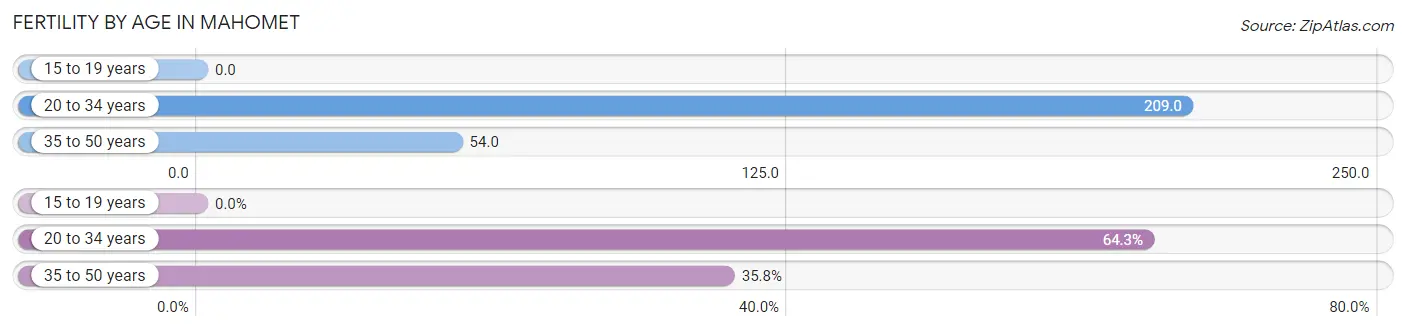
| Age Bracket | Women with Births | Births / 1,000 Women |
| 15 to 19 years | 0 (0.0%) | 0.0 |
| 20 to 34 years | 124 (64.2%) | 209.0 |
| 35 to 50 years | 69 (35.7%) | 54.0 |
| Total | 193 (100.0%) | 88.0 |
Fertility by Age by Marriage Status in Mahomet
68.4% of women with births (193) in Mahomet are married. The highest percentage of unmarried women with births falls into 35 to 50 years age bracket with 88.4% of them unmarried at the time of birth, while the lowest percentage of unmarried women with births belong to 20 to 34 years age bracket with 0.0% of them unmarried.
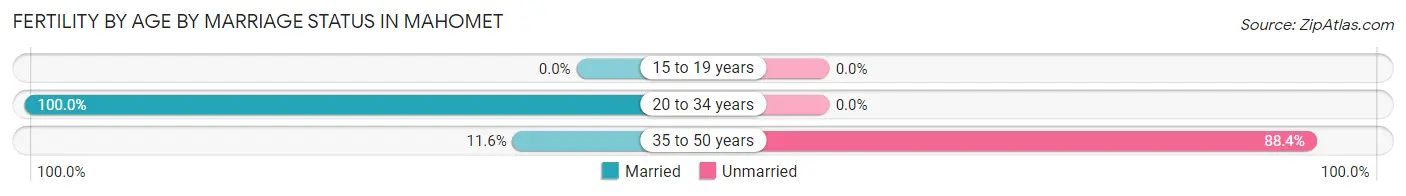
| Age Bracket | Married | Unmarried |
| 15 to 19 years | 0 (0.0%) | 0 (0.0%) |
| 20 to 34 years | 124 (100.0%) | 0 (0.0%) |
| 35 to 50 years | 8 (11.6%) | 61 (88.4%) |
| Total | 132 (68.4%) | 61 (31.6%) |
Fertility by Education in Mahomet
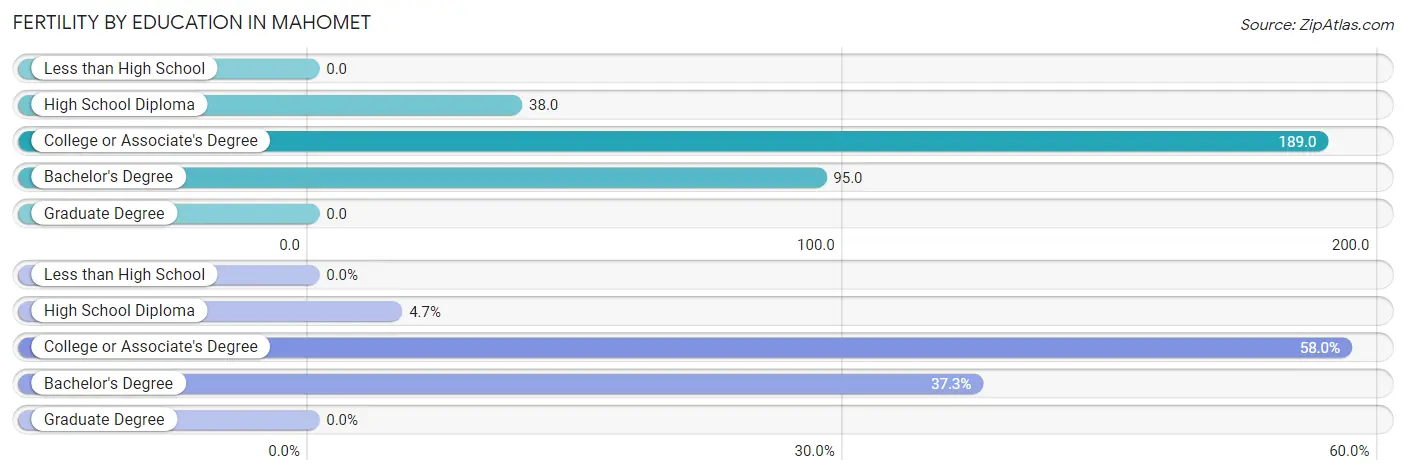
| Educational Attainment | Women with Births | Births / 1,000 Women |
| Less than High School | 0 (0.0%) | 0.0 |
| High School Diploma | 9 (4.7%) | 38.0 |
| College or Associate's Degree | 112 (58.0%) | 189.0 |
| Bachelor's Degree | 72 (37.3%) | 95.0 |
| Graduate Degree | 0 (0.0%) | 0.0 |
| Total | 193 (100.0%) | 88.0 |
Fertility by Education by Marriage Status in Mahomet
31.6% of women with births in Mahomet are unmarried. Women with the educational attainment of high school diploma are most likely to be married with 100.0% of them married at childbirth, while women with the educational attainment of college or associate's degree are least likely to be married with 54.5% of them unmarried at childbirth.

| Educational Attainment | Married | Unmarried |
| Less than High School | 0 (0.0%) | 0 (0.0%) |
| High School Diploma | 9 (100.0%) | 0 (0.0%) |
| College or Associate's Degree | 51 (45.5%) | 61 (54.5%) |
| Bachelor's Degree | 72 (100.0%) | 0 (0.0%) |
| Graduate Degree | 0 (0.0%) | 0 (0.0%) |
| Total | 132 (68.4%) | 61 (31.6%) |
Income in Mahomet
Income Overview in Mahomet
Per Capita Income in Mahomet is $47,023, while median incomes of families and households are $140,435 and $114,083 respectively.
| Characteristic | Number | Measure |
| Per Capita Income | 9,545 | $47,023 |
| Median Family Income | 2,615 | $140,435 |
| Mean Family Income | 2,615 | $154,794 |
| Median Household Income | 3,150 | $114,083 |
| Mean Household Income | 3,150 | $139,393 |
| Income Deficit | 2,615 | $0 |
| Wage / Income Gap (%) | 9,545 | 42.51% |
| Wage / Income Gap ($) | 9,545 | 57.49¢ per $1 |
| Gini / Inequality Index | 9,545 | 0.37 |
Earnings by Sex in Mahomet
Average Earnings in Mahomet are $53,912, $77,606 for men and $44,612 for women, a difference of 42.5%.
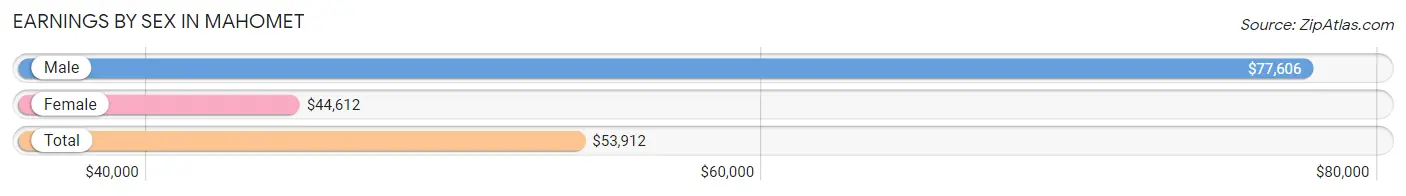
| Sex | Number | Average Earnings |
| Male | 2,805 (53.2%) | $77,606 |
| Female | 2,466 (46.8%) | $44,612 |
| Total | 5,271 (100.0%) | $53,912 |
Earnings by Sex by Income Bracket in Mahomet
The most common earnings brackets in Mahomet are $100,000+ for men (928 | 33.1%) and $55,000 to $64,999 for women (262 | 10.6%).
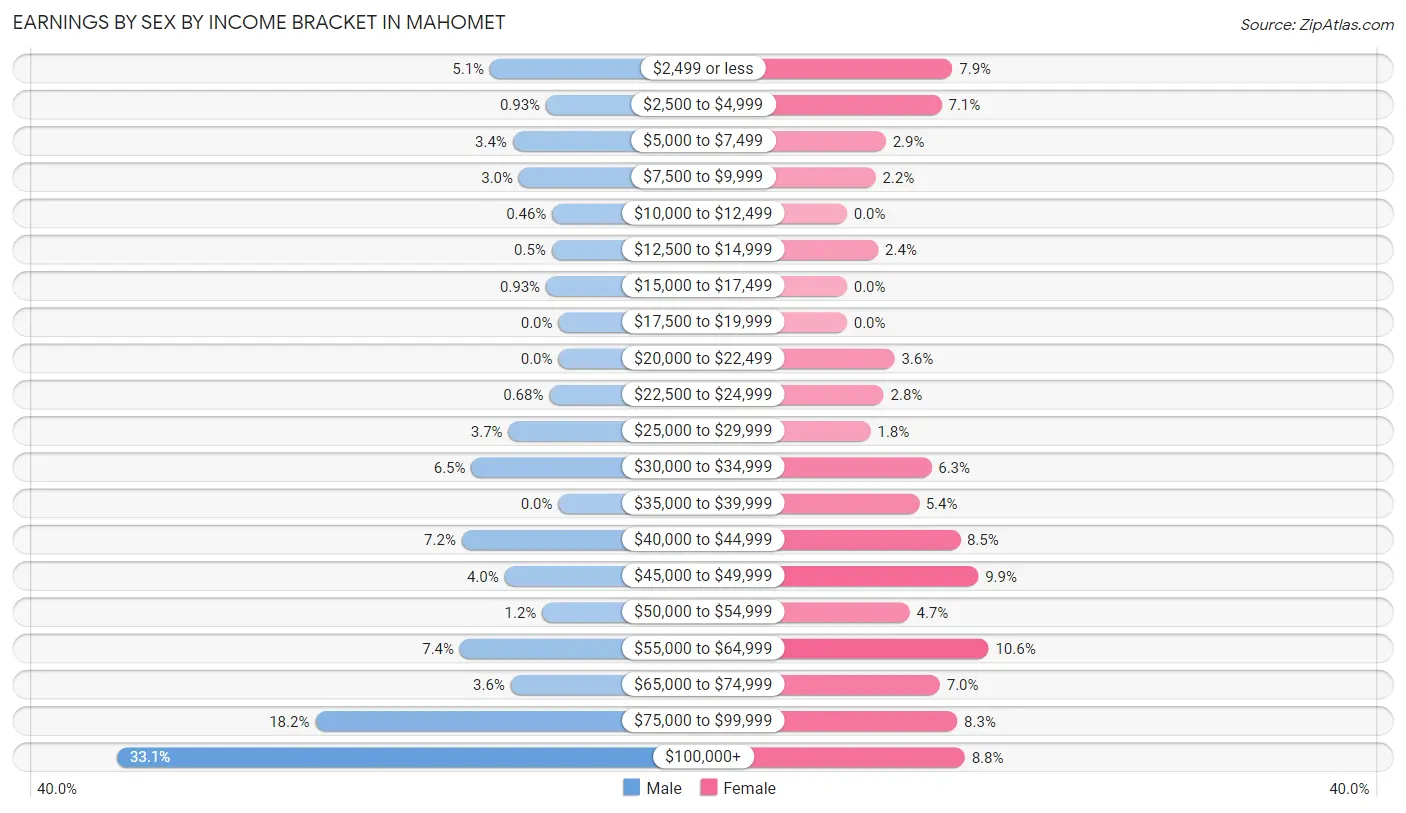
| Income | Male | Female |
| $2,499 or less | 144 (5.1%) | 195 (7.9%) |
| $2,500 to $4,999 | 26 (0.9%) | 175 (7.1%) |
| $5,000 to $7,499 | 96 (3.4%) | 72 (2.9%) |
| $7,500 to $9,999 | 83 (3.0%) | 53 (2.1%) |
| $10,000 to $12,499 | 13 (0.5%) | 0 (0.0%) |
| $12,500 to $14,999 | 14 (0.5%) | 58 (2.4%) |
| $15,000 to $17,499 | 26 (0.9%) | 0 (0.0%) |
| $17,500 to $19,999 | 0 (0.0%) | 0 (0.0%) |
| $20,000 to $22,499 | 0 (0.0%) | 88 (3.6%) |
| $22,500 to $24,999 | 19 (0.7%) | 68 (2.8%) |
| $25,000 to $29,999 | 105 (3.7%) | 44 (1.8%) |
| $30,000 to $34,999 | 183 (6.5%) | 156 (6.3%) |
| $35,000 to $39,999 | 0 (0.0%) | 133 (5.4%) |
| $40,000 to $44,999 | 203 (7.2%) | 209 (8.5%) |
| $45,000 to $49,999 | 113 (4.0%) | 243 (9.9%) |
| $50,000 to $54,999 | 34 (1.2%) | 116 (4.7%) |
| $55,000 to $64,999 | 207 (7.4%) | 262 (10.6%) |
| $65,000 to $74,999 | 100 (3.6%) | 172 (7.0%) |
| $75,000 to $99,999 | 511 (18.2%) | 204 (8.3%) |
| $100,000+ | 928 (33.1%) | 218 (8.8%) |
| Total | 2,805 (100.0%) | 2,466 (100.0%) |
Earnings by Sex by Educational Attainment in Mahomet
Average earnings in Mahomet are $89,256 for men and $46,894 for women, a difference of 47.5%. Men with an educational attainment of graduate degree enjoy the highest average annual earnings of $143,242, while those with less than high school education earn the least with $47,262. Women with an educational attainment of graduate degree earn the most with the average annual earnings of $63,407, while those with college or associate's degree education have the smallest earnings of $42,484.
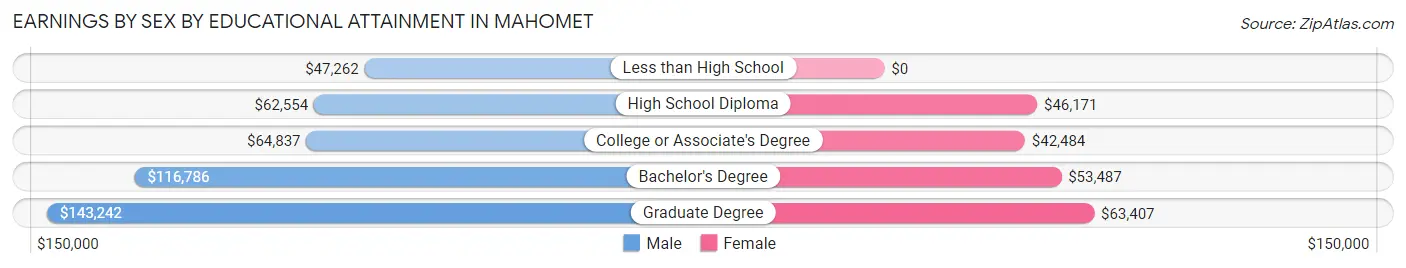
| Educational Attainment | Male Income | Female Income |
| Less than High School | $47,262 | $0 |
| High School Diploma | $62,554 | $46,171 |
| College or Associate's Degree | $64,837 | $42,484 |
| Bachelor's Degree | $116,786 | $53,487 |
| Graduate Degree | $143,242 | $63,407 |
| Total | $89,256 | $46,894 |
Family Income in Mahomet
Family Income Brackets in Mahomet
According to the Mahomet family income data, there are 688 families falling into the $100,000 to $149,999 income range, which is the most common income bracket and makes up 26.3% of all families.
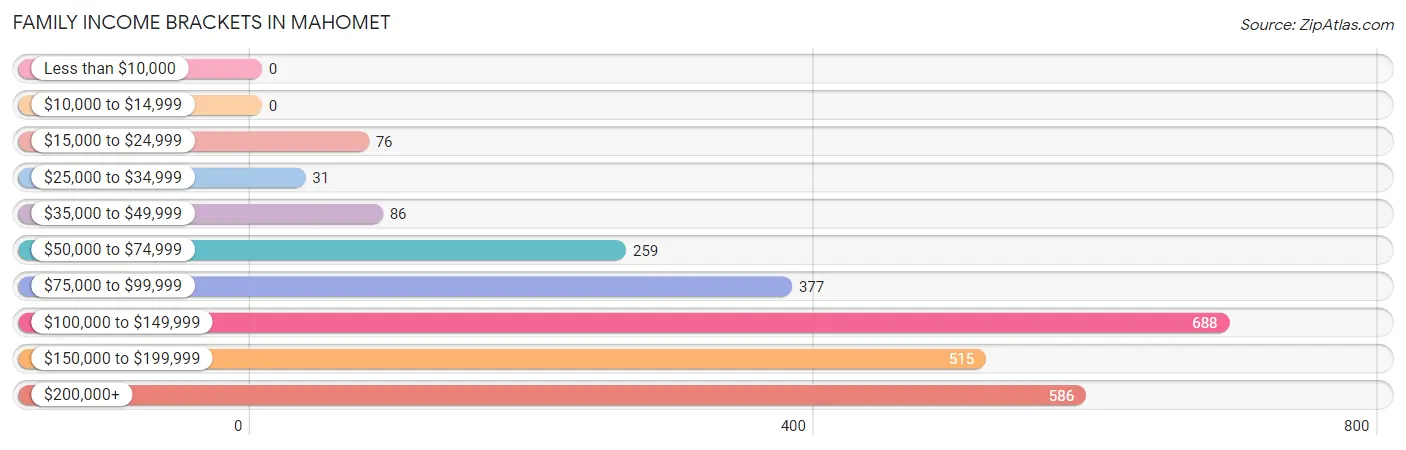
| Income Bracket | # Families | % Families |
| Less than $10,000 | 0 | 0.0% |
| $10,000 to $14,999 | 0 | 0.0% |
| $15,000 to $24,999 | 76 | 2.9% |
| $25,000 to $34,999 | 31 | 1.2% |
| $35,000 to $49,999 | 86 | 3.3% |
| $50,000 to $74,999 | 259 | 9.9% |
| $75,000 to $99,999 | 377 | 14.4% |
| $100,000 to $149,999 | 688 | 26.3% |
| $150,000 to $199,999 | 515 | 19.7% |
| $200,000+ | 586 | 22.4% |
Family Income by Famaliy Size in Mahomet
6-person families (79 | 3.0%) account for the highest median family income in Mahomet with $173,603 per family, while 2-person families (1,069 | 40.9%) have the highest median income of $54,748 per family member.
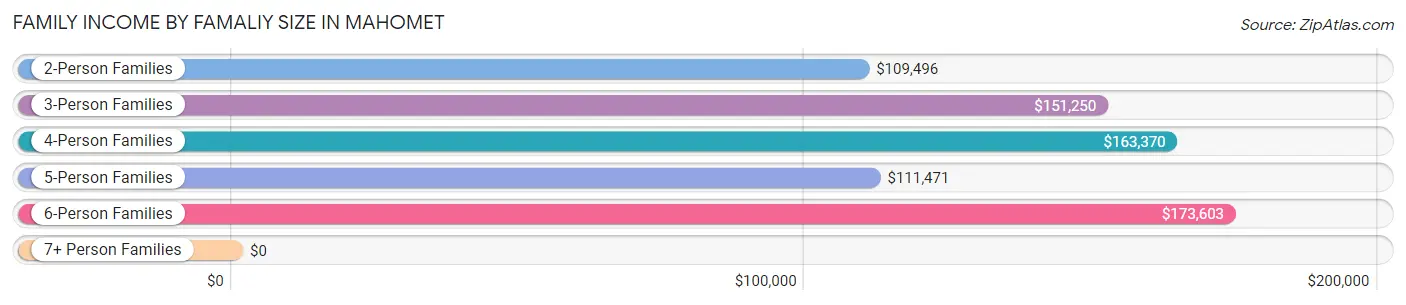
| Income Bracket | # Families | Median Income |
| 2-Person Families | 1,069 (40.9%) | $109,496 |
| 3-Person Families | 483 (18.5%) | $151,250 |
| 4-Person Families | 592 (22.6%) | $163,370 |
| 5-Person Families | 392 (15.0%) | $111,471 |
| 6-Person Families | 79 (3.0%) | $173,603 |
| 7+ Person Families | 0 (0.0%) | $0 |
| Total | 2,615 (100.0%) | $140,435 |
Family Income by Number of Earners in Mahomet
The median family income in Mahomet is $140,435, with families comprising 3+ earners (244) having the highest median family income of $195,405, while families with no earners (226) have the lowest median family income of $71,337, accounting for 9.3% and 8.6% of families, respectively.
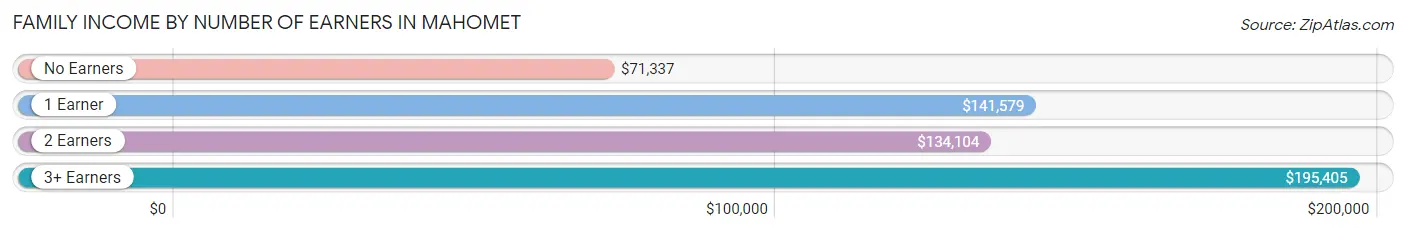
| Number of Earners | # Families | Median Income |
| No Earners | 226 (8.6%) | $71,337 |
| 1 Earner | 564 (21.6%) | $141,579 |
| 2 Earners | 1,581 (60.5%) | $134,104 |
| 3+ Earners | 244 (9.3%) | $195,405 |
| Total | 2,615 (100.0%) | $140,435 |
Household Income in Mahomet
Household Income Brackets in Mahomet
With 702 households falling in the category, the $100,000 to $149,999 income range is the most frequent in Mahomet, accounting for 22.3% of all households.
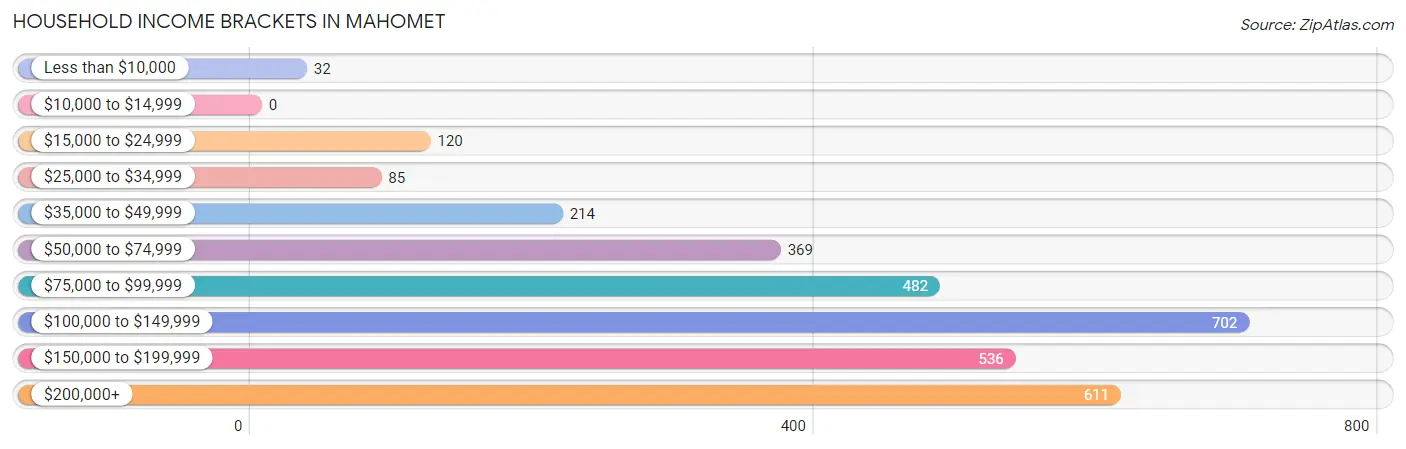
| Income Bracket | # Households | % Households |
| Less than $10,000 | 32 | 1.0% |
| $10,000 to $14,999 | 0 | 0.0% |
| $15,000 to $24,999 | 120 | 3.8% |
| $25,000 to $34,999 | 85 | 2.7% |
| $35,000 to $49,999 | 214 | 6.8% |
| $50,000 to $74,999 | 369 | 11.7% |
| $75,000 to $99,999 | 482 | 15.3% |
| $100,000 to $149,999 | 702 | 22.3% |
| $150,000 to $199,999 | 536 | 17.0% |
| $200,000+ | 611 | 19.4% |
Household Income by Householder Age in Mahomet
The median household income in Mahomet is $114,083, with the highest median household income of $142,483 found in the 45 to 64 years age bracket for the primary householder. A total of 1,281 households (40.7%) fall into this category. Meanwhile, the 15 to 24 years age bracket for the primary householder has the lowest median household income of $0, with 40 households (1.3%) in this group.
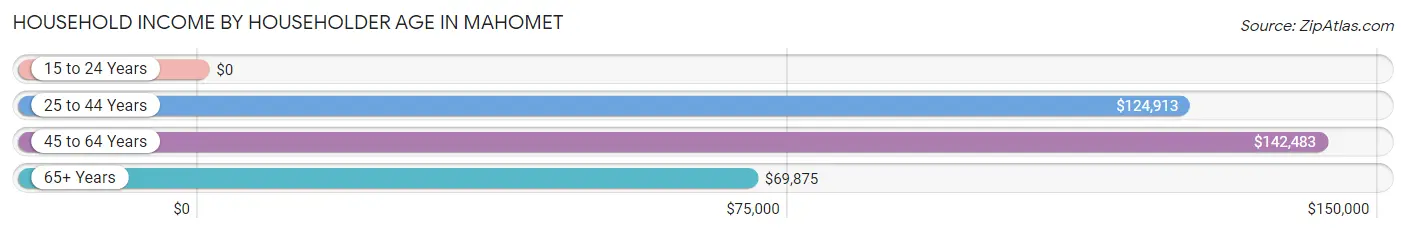
| Income Bracket | # Households | Median Income |
| 15 to 24 Years | 40 (1.3%) | $0 |
| 25 to 44 Years | 1,317 (41.8%) | $124,913 |
| 45 to 64 Years | 1,281 (40.7%) | $142,483 |
| 65+ Years | 512 (16.3%) | $69,875 |
| Total | 3,150 (100.0%) | $114,083 |
Poverty in Mahomet
Income Below Poverty by Sex and Age in Mahomet
With 2.1% poverty level for males and 3.2% for females among the residents of Mahomet, under 5 year old males and 5 year old females are the most vulnerable to poverty, with 20 males (5.3%) and 17 females (13.4%) in their respective age groups living below the poverty level.
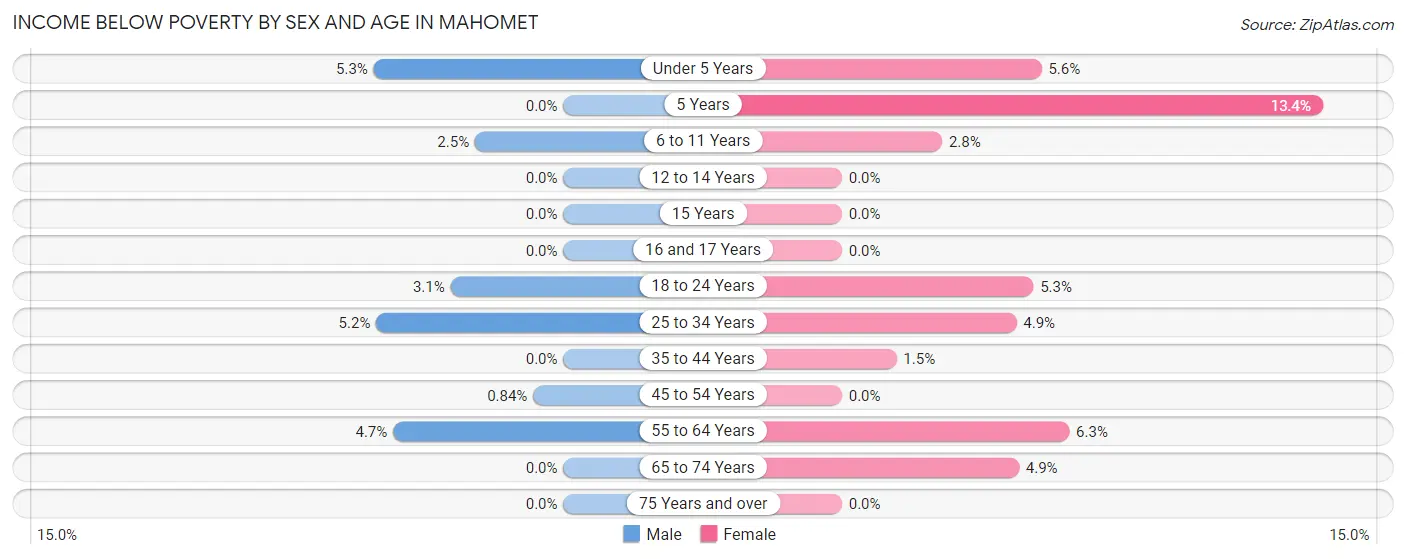
| Age Bracket | Male | Female |
| Under 5 Years | 20 (5.3%) | 14 (5.6%) |
| 5 Years | 0 (0.0%) | 17 (13.4%) |
| 6 to 11 Years | 13 (2.5%) | 15 (2.8%) |
| 12 to 14 Years | 0 (0.0%) | 0 (0.0%) |
| 15 Years | 0 (0.0%) | 0 (0.0%) |
| 16 and 17 Years | 0 (0.0%) | 0 (0.0%) |
| 18 to 24 Years | 17 (3.1%) | 18 (5.3%) |
| 25 to 34 Years | 16 (5.2%) | 18 (4.9%) |
| 35 to 44 Years | 0 (0.0%) | 14 (1.5%) |
| 45 to 54 Years | 5 (0.8%) | 0 (0.0%) |
| 55 to 64 Years | 26 (4.7%) | 45 (6.3%) |
| 65 to 74 Years | 0 (0.0%) | 14 (4.9%) |
| 75 Years and over | 0 (0.0%) | 0 (0.0%) |
| Total | 97 (2.1%) | 155 (3.2%) |
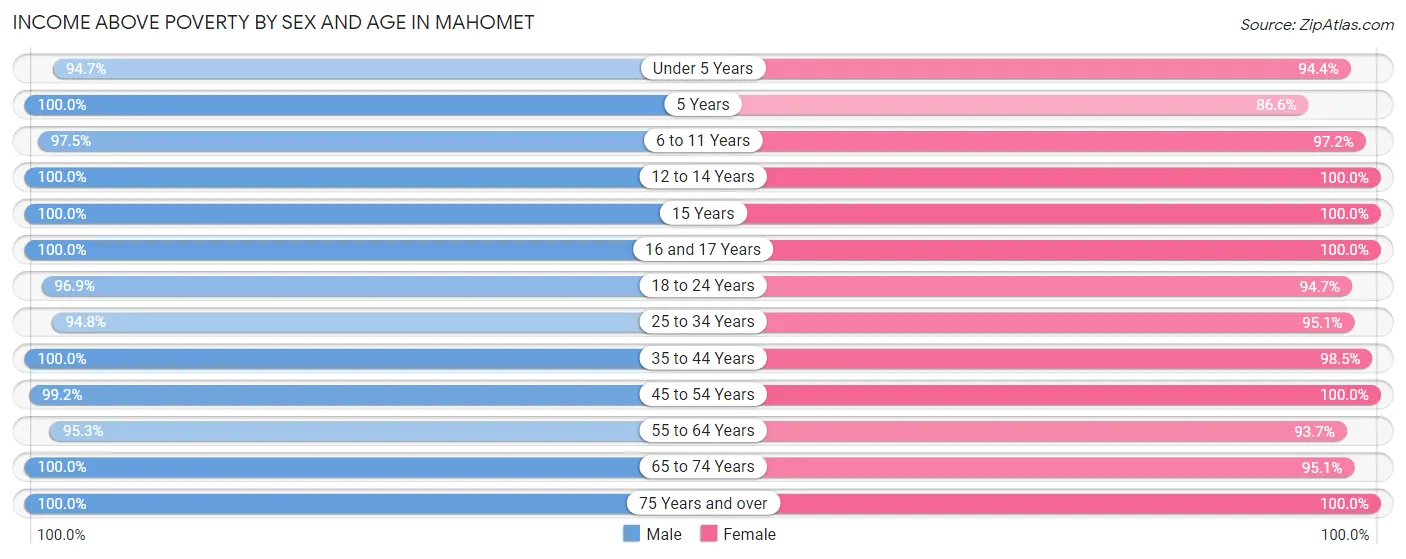
Income Above Poverty by Sex and Age in Mahomet
According to the poverty statistics in Mahomet, males aged 5 years and females aged 12 to 14 years are the age groups that are most secure financially, with 100.0% of males and 100.0% of females in these age groups living above the poverty line.
| Age Bracket | Male | Female |
| Under 5 Years | 359 (94.7%) | 238 (94.4%) |
| 5 Years | 99 (100.0%) | 110 (86.6%) |
| 6 to 11 Years | 515 (97.5%) | 523 (97.2%) |
| 12 to 14 Years | 321 (100.0%) | 380 (100.0%) |
| 15 Years | 17 (100.0%) | 37 (100.0%) |
| 16 and 17 Years | 111 (100.0%) | 152 (100.0%) |
| 18 to 24 Years | 524 (96.9%) | 320 (94.7%) |
| 25 to 34 Years | 291 (94.8%) | 352 (95.1%) |
| 35 to 44 Years | 904 (100.0%) | 907 (98.5%) |
| 45 to 54 Years | 593 (99.2%) | 553 (100.0%) |
| 55 to 64 Years | 523 (95.3%) | 666 (93.7%) |
| 65 to 74 Years | 325 (100.0%) | 270 (95.1%) |
| 75 Years and over | 54 (100.0%) | 140 (100.0%) |
| Total | 4,636 (98.0%) | 4,648 (96.8%) |
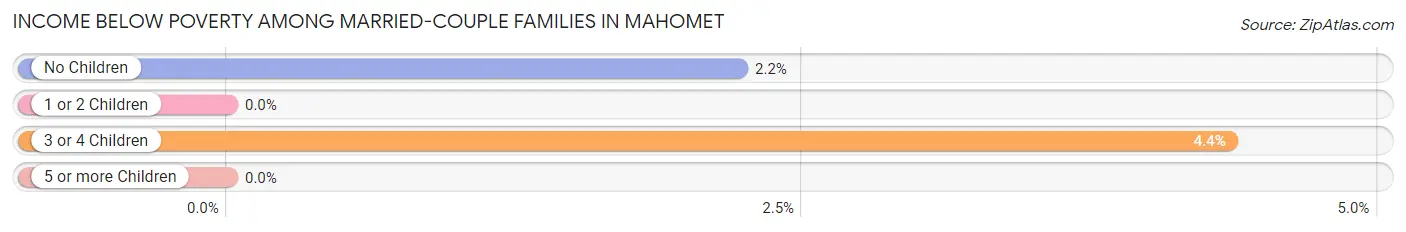
Income Below Poverty Among Married-Couple Families in Mahomet
The poverty statistics for married-couple families in Mahomet show that 1.8% or 44 of the total 2,372 families live below the poverty line. Families with 3 or 4 children have the highest poverty rate of 4.3%, comprising of 18 families. On the other hand, families with 1 or 2 children have the lowest poverty rate of 0.0%, which includes 0 families.
| Children | Above Poverty | Below Poverty |
| No Children | 1,144 (97.8%) | 26 (2.2%) |
| 1 or 2 Children | 788 (100.0%) | 0 (0.0%) |
| 3 or 4 Children | 396 (95.7%) | 18 (4.3%) |
| 5 or more Children | 0 (0.0%) | 0 (0.0%) |
| Total | 2,328 (98.2%) | 44 (1.8%) |
Income Below Poverty Among Single-Parent Households in Mahomet
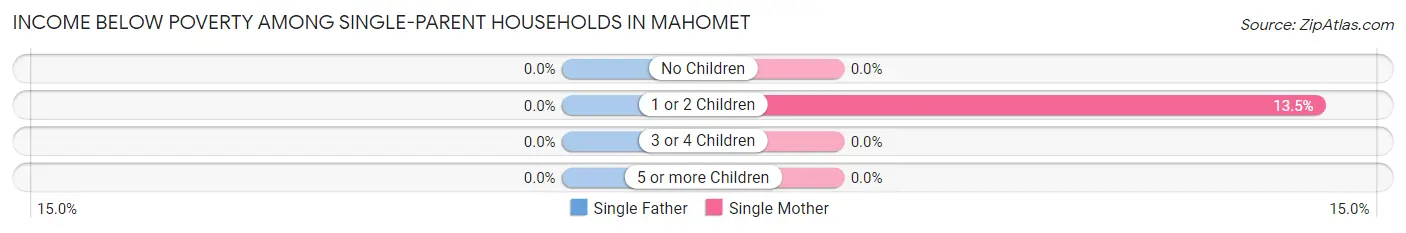
| Children | Single Father | Single Mother |
| No Children | 0 (0.0%) | 0 (0.0%) |
| 1 or 2 Children | 0 (0.0%) | 14 (13.5%) |
| 3 or 4 Children | 0 (0.0%) | 0 (0.0%) |
| 5 or more Children | 0 (0.0%) | 0 (0.0%) |
| Total | 0 (0.0%) | 14 (6.8%) |
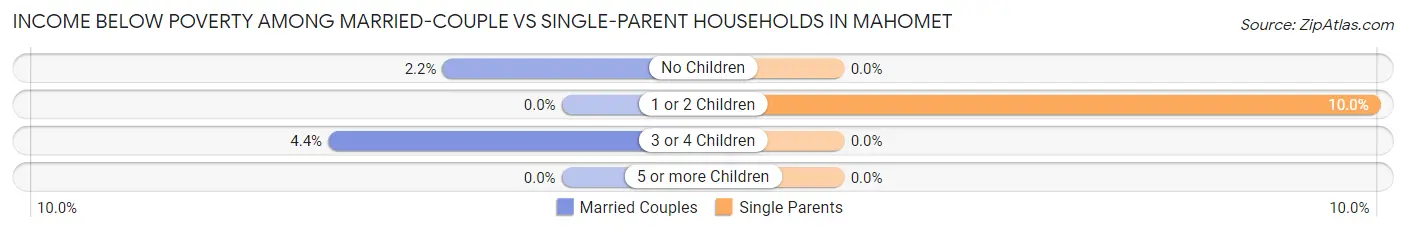
Income Below Poverty Among Married-Couple vs Single-Parent Households in Mahomet
The poverty data for Mahomet shows that 44 of the married-couple family households (1.8%) and 14 of the single-parent households (5.8%) are living below the poverty level. Within the married-couple family households, those with 3 or 4 children have the highest poverty rate, with 18 households (4.3%) falling below the poverty line. Among the single-parent households, those with 1 or 2 children have the highest poverty rate, with 14 household (10.0%) living below poverty.
| Children | Married-Couple Families | Single-Parent Households |
| No Children | 26 (2.2%) | 0 (0.0%) |
| 1 or 2 Children | 0 (0.0%) | 14 (10.0%) |
| 3 or 4 Children | 18 (4.3%) | 0 (0.0%) |
| 5 or more Children | 0 (0.0%) | 0 (0.0%) |
| Total | 44 (1.8%) | 14 (5.8%) |
Employment Characteristics in Mahomet
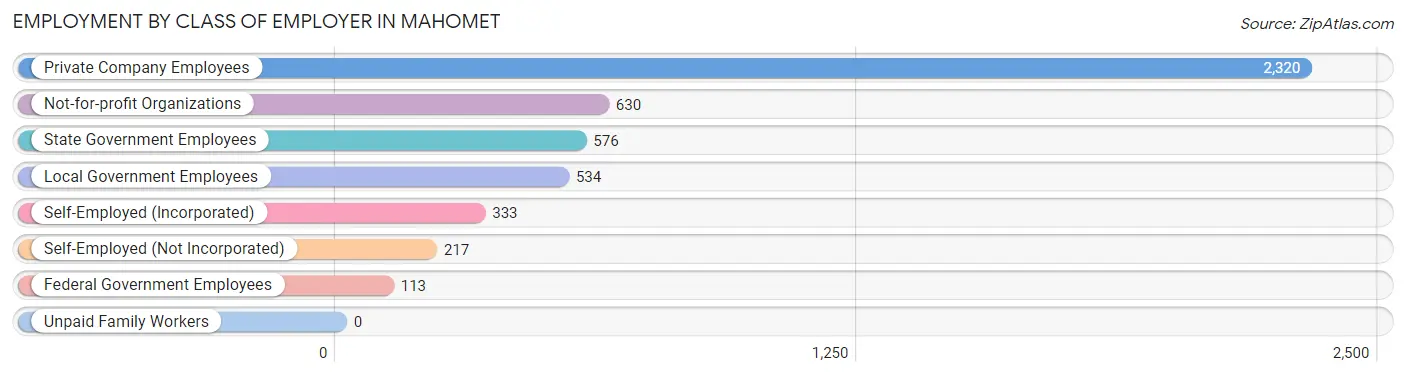
Employment by Class of Employer in Mahomet
Among the 4,723 employed individuals in Mahomet, private company employees (2,320 | 49.1%), not-for-profit organizations (630 | 13.3%), and state government employees (576 | 12.2%) make up the most common classes of employment.
| Employer Class | # Employees | % Employees |
| Private Company Employees | 2,320 | 49.1% |
| Self-Employed (Incorporated) | 333 | 7.0% |
| Self-Employed (Not Incorporated) | 217 | 4.6% |
| Not-for-profit Organizations | 630 | 13.3% |
| Local Government Employees | 534 | 11.3% |
| State Government Employees | 576 | 12.2% |
| Federal Government Employees | 113 | 2.4% |
| Unpaid Family Workers | 0 | 0.0% |
| Total | 4,723 | 100.0% |
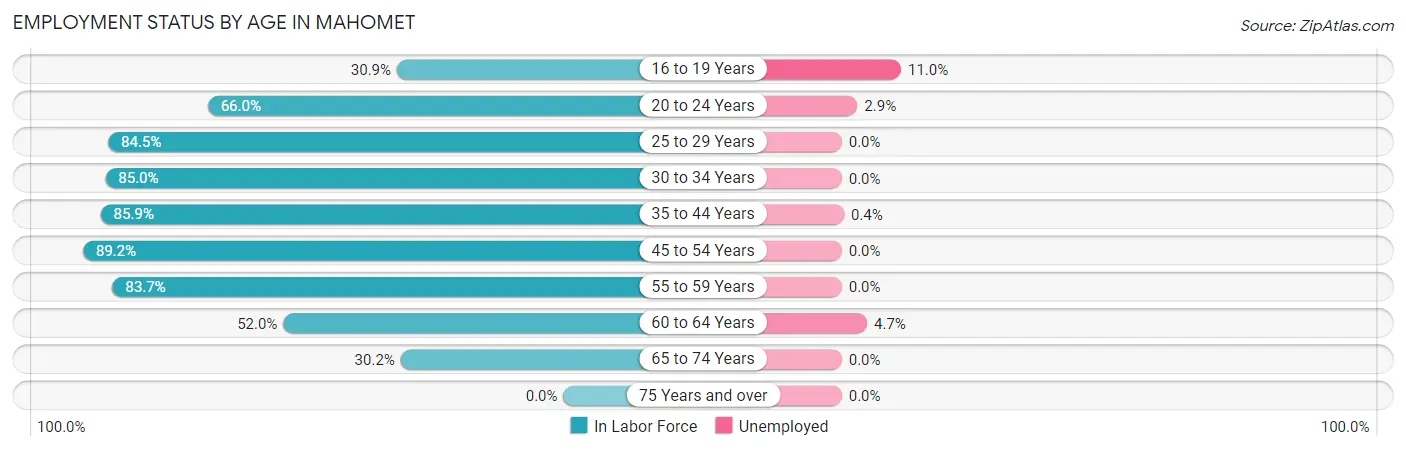
Employment Status by Age in Mahomet
According to the labor force statistics for Mahomet, out of the total population over 16 years of age (6,858), 69.9% or 4,794 individuals are in the labor force, with 1.0% or 48 of them unemployed. The age group with the highest labor force participation rate is 45 to 54 years, with 89.2% or 1,027 individuals in the labor force. Within the labor force, the 16 to 19 years age range has the highest percentage of unemployed individuals, with 11.0% or 19 of them being unemployed.
| Age Bracket | In Labor Force | Unemployed |
| 16 to 19 Years | 173 (30.9%) | 19 (11.0%) |
| 20 to 24 Years | 384 (66.0%) | 11 (2.9%) |
| 25 to 29 Years | 229 (84.5%) | 0 (0.0%) |
| 30 to 34 Years | 345 (85.0%) | 0 (0.0%) |
| 35 to 44 Years | 1,568 (85.9%) | 6 (0.4%) |
| 45 to 54 Years | 1,027 (89.2%) | 0 (0.0%) |
| 55 to 59 Years | 607 (83.7%) | 0 (0.0%) |
| 60 to 64 Years | 278 (52.0%) | 13 (4.7%) |
| 65 to 74 Years | 184 (30.2%) | 0 (0.0%) |
| 75 Years and over | 0 (0.0%) | 0 (0.0%) |
| Total | 4,794 (69.9%) | 48 (1.0%) |
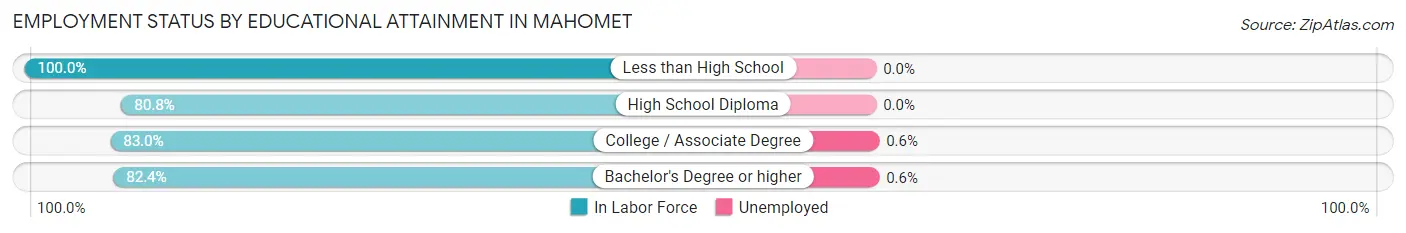
Employment Status by Educational Attainment in Mahomet
According to labor force statistics for Mahomet, 82.5% of individuals (4,053) out of the total population between 25 and 64 years of age (4,913) are in the labor force, with 0.5% or 20 of them being unemployed. The group with the highest labor force participation rate are those with the educational attainment of less than high school, with 100.0% or 51 individuals in the labor force. Within the labor force, individuals with college / associate degree education have the highest percentage of unemployment, with 0.6% or 7 of them being unemployed.
| Educational Attainment | In Labor Force | Unemployed |
| Less than High School | 51 (100.0%) | 0 (0.0%) |
| High School Diploma | 605 (80.8%) | 0 (0.0%) |
| College / Associate Degree | 1,208 (83.0%) | 9 (0.6%) |
| Bachelor's Degree or higher | 2,190 (82.4%) | 16 (0.6%) |
| Total | 4,053 (82.5%) | 25 (0.5%) |
Employment Occupations by Sex in Mahomet
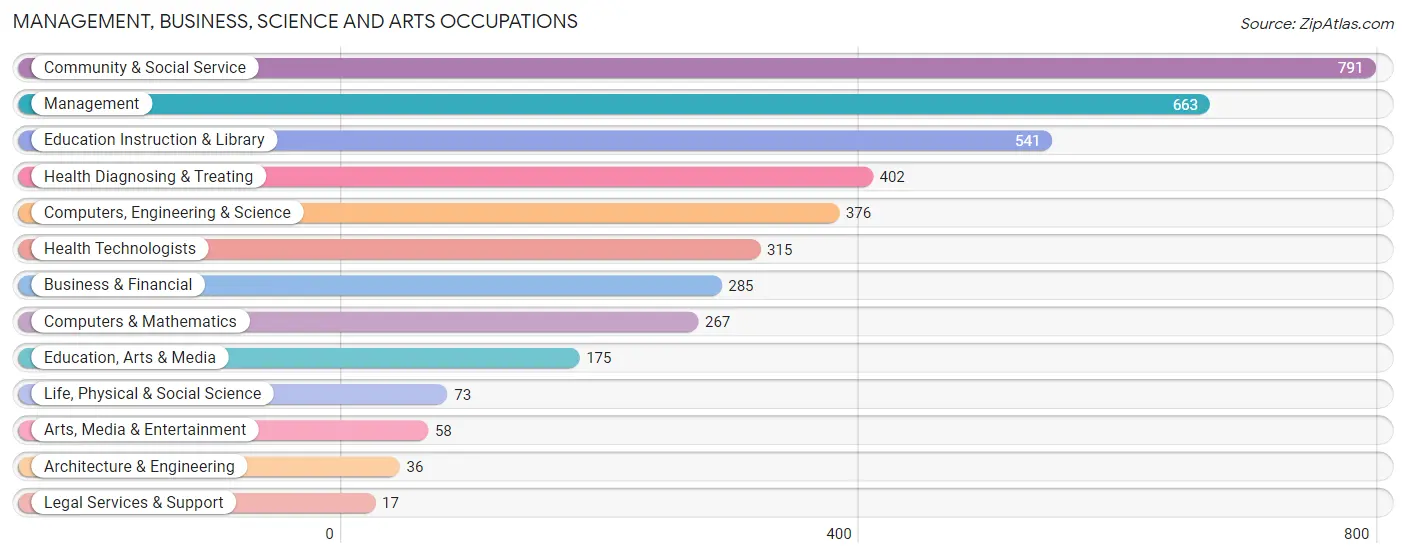
Management, Business, Science and Arts Occupations
The most common Management, Business, Science and Arts occupations in Mahomet are Community & Social Service (791 | 16.7%), Management (663 | 14.0%), Education Instruction & Library (541 | 11.4%), Health Diagnosing & Treating (402 | 8.5%), and Computers, Engineering & Science (376 | 7.9%).
Management, Business, Science and Arts Occupations by Sex
Within the Management, Business, Science and Arts occupations in Mahomet, the most male-oriented occupations are Architecture & Engineering (100.0%), Legal Services & Support (100.0%), and Computers & Mathematics (84.3%), while the most female-oriented occupations are Education, Arts & Media (89.1%), Community & Social Service (62.8%), and Life, Physical & Social Science (60.3%).
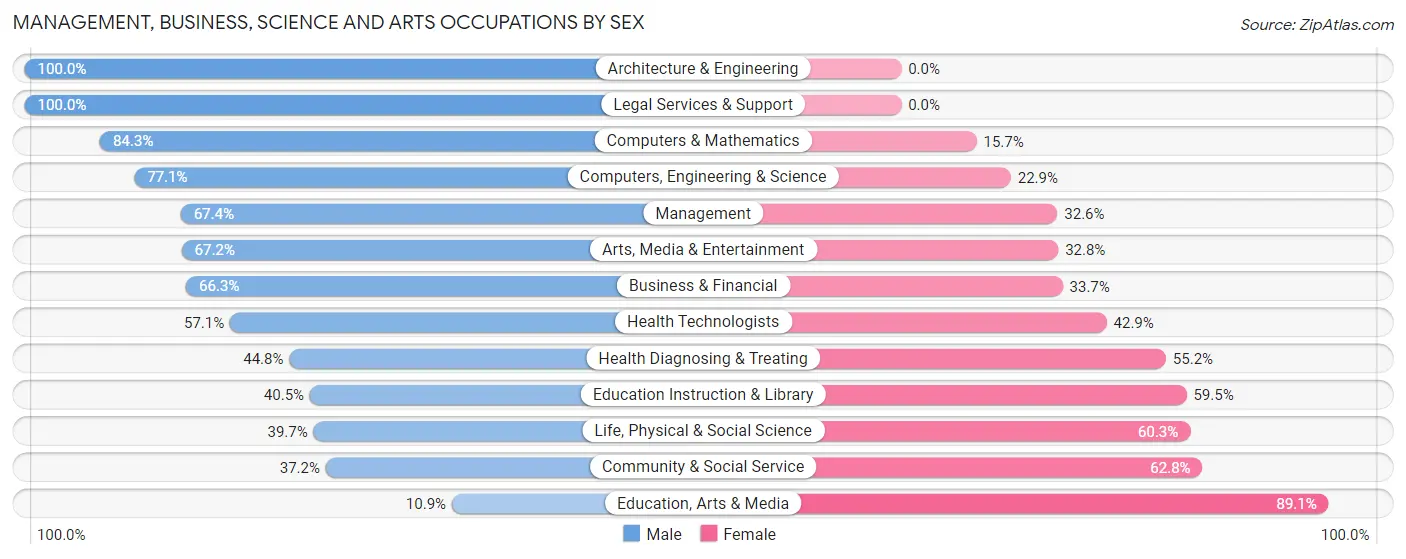
| Occupation | Male | Female |
| Management | 447 (67.4%) | 216 (32.6%) |
| Business & Financial | 189 (66.3%) | 96 (33.7%) |
| Computers, Engineering & Science | 290 (77.1%) | 86 (22.9%) |
| Computers & Mathematics | 225 (84.3%) | 42 (15.7%) |
| Architecture & Engineering | 36 (100.0%) | 0 (0.0%) |
| Life, Physical & Social Science | 29 (39.7%) | 44 (60.3%) |
| Community & Social Service | 294 (37.2%) | 497 (62.8%) |
| Education, Arts & Media | 19 (10.9%) | 156 (89.1%) |
| Legal Services & Support | 17 (100.0%) | 0 (0.0%) |
| Education Instruction & Library | 219 (40.5%) | 322 (59.5%) |
| Arts, Media & Entertainment | 39 (67.2%) | 19 (32.8%) |
| Health Diagnosing & Treating | 180 (44.8%) | 222 (55.2%) |
| Health Technologists | 180 (57.1%) | 135 (42.9%) |
| Total (Category) | 1,400 (55.6%) | 1,117 (44.4%) |
| Total (Overall) | 2,599 (54.8%) | 2,146 (45.2%) |
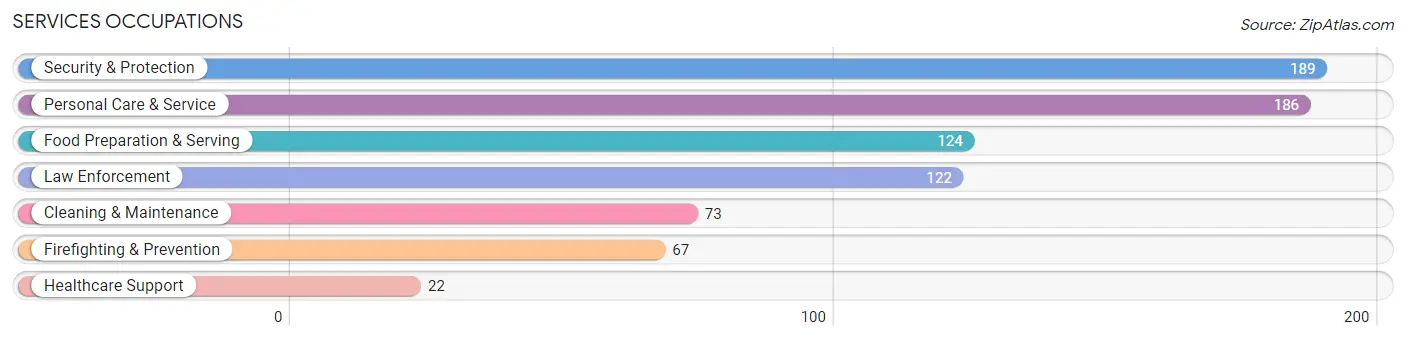
Services Occupations
The most common Services occupations in Mahomet are Security & Protection (189 | 4.0%), Personal Care & Service (186 | 3.9%), Food Preparation & Serving (124 | 2.6%), Law Enforcement (122 | 2.6%), and Cleaning & Maintenance (73 | 1.5%).
Services Occupations by Sex
Within the Services occupations in Mahomet, the most male-oriented occupations are Firefighting & Prevention (86.6%), Security & Protection (86.2%), and Law Enforcement (86.1%), while the most female-oriented occupations are Healthcare Support (100.0%), Personal Care & Service (82.8%), and Food Preparation & Serving (50.8%).
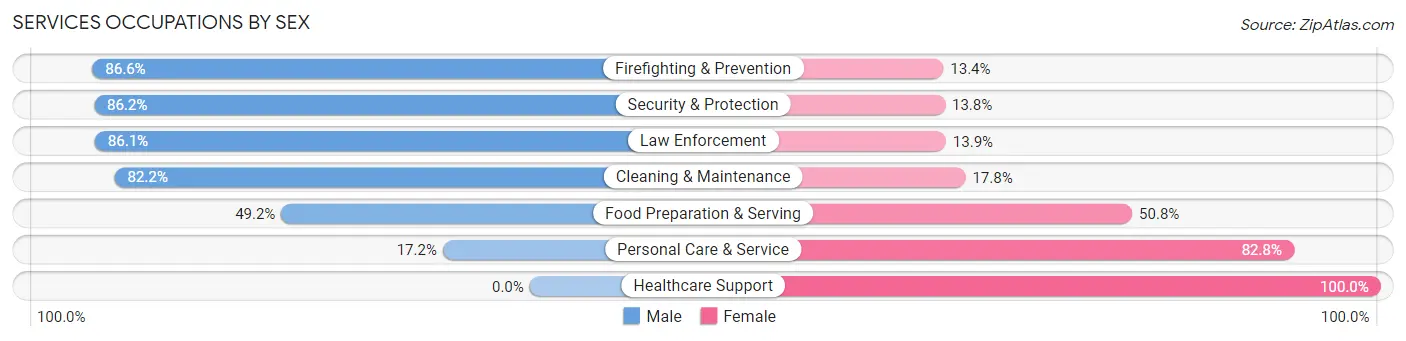
| Occupation | Male | Female |
| Healthcare Support | 0 (0.0%) | 22 (100.0%) |
| Security & Protection | 163 (86.2%) | 26 (13.8%) |
| Firefighting & Prevention | 58 (86.6%) | 9 (13.4%) |
| Law Enforcement | 105 (86.1%) | 17 (13.9%) |
| Food Preparation & Serving | 61 (49.2%) | 63 (50.8%) |
| Cleaning & Maintenance | 60 (82.2%) | 13 (17.8%) |
| Personal Care & Service | 32 (17.2%) | 154 (82.8%) |
| Total (Category) | 316 (53.2%) | 278 (46.8%) |
| Total (Overall) | 2,599 (54.8%) | 2,146 (45.2%) |
Sales and Office Occupations
The most common Sales and Office occupations in Mahomet are Office & Administration (699 | 14.7%), and Sales & Related (336 | 7.1%).

Sales and Office Occupations by Sex
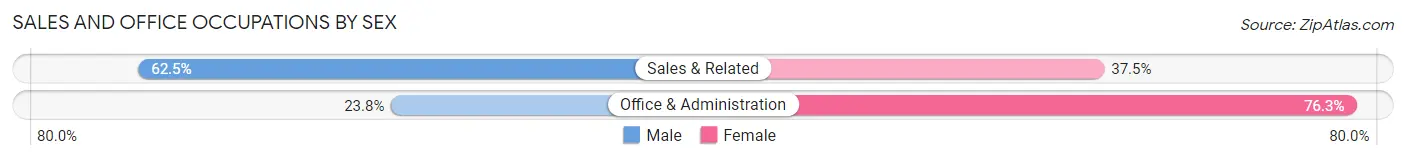
| Occupation | Male | Female |
| Sales & Related | 210 (62.5%) | 126 (37.5%) |
| Office & Administration | 166 (23.7%) | 533 (76.2%) |
| Total (Category) | 376 (36.3%) | 659 (63.7%) |
| Total (Overall) | 2,599 (54.8%) | 2,146 (45.2%) |
Natural Resources, Construction and Maintenance Occupations
The most common Natural Resources, Construction and Maintenance occupations in Mahomet are Construction & Extraction (260 | 5.5%), and Installation, Maintenance & Repair (34 | 0.7%).
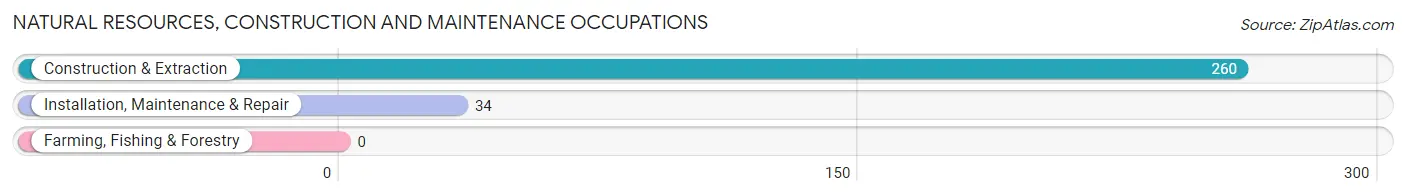
Natural Resources, Construction and Maintenance Occupations by Sex
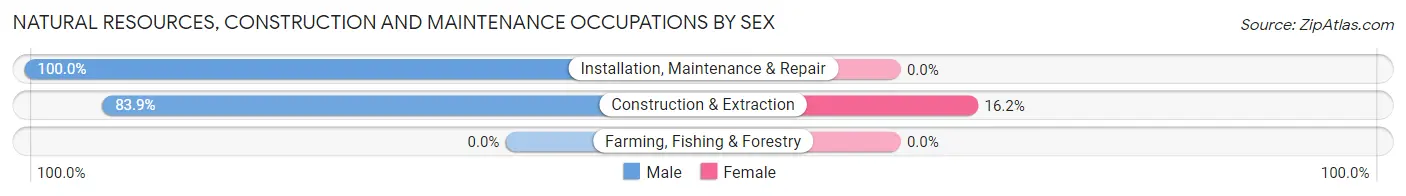
| Occupation | Male | Female |
| Farming, Fishing & Forestry | 0 (0.0%) | 0 (0.0%) |
| Construction & Extraction | 218 (83.9%) | 42 (16.2%) |
| Installation, Maintenance & Repair | 34 (100.0%) | 0 (0.0%) |
| Total (Category) | 252 (85.7%) | 42 (14.3%) |
| Total (Overall) | 2,599 (54.8%) | 2,146 (45.2%) |
Production, Transportation and Moving Occupations
The most common Production, Transportation and Moving occupations in Mahomet are Transportation (136 | 2.9%), Production (96 | 2.0%), and Material Moving (73 | 1.5%).
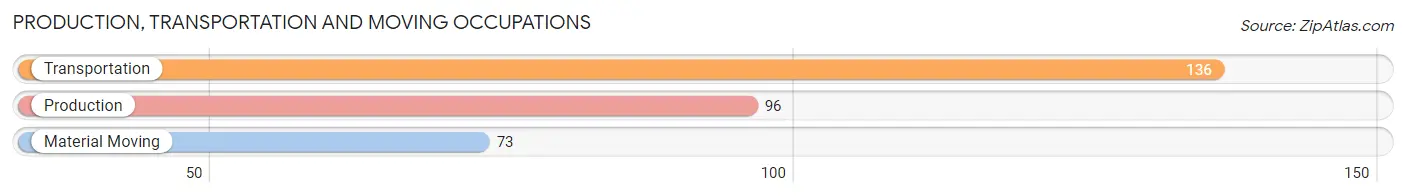
Production, Transportation and Moving Occupations by Sex
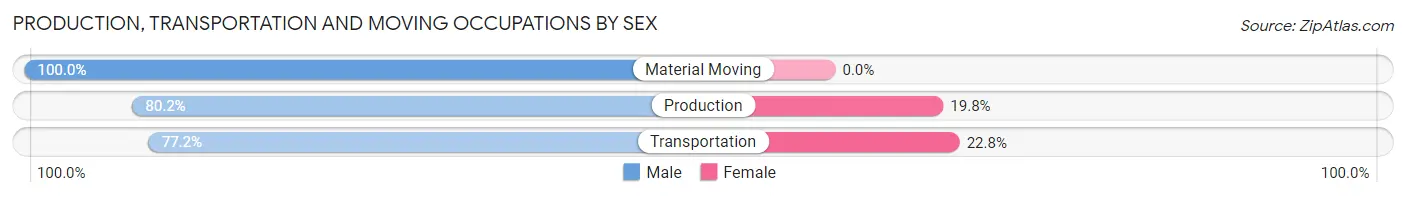
| Occupation | Male | Female |
| Production | 77 (80.2%) | 19 (19.8%) |
| Transportation | 105 (77.2%) | 31 (22.8%) |
| Material Moving | 73 (100.0%) | 0 (0.0%) |
| Total (Category) | 255 (83.6%) | 50 (16.4%) |
| Total (Overall) | 2,599 (54.8%) | 2,146 (45.2%) |
Employment Industries by Sex in Mahomet
Employment Industries in Mahomet
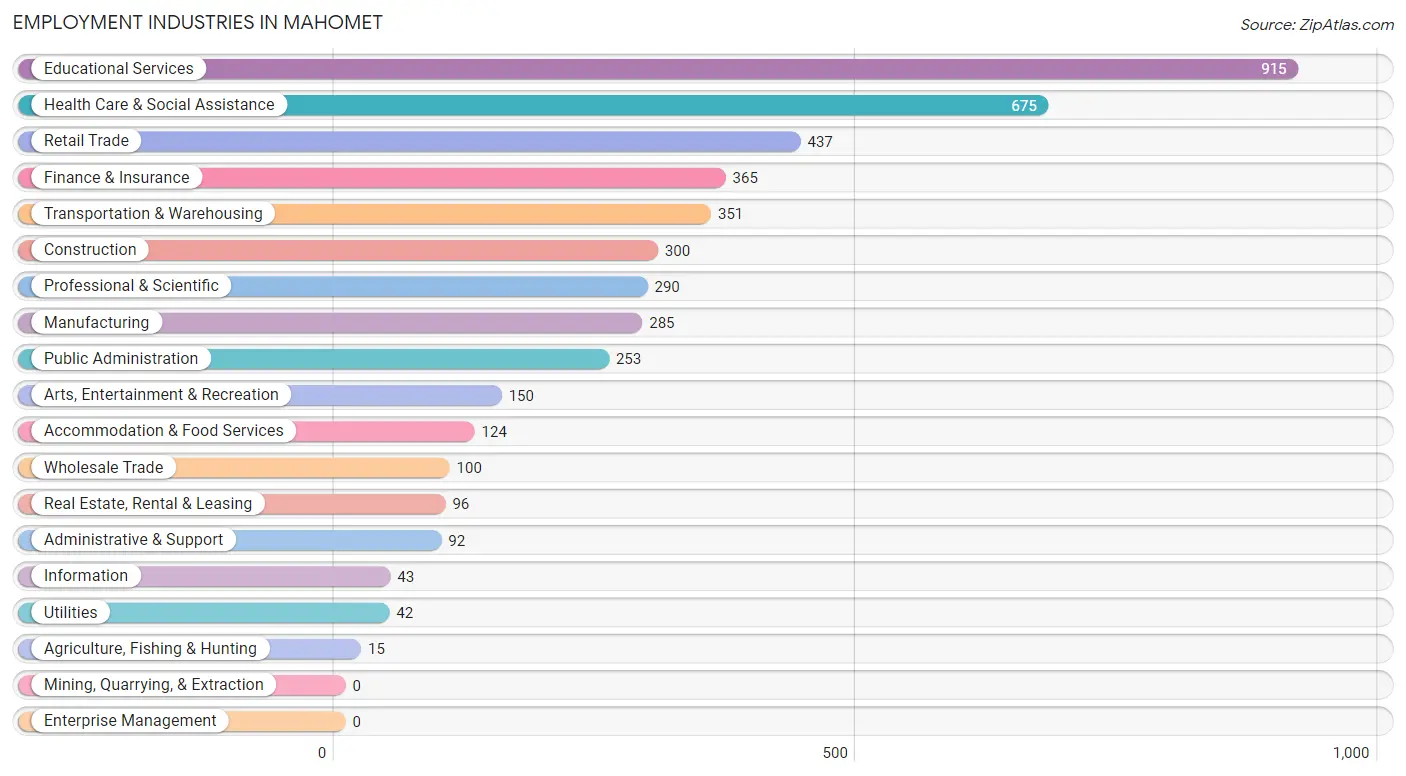
The major employment industries in Mahomet include Educational Services (915 | 19.3%), Health Care & Social Assistance (675 | 14.2%), Retail Trade (437 | 9.2%), Finance & Insurance (365 | 7.7%), and Transportation & Warehousing (351 | 7.4%).
Employment Industries by Sex in Mahomet
The Mahomet industries that see more men than women are Agriculture, Fishing & Hunting (100.0%), Utilities (100.0%), and Real Estate, Rental & Leasing (100.0%), whereas the industries that tend to have a higher number of women are Accommodation & Food Services (83.1%), Health Care & Social Assistance (72.3%), and Administrative & Support (59.8%).
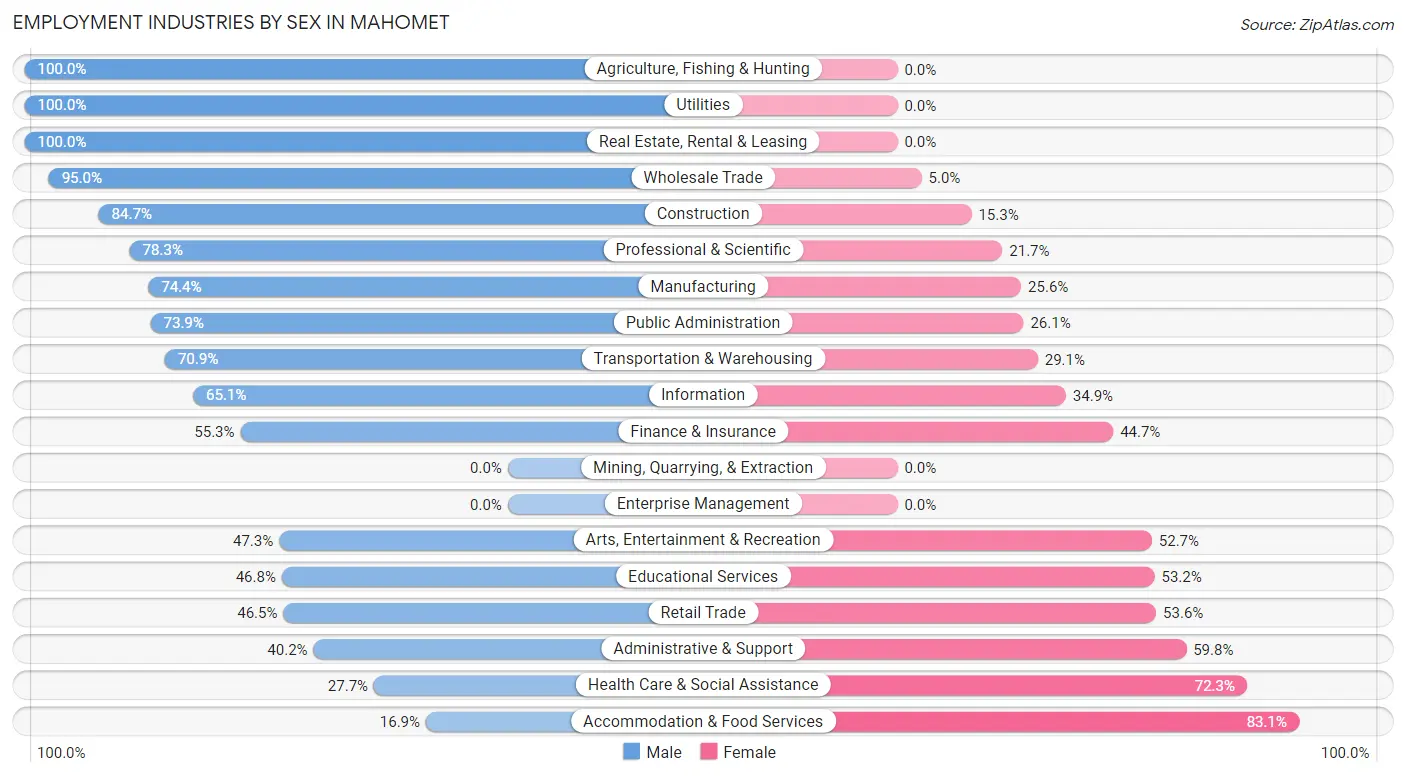
| Industry | Male | Female |
| Agriculture, Fishing & Hunting | 15 (100.0%) | 0 (0.0%) |
| Mining, Quarrying, & Extraction | 0 (0.0%) | 0 (0.0%) |
| Construction | 254 (84.7%) | 46 (15.3%) |
| Manufacturing | 212 (74.4%) | 73 (25.6%) |
| Wholesale Trade | 95 (95.0%) | 5 (5.0%) |
| Retail Trade | 203 (46.5%) | 234 (53.5%) |
| Transportation & Warehousing | 249 (70.9%) | 102 (29.1%) |
| Utilities | 42 (100.0%) | 0 (0.0%) |
| Information | 28 (65.1%) | 15 (34.9%) |
| Finance & Insurance | 202 (55.3%) | 163 (44.7%) |
| Real Estate, Rental & Leasing | 96 (100.0%) | 0 (0.0%) |
| Professional & Scientific | 227 (78.3%) | 63 (21.7%) |
| Enterprise Management | 0 (0.0%) | 0 (0.0%) |
| Administrative & Support | 37 (40.2%) | 55 (59.8%) |
| Educational Services | 428 (46.8%) | 487 (53.2%) |
| Health Care & Social Assistance | 187 (27.7%) | 488 (72.3%) |
| Arts, Entertainment & Recreation | 71 (47.3%) | 79 (52.7%) |
| Accommodation & Food Services | 21 (16.9%) | 103 (83.1%) |
| Public Administration | 187 (73.9%) | 66 (26.1%) |
| Total | 2,599 (54.8%) | 2,146 (45.2%) |
Education in Mahomet
School Enrollment in Mahomet
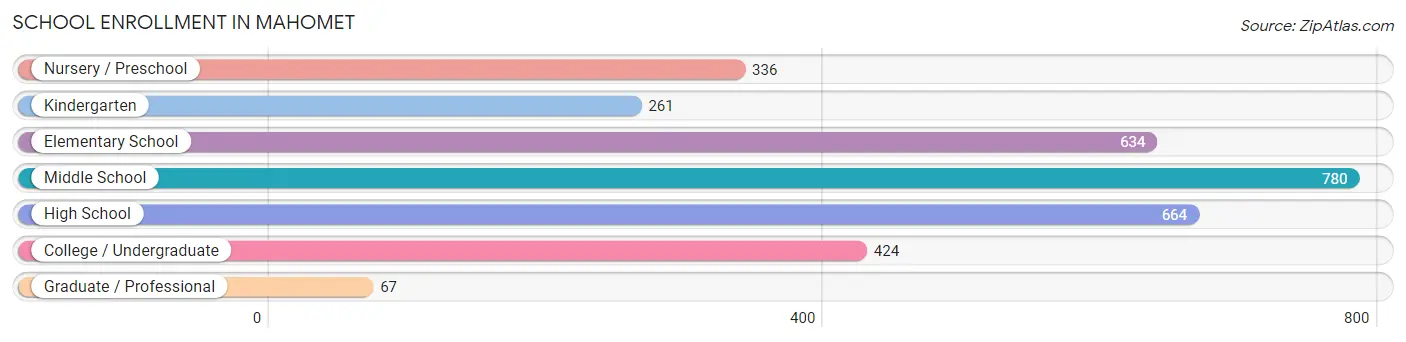
The most common levels of schooling among the 3,166 students in Mahomet are middle school (780 | 24.6%), high school (664 | 21.0%), and elementary school (634 | 20.0%).
| School Level | # Students | % Students |
| Nursery / Preschool | 336 | 10.6% |
| Kindergarten | 261 | 8.2% |
| Elementary School | 634 | 20.0% |
| Middle School | 780 | 24.6% |
| High School | 664 | 21.0% |
| College / Undergraduate | 424 | 13.4% |
| Graduate / Professional | 67 | 2.1% |
| Total | 3,166 | 100.0% |
School Enrollment by Age by Funding Source in Mahomet
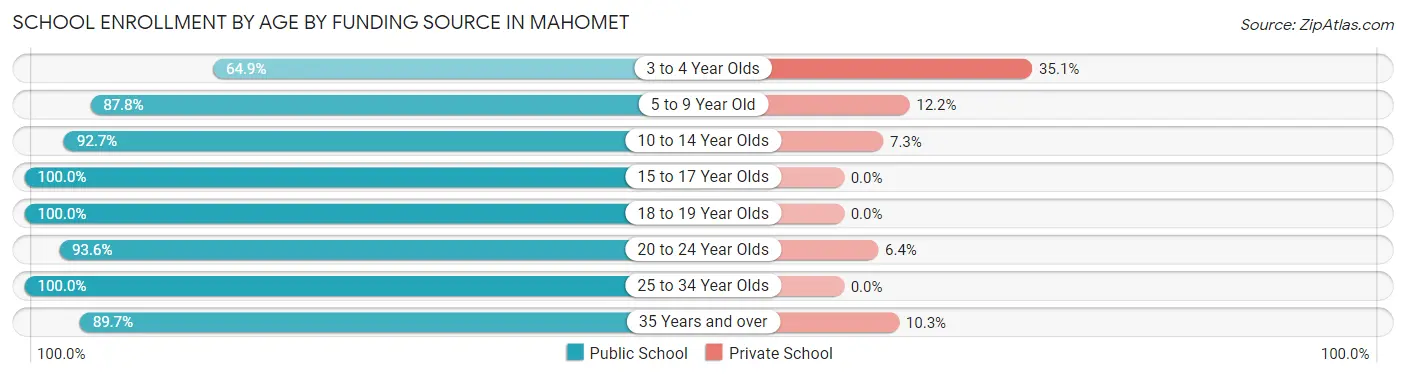
Out of a total of 3,166 students who are enrolled in schools in Mahomet, 298 (9.4%) attend a private institution, while the remaining 2,868 (90.6%) are enrolled in public schools. The age group of 3 to 4 year olds has the highest likelihood of being enrolled in private schools, with 79 (35.1% in the age bracket) enrolled. Conversely, the age group of 15 to 17 year olds has the lowest likelihood of being enrolled in a private school, with 284 (100.0% in the age bracket) attending a public institution.
| Age Bracket | Public School | Private School |
| 3 to 4 Year Olds | 146 (64.9%) | 79 (35.1%) |
| 5 to 9 Year Old | 782 (87.8%) | 109 (12.2%) |
| 10 to 14 Year Olds | 986 (92.7%) | 78 (7.3%) |
| 15 to 17 Year Olds | 284 (100.0%) | 0 (0.0%) |
| 18 to 19 Year Olds | 265 (100.0%) | 0 (0.0%) |
| 20 to 24 Year Olds | 263 (93.6%) | 18 (6.4%) |
| 25 to 34 Year Olds | 20 (100.0%) | 0 (0.0%) |
| 35 Years and over | 122 (89.7%) | 14 (10.3%) |
| Total | 2,868 (90.6%) | 298 (9.4%) |
Educational Attainment by Field of Study in Mahomet
Education (634 | 20.5%), business (624 | 20.2%), arts & humanities (316 | 10.2%), bio, nature & agricultural (296 | 9.6%), and science & technology (228 | 7.4%) are the most common fields of study among 3,094 individuals in Mahomet who have obtained a bachelor's degree or higher.
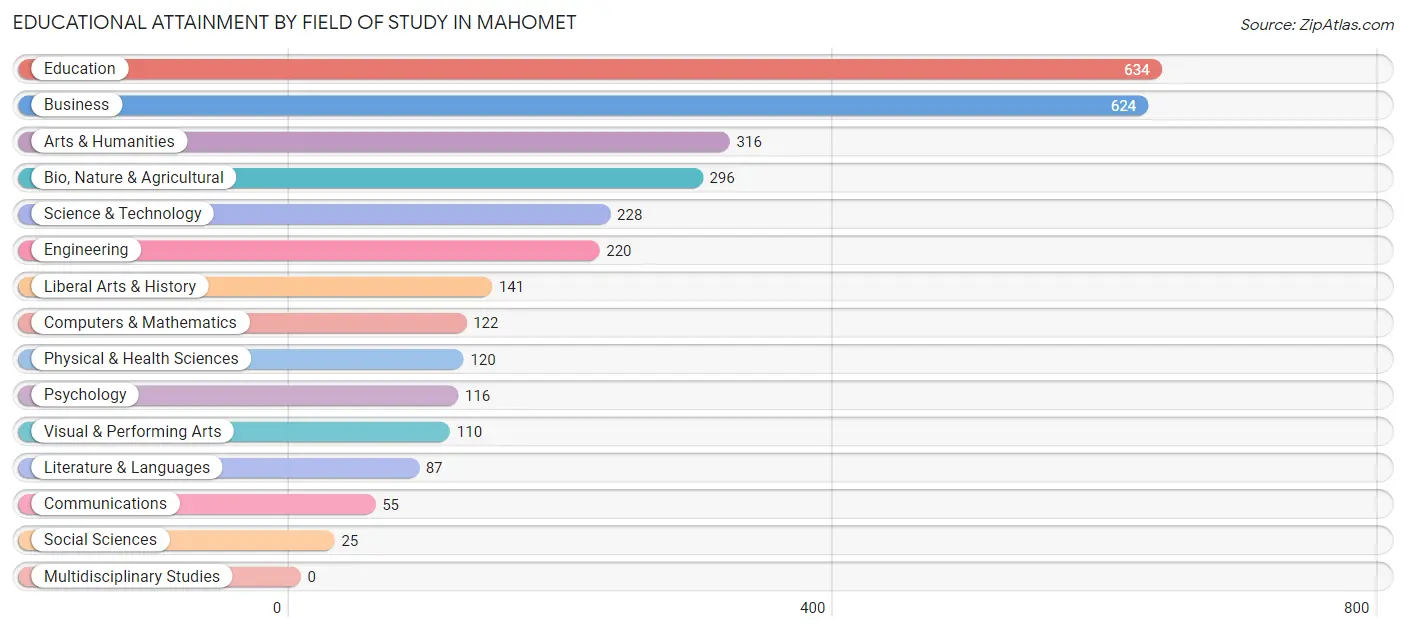
| Field of Study | # Graduates | % Graduates |
| Computers & Mathematics | 122 | 3.9% |
| Bio, Nature & Agricultural | 296 | 9.6% |
| Physical & Health Sciences | 120 | 3.9% |
| Psychology | 116 | 3.7% |
| Social Sciences | 25 | 0.8% |
| Engineering | 220 | 7.1% |
| Multidisciplinary Studies | 0 | 0.0% |
| Science & Technology | 228 | 7.4% |
| Business | 624 | 20.2% |
| Education | 634 | 20.5% |
| Literature & Languages | 87 | 2.8% |
| Liberal Arts & History | 141 | 4.6% |
| Visual & Performing Arts | 110 | 3.6% |
| Communications | 55 | 1.8% |
| Arts & Humanities | 316 | 10.2% |
| Total | 3,094 | 100.0% |
Transportation & Commute in Mahomet
Vehicle Availability by Sex in Mahomet
The most prevalent vehicle ownership categories in Mahomet are males with 2 vehicles (1,244, accounting for 48.0%) and females with 2 vehicles (847, making up 58.4%).
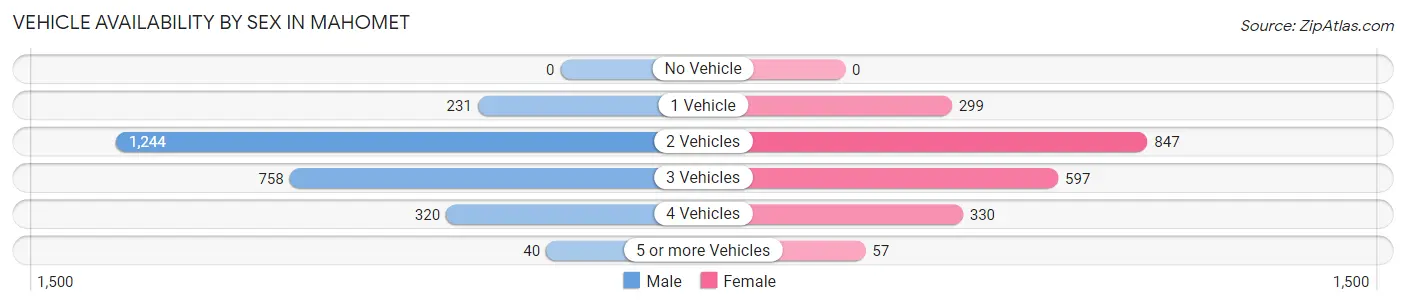
| Vehicles Available | Male | Female |
| No Vehicle | 0 (0.0%) | 0 (0.0%) |
| 1 Vehicle | 231 (8.9%) | 299 (14.0%) |
| 2 Vehicles | 1,244 (48.0%) | 847 (39.8%) |
| 3 Vehicles | 758 (29.2%) | 597 (28.0%) |
| 4 Vehicles | 320 (12.3%) | 330 (15.5%) |
| 5 or more Vehicles | 40 (1.5%) | 57 (2.7%) |
| Total | 2,593 (100.0%) | 2,130 (100.0%) |
Commute Time in Mahomet
The most frequently occuring commute durations in Mahomet are 15 to 19 minutes (1,249 commuters, 30.2%), 20 to 24 minutes (845 commuters, 20.4%), and 25 to 29 minutes (573 commuters, 13.8%).

| Commute Time | # Commuters | % Commuters |
| Less than 5 Minutes | 141 | 3.4% |
| 5 to 9 Minutes | 437 | 10.6% |
| 10 to 14 Minutes | 199 | 4.8% |
| 15 to 19 Minutes | 1,249 | 30.2% |
| 20 to 24 Minutes | 845 | 20.4% |
| 25 to 29 Minutes | 573 | 13.8% |
| 30 to 34 Minutes | 432 | 10.4% |
| 35 to 39 Minutes | 32 | 0.8% |
| 40 to 44 Minutes | 31 | 0.7% |
| 45 to 59 Minutes | 113 | 2.7% |
| 60 to 89 Minutes | 45 | 1.1% |
| 90 or more Minutes | 43 | 1.0% |
Commute Time by Sex in Mahomet
The most common commute times in Mahomet are 15 to 19 minutes (586 commuters, 26.3%) for males and 15 to 19 minutes (663 commuters, 34.7%) for females.
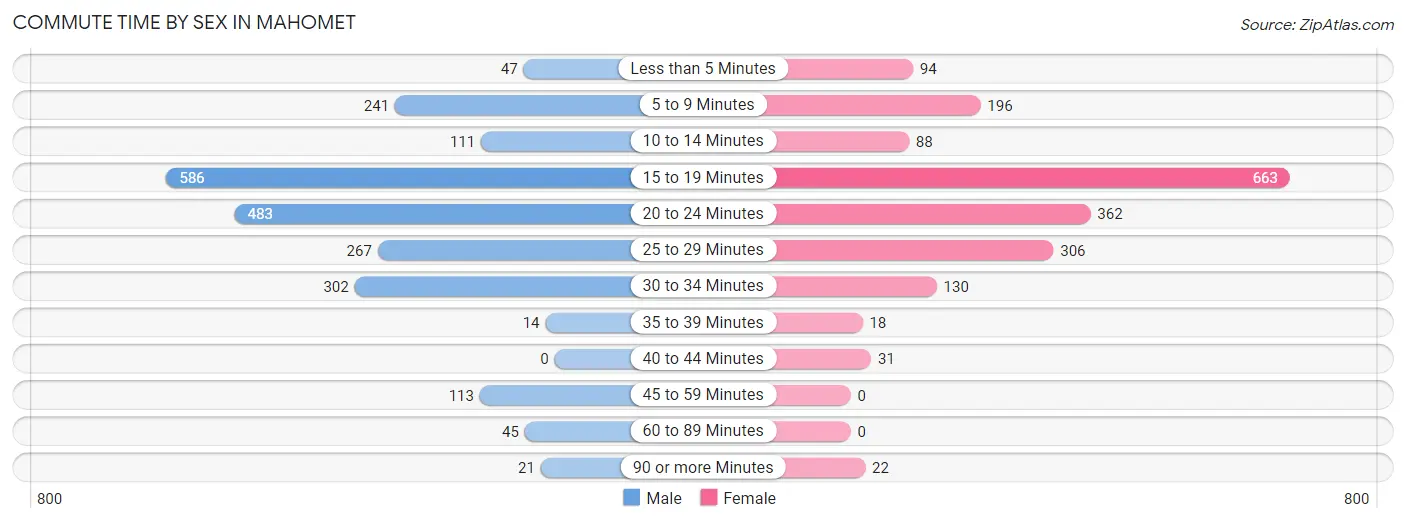
| Commute Time | Male | Female |
| Less than 5 Minutes | 47 (2.1%) | 94 (4.9%) |
| 5 to 9 Minutes | 241 (10.8%) | 196 (10.3%) |
| 10 to 14 Minutes | 111 (5.0%) | 88 (4.6%) |
| 15 to 19 Minutes | 586 (26.3%) | 663 (34.7%) |
| 20 to 24 Minutes | 483 (21.7%) | 362 (19.0%) |
| 25 to 29 Minutes | 267 (12.0%) | 306 (16.0%) |
| 30 to 34 Minutes | 302 (13.5%) | 130 (6.8%) |
| 35 to 39 Minutes | 14 (0.6%) | 18 (0.9%) |
| 40 to 44 Minutes | 0 (0.0%) | 31 (1.6%) |
| 45 to 59 Minutes | 113 (5.1%) | 0 (0.0%) |
| 60 to 89 Minutes | 45 (2.0%) | 0 (0.0%) |
| 90 or more Minutes | 21 (0.9%) | 22 (1.1%) |
Time of Departure to Work by Sex in Mahomet
The most frequent times of departure to work in Mahomet are 7:30 AM to 7:59 AM (402, 18.0%) for males and 8:00 AM to 8:29 AM (444, 23.3%) for females.
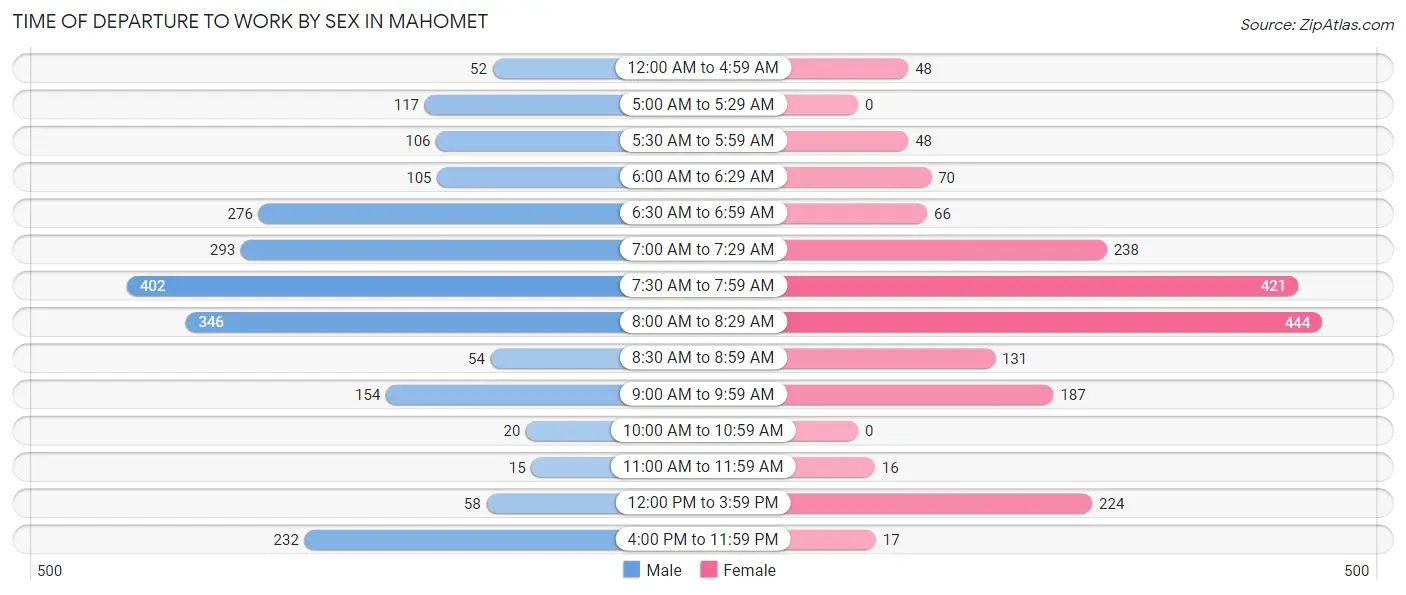
| Time of Departure | Male | Female |
| 12:00 AM to 4:59 AM | 52 (2.3%) | 48 (2.5%) |
| 5:00 AM to 5:29 AM | 117 (5.2%) | 0 (0.0%) |
| 5:30 AM to 5:59 AM | 106 (4.8%) | 48 (2.5%) |
| 6:00 AM to 6:29 AM | 105 (4.7%) | 70 (3.7%) |
| 6:30 AM to 6:59 AM | 276 (12.4%) | 66 (3.5%) |
| 7:00 AM to 7:29 AM | 293 (13.1%) | 238 (12.5%) |
| 7:30 AM to 7:59 AM | 402 (18.0%) | 421 (22.0%) |
| 8:00 AM to 8:29 AM | 346 (15.5%) | 444 (23.3%) |
| 8:30 AM to 8:59 AM | 54 (2.4%) | 131 (6.9%) |
| 9:00 AM to 9:59 AM | 154 (6.9%) | 187 (9.8%) |
| 10:00 AM to 10:59 AM | 20 (0.9%) | 0 (0.0%) |
| 11:00 AM to 11:59 AM | 15 (0.7%) | 16 (0.8%) |
| 12:00 PM to 3:59 PM | 58 (2.6%) | 224 (11.7%) |
| 4:00 PM to 11:59 PM | 232 (10.4%) | 17 (0.9%) |
| Total | 2,230 (100.0%) | 1,910 (100.0%) |
Housing Occupancy in Mahomet
Occupancy by Ownership in Mahomet
Of the total 3,150 dwellings in Mahomet, owner-occupied units account for 2,672 (84.8%), while renter-occupied units make up 478 (15.2%).

| Occupancy | # Housing Units | % Housing Units |
| Owner Occupied Housing Units | 2,672 | 84.8% |
| Renter-Occupied Housing Units | 478 | 15.2% |
| Total Occupied Housing Units | 3,150 | 100.0% |
Occupancy by Household Size in Mahomet
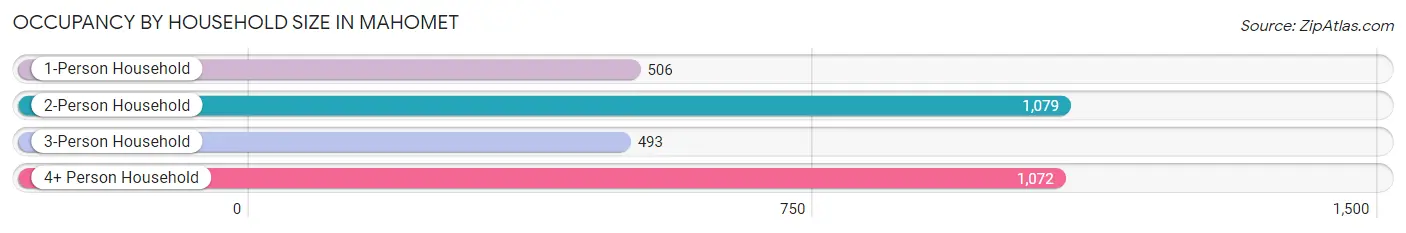
| Household Size | # Housing Units | % Housing Units |
| 1-Person Household | 506 | 16.1% |
| 2-Person Household | 1,079 | 34.3% |
| 3-Person Household | 493 | 15.7% |
| 4+ Person Household | 1,072 | 34.0% |
| Total Housing Units | 3,150 | 100.0% |
Occupancy by Ownership by Household Size in Mahomet
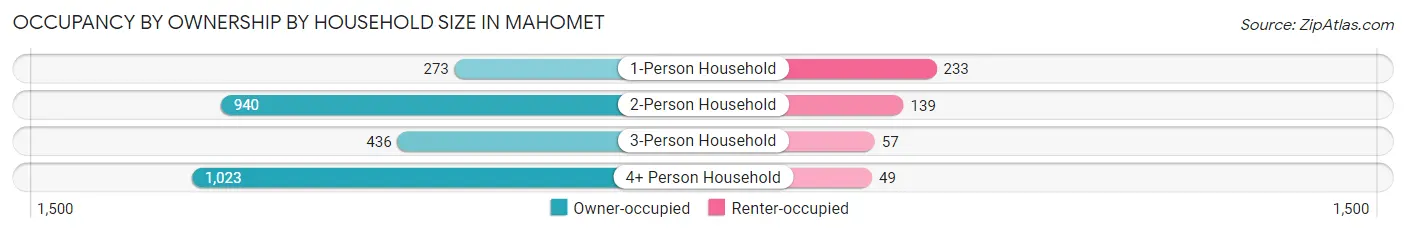
| Household Size | Owner-occupied | Renter-occupied |
| 1-Person Household | 273 (53.9%) | 233 (46.1%) |
| 2-Person Household | 940 (87.1%) | 139 (12.9%) |
| 3-Person Household | 436 (88.4%) | 57 (11.6%) |
| 4+ Person Household | 1,023 (95.4%) | 49 (4.6%) |
| Total Housing Units | 2,672 (84.8%) | 478 (15.2%) |
Occupancy by Educational Attainment in Mahomet

| Household Size | Owner-occupied | Renter-occupied |
| Less than High School | 24 (49.0%) | 25 (51.0%) |
| High School Diploma | 239 (67.1%) | 117 (32.9%) |
| College/Associate Degree | 827 (92.2%) | 70 (7.8%) |
| Bachelor's Degree or higher | 1,582 (85.6%) | 266 (14.4%) |
Occupancy by Age of Householder in Mahomet

| Age Bracket | # Households | % Households |
| Under 35 Years | 435 | 13.8% |
| 35 to 44 Years | 922 | 29.3% |
| 45 to 54 Years | 559 | 17.7% |
| 55 to 64 Years | 722 | 22.9% |
| 65 to 74 Years | 378 | 12.0% |
| 75 to 84 Years | 61 | 1.9% |
| 85 Years and Over | 73 | 2.3% |
| Total | 3,150 | 100.0% |
Housing Finances in Mahomet
Median Income by Occupancy in Mahomet
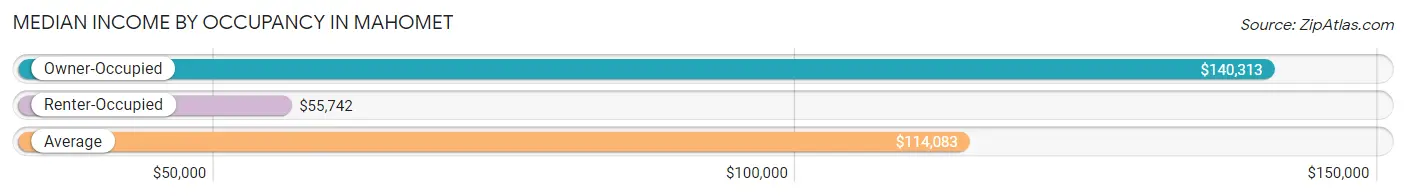
| Occupancy Type | # Households | Median Income |
| Owner-Occupied | 2,672 (84.8%) | $140,313 |
| Renter-Occupied | 478 (15.2%) | $55,742 |
| Average | 3,150 (100.0%) | $114,083 |
Occupancy by Householder Income Bracket in Mahomet
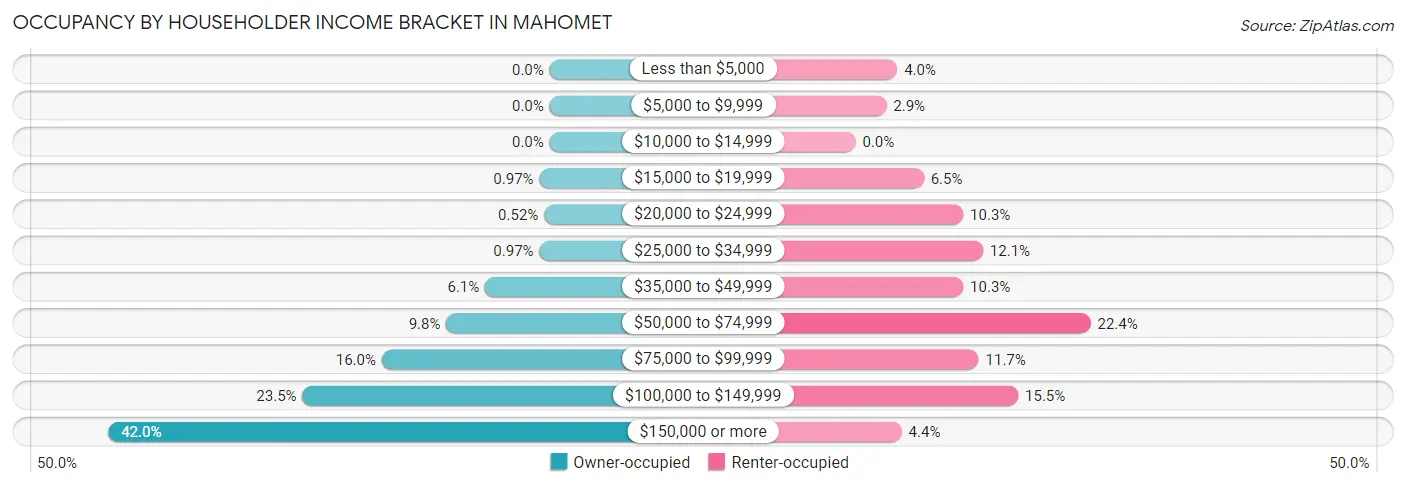
| Income Bracket | Owner-occupied | Renter-occupied |
| Less than $5,000 | 0 (0.0%) | 19 (4.0%) |
| $5,000 to $9,999 | 0 (0.0%) | 14 (2.9%) |
| $10,000 to $14,999 | 0 (0.0%) | 0 (0.0%) |
| $15,000 to $19,999 | 26 (1.0%) | 31 (6.5%) |
| $20,000 to $24,999 | 14 (0.5%) | 49 (10.2%) |
| $25,000 to $34,999 | 26 (1.0%) | 58 (12.1%) |
| $35,000 to $49,999 | 164 (6.1%) | 49 (10.2%) |
| $50,000 to $74,999 | 263 (9.8%) | 107 (22.4%) |
| $75,000 to $99,999 | 427 (16.0%) | 56 (11.7%) |
| $100,000 to $149,999 | 629 (23.5%) | 74 (15.5%) |
| $150,000 or more | 1,123 (42.0%) | 21 (4.4%) |
| Total | 2,672 (100.0%) | 478 (100.0%) |
Monthly Housing Cost Tiers in Mahomet
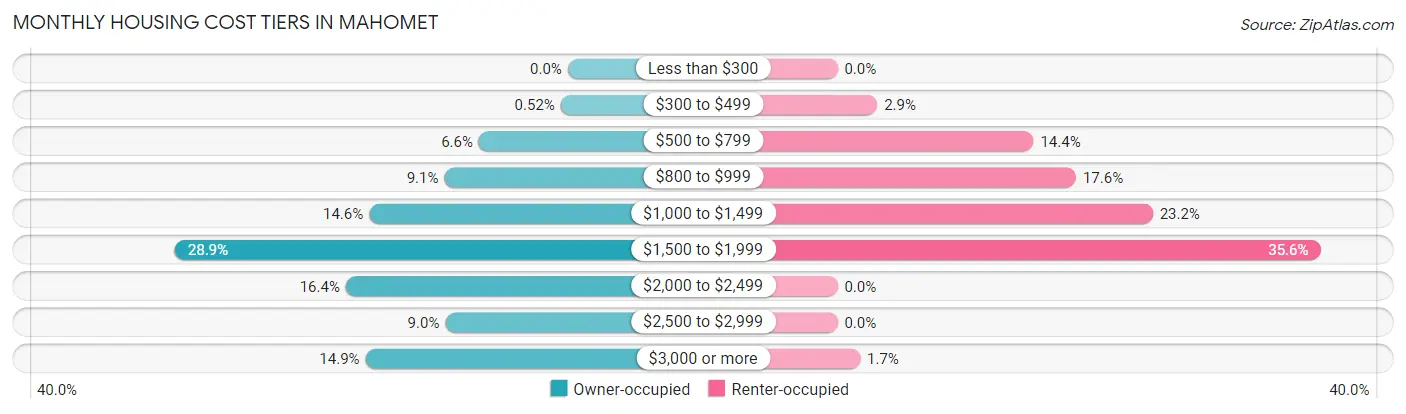
| Monthly Cost | Owner-occupied | Renter-occupied |
| Less than $300 | 0 (0.0%) | 0 (0.0%) |
| $300 to $499 | 14 (0.5%) | 14 (2.9%) |
| $500 to $799 | 175 (6.6%) | 69 (14.4%) |
| $800 to $999 | 243 (9.1%) | 84 (17.6%) |
| $1,000 to $1,499 | 391 (14.6%) | 111 (23.2%) |
| $1,500 to $1,999 | 773 (28.9%) | 170 (35.6%) |
| $2,000 to $2,499 | 437 (16.4%) | 0 (0.0%) |
| $2,500 to $2,999 | 241 (9.0%) | 0 (0.0%) |
| $3,000 or more | 398 (14.9%) | 8 (1.7%) |
| Total | 2,672 (100.0%) | 478 (100.0%) |
Physical Housing Characteristics in Mahomet
Housing Structures in Mahomet
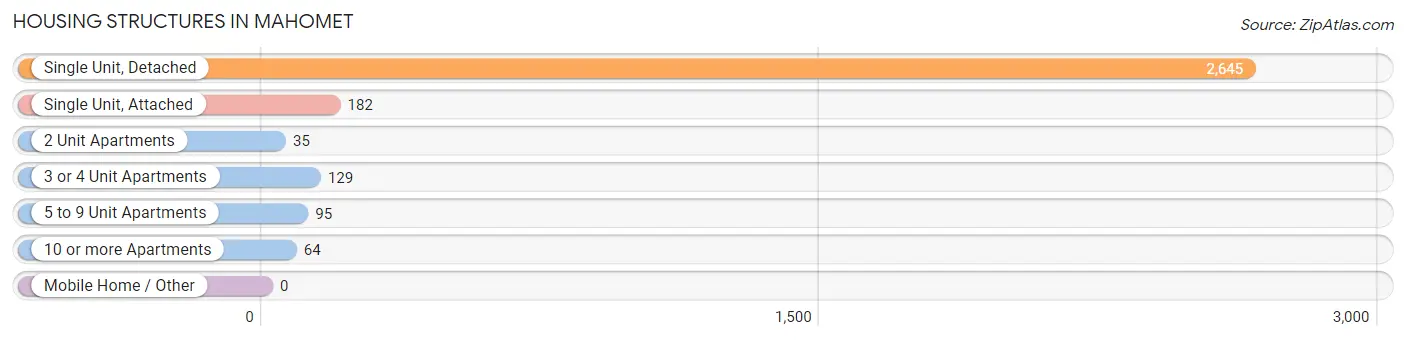
| Structure Type | # Housing Units | % Housing Units |
| Single Unit, Detached | 2,645 | 84.0% |
| Single Unit, Attached | 182 | 5.8% |
| 2 Unit Apartments | 35 | 1.1% |
| 3 or 4 Unit Apartments | 129 | 4.1% |
| 5 to 9 Unit Apartments | 95 | 3.0% |
| 10 or more Apartments | 64 | 2.0% |
| Mobile Home / Other | 0 | 0.0% |
| Total | 3,150 | 100.0% |
Housing Structures by Occupancy in Mahomet
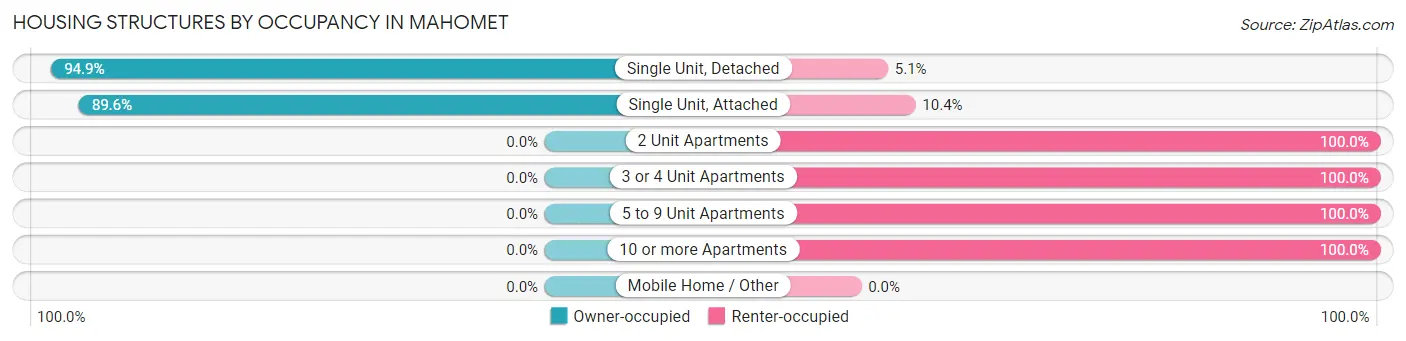
| Structure Type | Owner-occupied | Renter-occupied |
| Single Unit, Detached | 2,509 (94.9%) | 136 (5.1%) |
| Single Unit, Attached | 163 (89.6%) | 19 (10.4%) |
| 2 Unit Apartments | 0 (0.0%) | 35 (100.0%) |
| 3 or 4 Unit Apartments | 0 (0.0%) | 129 (100.0%) |
| 5 to 9 Unit Apartments | 0 (0.0%) | 95 (100.0%) |
| 10 or more Apartments | 0 (0.0%) | 64 (100.0%) |
| Mobile Home / Other | 0 (0.0%) | 0 (0.0%) |
| Total | 2,672 (84.8%) | 478 (15.2%) |
Housing Structures by Number of Rooms in Mahomet
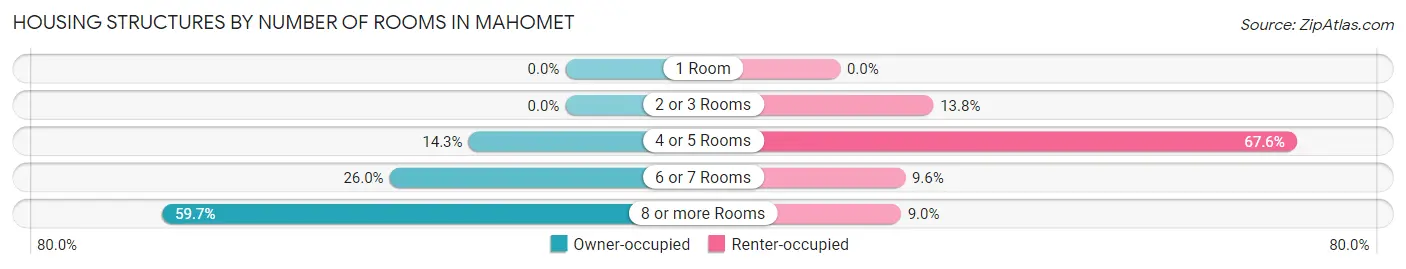
| Number of Rooms | Owner-occupied | Renter-occupied |
| 1 Room | 0 (0.0%) | 0 (0.0%) |
| 2 or 3 Rooms | 0 (0.0%) | 66 (13.8%) |
| 4 or 5 Rooms | 383 (14.3%) | 323 (67.6%) |
| 6 or 7 Rooms | 695 (26.0%) | 46 (9.6%) |
| 8 or more Rooms | 1,594 (59.7%) | 43 (9.0%) |
| Total | 2,672 (100.0%) | 478 (100.0%) |
Housing Structure by Heating Type in Mahomet
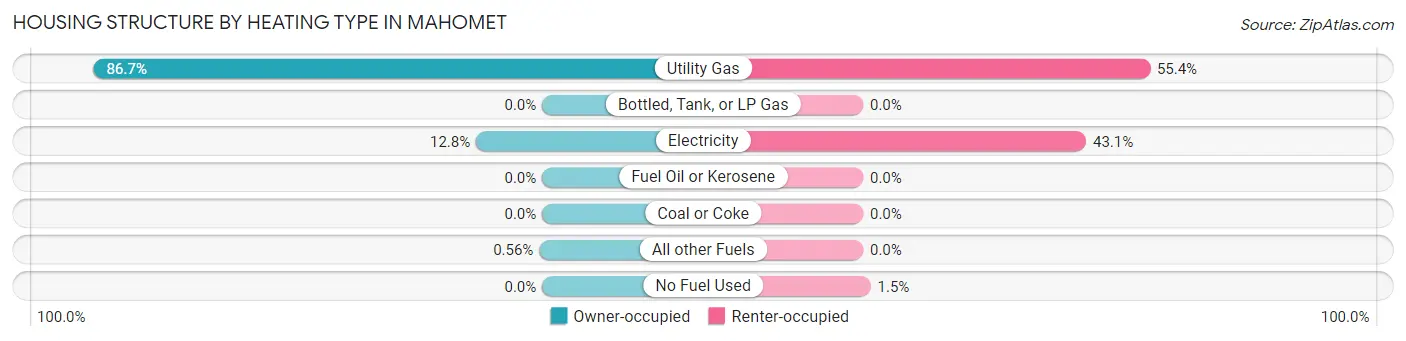
| Heating Type | Owner-occupied | Renter-occupied |
| Utility Gas | 2,316 (86.7%) | 265 (55.4%) |
| Bottled, Tank, or LP Gas | 0 (0.0%) | 0 (0.0%) |
| Electricity | 341 (12.8%) | 206 (43.1%) |
| Fuel Oil or Kerosene | 0 (0.0%) | 0 (0.0%) |
| Coal or Coke | 0 (0.0%) | 0 (0.0%) |
| All other Fuels | 15 (0.6%) | 0 (0.0%) |
| No Fuel Used | 0 (0.0%) | 7 (1.5%) |
| Total | 2,672 (100.0%) | 478 (100.0%) |
Household Vehicle Usage in Mahomet
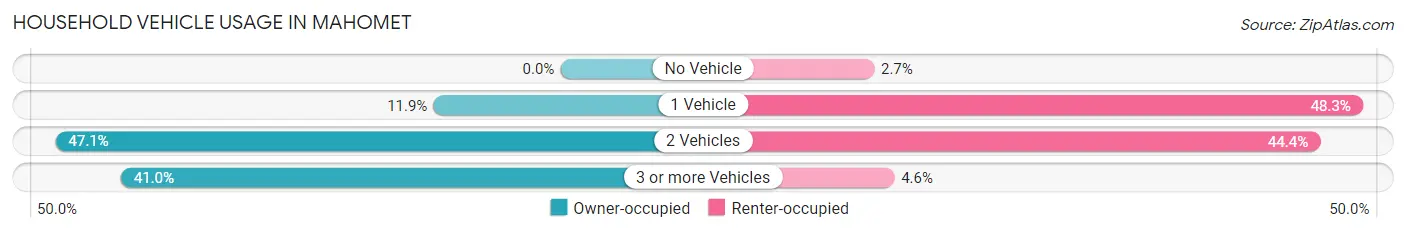
| Vehicles per Household | Owner-occupied | Renter-occupied |
| No Vehicle | 0 (0.0%) | 13 (2.7%) |
| 1 Vehicle | 317 (11.9%) | 231 (48.3%) |
| 2 Vehicles | 1,259 (47.1%) | 212 (44.4%) |
| 3 or more Vehicles | 1,096 (41.0%) | 22 (4.6%) |
| Total | 2,672 (100.0%) | 478 (100.0%) |
Real Estate & Mortgages in Mahomet
Real Estate and Mortgage Overview in Mahomet
| Characteristic | Without Mortgage | With Mortgage |
| Housing Units | 568 | 2,104 |
| Median Property Value | $264,000 | $282,700 |
| Median Household Income | $85,610 | $1,019 |
| Monthly Housing Costs | $878 | $398 |
| Real Estate Taxes | $5,521 | $8 |
Property Value by Mortgage Status in Mahomet
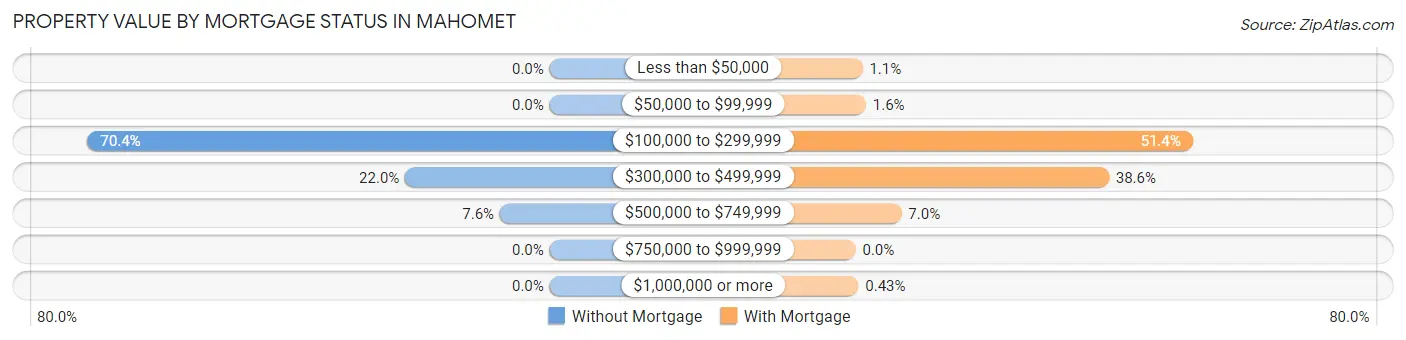
| Property Value | Without Mortgage | With Mortgage |
| Less than $50,000 | 0 (0.0%) | 22 (1.1%) |
| $50,000 to $99,999 | 0 (0.0%) | 33 (1.6%) |
| $100,000 to $299,999 | 400 (70.4%) | 1,081 (51.4%) |
| $300,000 to $499,999 | 125 (22.0%) | 812 (38.6%) |
| $500,000 to $749,999 | 43 (7.6%) | 147 (7.0%) |
| $750,000 to $999,999 | 0 (0.0%) | 0 (0.0%) |
| $1,000,000 or more | 0 (0.0%) | 9 (0.4%) |
| Total | 568 (100.0%) | 2,104 (100.0%) |
Household Income by Mortgage Status in Mahomet
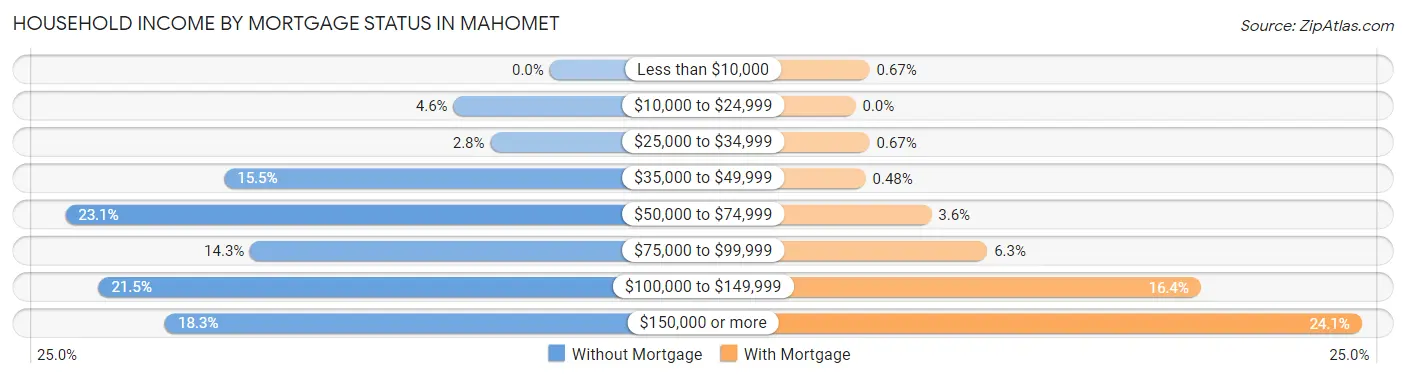
| Household Income | Without Mortgage | With Mortgage |
| Less than $10,000 | 0 (0.0%) | 14 (0.7%) |
| $10,000 to $24,999 | 26 (4.6%) | 0 (0.0%) |
| $25,000 to $34,999 | 16 (2.8%) | 14 (0.7%) |
| $35,000 to $49,999 | 88 (15.5%) | 10 (0.5%) |
| $50,000 to $74,999 | 131 (23.1%) | 76 (3.6%) |
| $75,000 to $99,999 | 81 (14.3%) | 132 (6.3%) |
| $100,000 to $149,999 | 122 (21.5%) | 346 (16.4%) |
| $150,000 or more | 104 (18.3%) | 507 (24.1%) |
| Total | 568 (100.0%) | 2,104 (100.0%) |
Property Value to Household Income Ratio in Mahomet
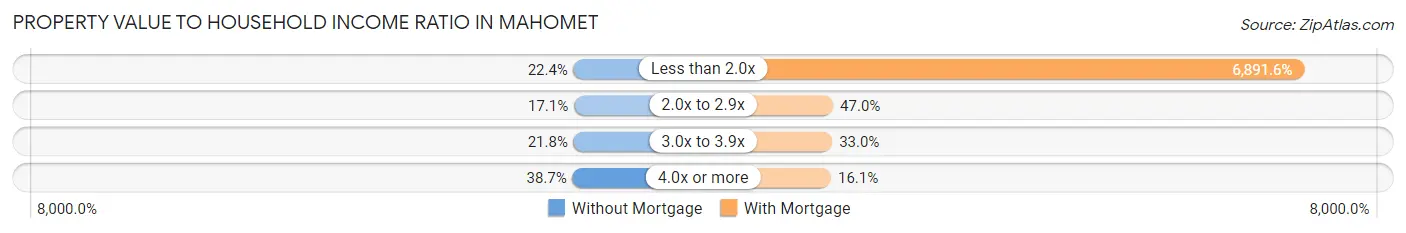
| Value-to-Income Ratio | Without Mortgage | With Mortgage |
| Less than 2.0x | 127 (22.4%) | 145,000 (6,891.6%) |
| 2.0x to 2.9x | 97 (17.1%) | 988 (47.0%) |
| 3.0x to 3.9x | 124 (21.8%) | 695 (33.0%) |
| 4.0x or more | 220 (38.7%) | 339 (16.1%) |
| Total | 568 (100.0%) | 2,104 (100.0%) |
Real Estate Taxes by Mortgage Status in Mahomet
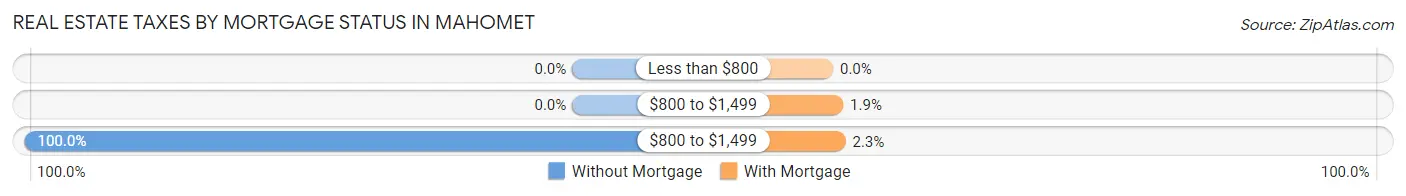
| Property Taxes | Without Mortgage | With Mortgage |
| Less than $800 | 0 (0.0%) | 0 (0.0%) |
| $800 to $1,499 | 0 (0.0%) | 39 (1.8%) |
| $800 to $1,499 | 568 (100.0%) | 48 (2.3%) |
| Total | 568 (100.0%) | 2,104 (100.0%) |
Health & Disability in Mahomet
Health Insurance Coverage by Age in Mahomet
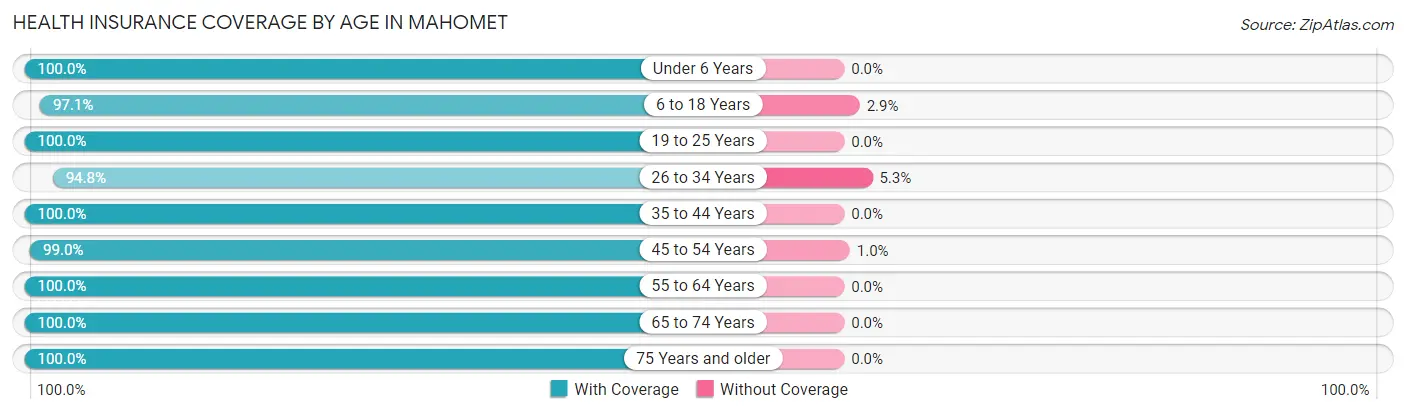
| Age Bracket | With Coverage | Without Coverage |
| Under 6 Years | 857 (100.0%) | 0 (0.0%) |
| 6 to 18 Years | 2,256 (97.1%) | 67 (2.9%) |
| 19 to 25 Years | 678 (100.0%) | 0 (0.0%) |
| 26 to 34 Years | 614 (94.8%) | 34 (5.2%) |
| 35 to 44 Years | 1,825 (100.0%) | 0 (0.0%) |
| 45 to 54 Years | 1,139 (99.0%) | 12 (1.0%) |
| 55 to 64 Years | 1,260 (100.0%) | 0 (0.0%) |
| 65 to 74 Years | 609 (100.0%) | 0 (0.0%) |
| 75 Years and older | 194 (100.0%) | 0 (0.0%) |
| Total | 9,432 (98.8%) | 113 (1.2%) |
Health Insurance Coverage by Citizenship Status in Mahomet
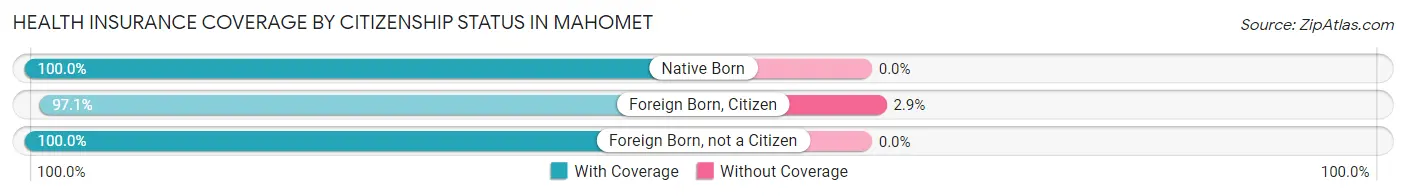
| Citizenship Status | With Coverage | Without Coverage |
| Native Born | 857 (100.0%) | 0 (0.0%) |
| Foreign Born, Citizen | 2,256 (97.1%) | 67 (2.9%) |
| Foreign Born, not a Citizen | 678 (100.0%) | 0 (0.0%) |
Health Insurance Coverage by Household Income in Mahomet
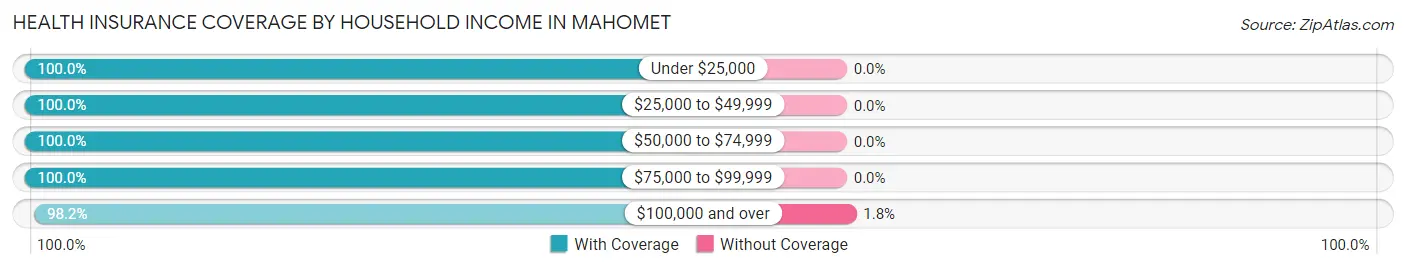
| Household Income | With Coverage | Without Coverage |
| Under $25,000 | 310 (100.0%) | 0 (0.0%) |
| $25,000 to $49,999 | 628 (100.0%) | 0 (0.0%) |
| $50,000 to $74,999 | 876 (100.0%) | 0 (0.0%) |
| $75,000 to $99,999 | 1,397 (100.0%) | 0 (0.0%) |
| $100,000 and over | 6,216 (98.2%) | 113 (1.8%) |
Public vs Private Health Insurance Coverage by Age in Mahomet
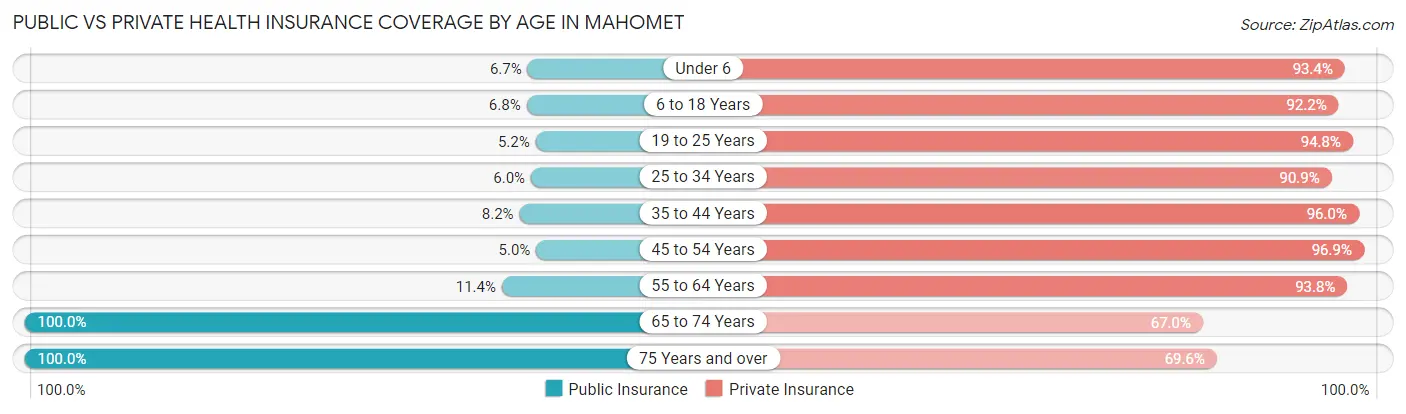
| Age Bracket | Public Insurance | Private Insurance |
| Under 6 | 57 (6.7%) | 800 (93.3%) |
| 6 to 18 Years | 159 (6.8%) | 2,142 (92.2%) |
| 19 to 25 Years | 35 (5.2%) | 643 (94.8%) |
| 25 to 34 Years | 39 (6.0%) | 589 (90.9%) |
| 35 to 44 Years | 149 (8.2%) | 1,751 (96.0%) |
| 45 to 54 Years | 58 (5.0%) | 1,115 (96.9%) |
| 55 to 64 Years | 144 (11.4%) | 1,182 (93.8%) |
| 65 to 74 Years | 609 (100.0%) | 408 (67.0%) |
| 75 Years and over | 194 (100.0%) | 135 (69.6%) |
| Total | 1,444 (15.1%) | 8,765 (91.8%) |
Disability Status by Sex by Age in Mahomet
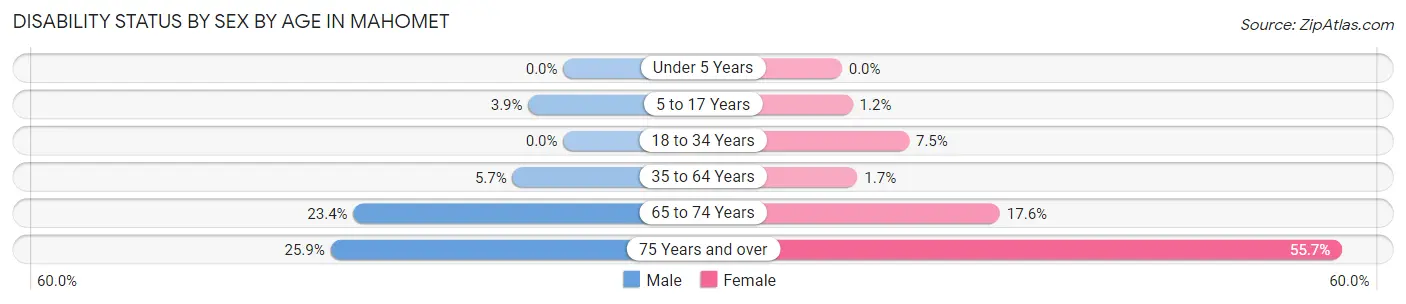
| Age Bracket | Male | Female |
| Under 5 Years | 0 (0.0%) | 0 (0.0%) |
| 5 to 17 Years | 42 (3.9%) | 15 (1.2%) |
| 18 to 34 Years | 0 (0.0%) | 53 (7.5%) |
| 35 to 64 Years | 116 (5.7%) | 38 (1.7%) |
| 65 to 74 Years | 76 (23.4%) | 50 (17.6%) |
| 75 Years and over | 14 (25.9%) | 78 (55.7%) |
Disability Class by Sex by Age in Mahomet
Disability Class: Hearing Difficulty
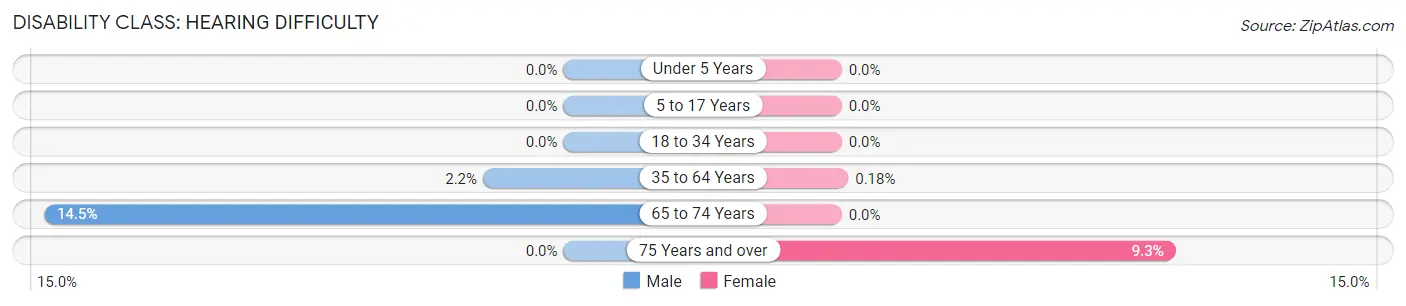
| Age Bracket | Male | Female |
| Under 5 Years | 0 (0.0%) | 0 (0.0%) |
| 5 to 17 Years | 0 (0.0%) | 0 (0.0%) |
| 18 to 34 Years | 0 (0.0%) | 0 (0.0%) |
| 35 to 64 Years | 46 (2.2%) | 4 (0.2%) |
| 65 to 74 Years | 47 (14.5%) | 0 (0.0%) |
| 75 Years and over | 0 (0.0%) | 13 (9.3%) |
Disability Class: Vision Difficulty
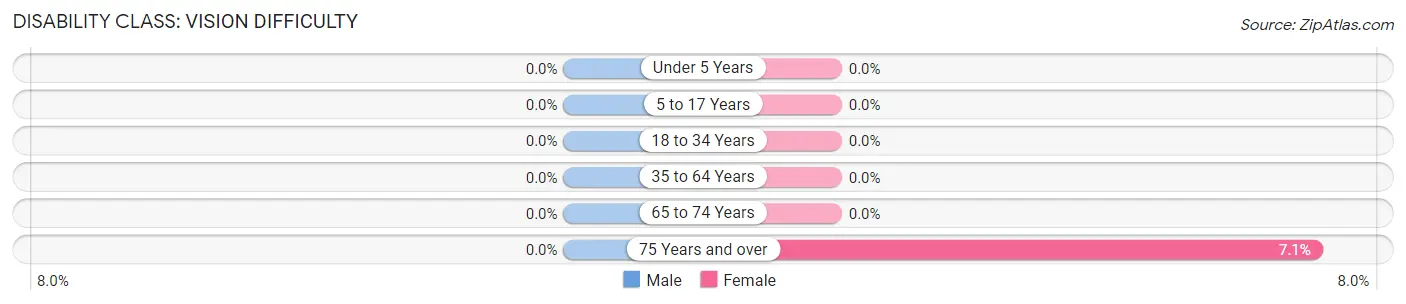
| Age Bracket | Male | Female |
| Under 5 Years | 0 (0.0%) | 0 (0.0%) |
| 5 to 17 Years | 0 (0.0%) | 0 (0.0%) |
| 18 to 34 Years | 0 (0.0%) | 0 (0.0%) |
| 35 to 64 Years | 0 (0.0%) | 0 (0.0%) |
| 65 to 74 Years | 0 (0.0%) | 0 (0.0%) |
| 75 Years and over | 0 (0.0%) | 10 (7.1%) |
Disability Class: Cognitive Difficulty
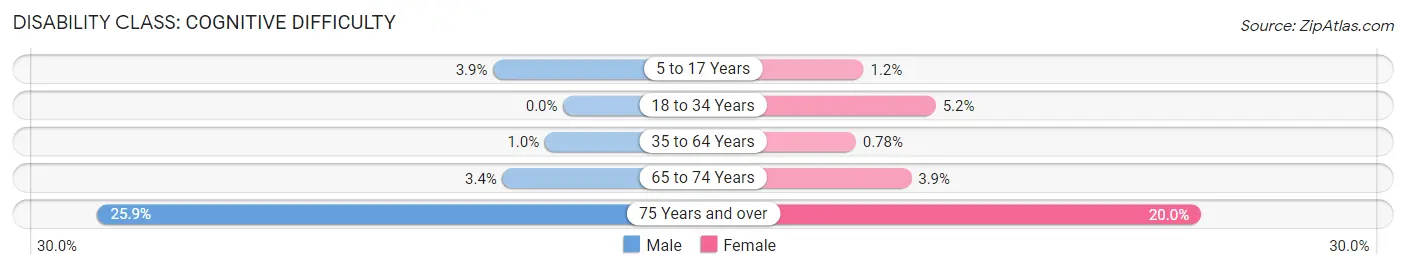
| Age Bracket | Male | Female |
| 5 to 17 Years | 42 (3.9%) | 15 (1.2%) |
| 18 to 34 Years | 0 (0.0%) | 37 (5.2%) |
| 35 to 64 Years | 21 (1.0%) | 17 (0.8%) |
| 65 to 74 Years | 11 (3.4%) | 11 (3.9%) |
| 75 Years and over | 14 (25.9%) | 28 (20.0%) |
Disability Class: Ambulatory Difficulty

| Age Bracket | Male | Female |
| 5 to 17 Years | 0 (0.0%) | 0 (0.0%) |
| 18 to 34 Years | 0 (0.0%) | 16 (2.3%) |
| 35 to 64 Years | 65 (3.2%) | 17 (0.8%) |
| 65 to 74 Years | 18 (5.5%) | 39 (13.7%) |
| 75 Years and over | 14 (25.9%) | 78 (55.7%) |
Disability Class: Self-Care Difficulty
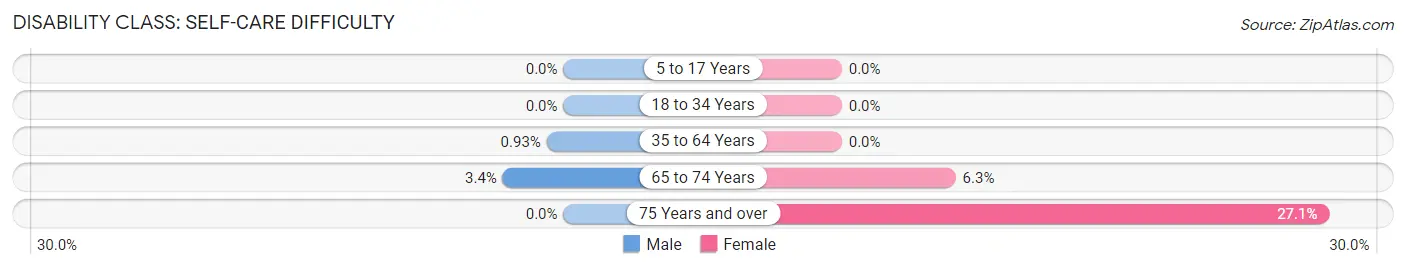
| Age Bracket | Male | Female |
| 5 to 17 Years | 0 (0.0%) | 0 (0.0%) |
| 18 to 34 Years | 0 (0.0%) | 0 (0.0%) |
| 35 to 64 Years | 19 (0.9%) | 0 (0.0%) |
| 65 to 74 Years | 11 (3.4%) | 18 (6.3%) |
| 75 Years and over | 0 (0.0%) | 38 (27.1%) |
Technology Access in Mahomet
Computing Device Access in Mahomet
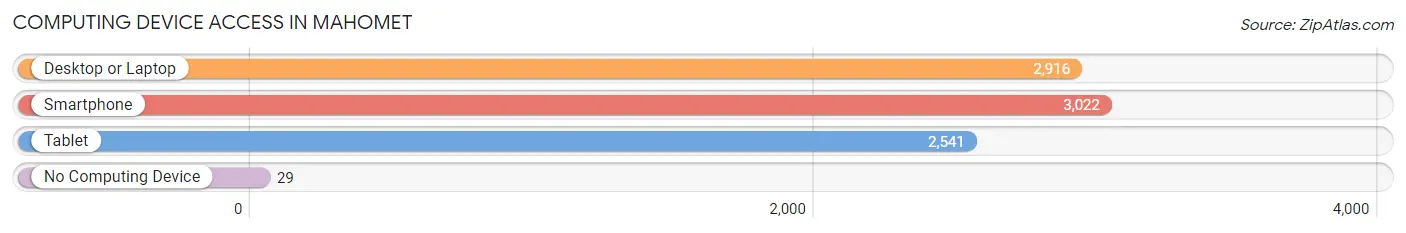
| Device Type | # Households | % Households |
| Desktop or Laptop | 2,916 | 92.6% |
| Smartphone | 3,022 | 95.9% |
| Tablet | 2,541 | 80.7% |
| No Computing Device | 29 | 0.9% |
| Total | 3,150 | 100.0% |
Internet Access in Mahomet
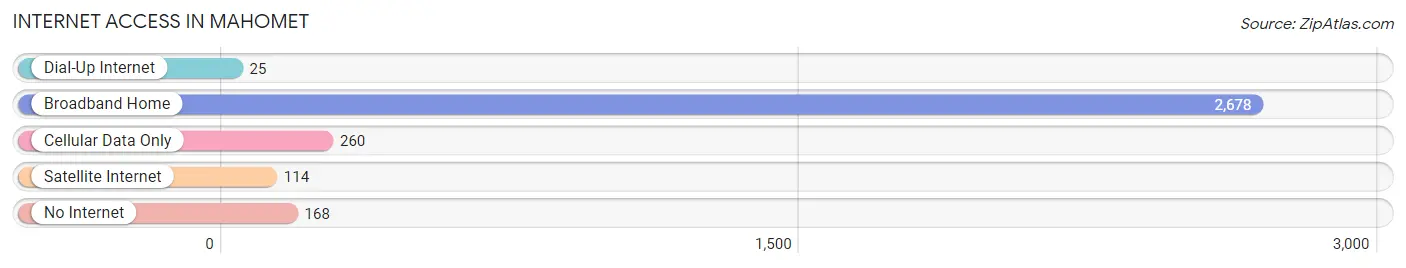
| Internet Type | # Households | % Households |
| Dial-Up Internet | 25 | 0.8% |
| Broadband Home | 2,678 | 85.0% |
| Cellular Data Only | 260 | 8.3% |
| Satellite Internet | 114 | 3.6% |
| No Internet | 168 | 5.3% |
| Total | 3,150 | 100.0% |
Mahomet Summary
Mohomet, Illinois is a small village located in Champaign County, Illinois. It is situated about 25 miles south of Champaign and about 15 miles east of Urbana. The population of Mohomet was 1,845 in the 2010 census.
History
The area that is now Mohomet was first settled in the early 1800s by a group of settlers from North Carolina. The first settler was William H. Mohomet, who arrived in 1820. He was followed by other settlers from North Carolina, including his brother, John, and his father, William. The settlement was originally known as "Mohomet's Settlement" and was later changed to "Mohomet".
The village was officially incorporated in 1872. The first post office was established in 1873. The village was named after William H. Mohomet, who was the first settler in the area.
Geography
Mohomet is located in the eastern part of Champaign County, Illinois. It is situated about 25 miles south of Champaign and about 15 miles east of Urbana. The village is located on the banks of the Sangamon River. The terrain is mostly flat with some rolling hills.
The climate in Mohomet is typical of the Midwest, with hot summers and cold winters. The average temperature in the summer is around 80 degrees Fahrenheit, and the average temperature in the winter is around 20 degrees Fahrenheit.
Economy
The economy of Mohomet is largely based on agriculture. The village is home to several farms, including a dairy farm, a hog farm, and a grain farm. The village also has a few small businesses, including a grocery store, a hardware store, and a restaurant.
Demographics
As of the 2010 census, the population of Mohomet was 1,845. The racial makeup of the village was 97.3% White, 0.7% African American, 0.3% Native American, 0.2% Asian, 0.1% Pacific Islander, 0.4% from other races, and 1.0% from two or more races. Hispanic or Latino of any race were 1.3% of the population.
The median income for a household in Mohomet was $50,000, and the median income for a family was $54,000. The per capita income for the village was $20,000. About 8.3% of families and 10.2% of the population were below the poverty line, including 11.3% of those under age 18 and 8.2% of those age 65 or over.
Conclusion
Mohomet, Illinois is a small village located in Champaign County, Illinois. It is situated about 25 miles south of Champaign and about 15 miles east of Urbana. The population of Mohomet was 1,845 in the 2010 census. The economy of Mohomet is largely based on agriculture, and the village is home to several farms. The racial makeup of the village was 97.3% White, 0.7% African American, 0.3% Native American, 0.2% Asian, 0.1% Pacific Islander, 0.4% from other races, and 1.0% from two or more races. The median income for a household in Mohomet was $50,000, and the median income for a family was $54,000. The per capita income for the village was $20,000.
Common Questions
What is the Total Population of Mahomet?
Total Population of Mahomet is 9,545.
What is the Total Male Population of Mahomet?
Total Male Population of Mahomet is 4,733.
What is the Total Female Population of Mahomet?
Total Female Population of Mahomet is 4,812.
What is the Ratio of Males per 100 Females in Mahomet?
There are 98.36 Males per 100 Females in Mahomet.
What is the Ratio of Females per 100 Males in Mahomet?
There are 101.67 Females per 100 Males in Mahomet.
What is the Median Population Age in Mahomet?
Median Population Age in Mahomet is 37.1 Years.
What is the Average Family Size in Mahomet
Average Family Size in Mahomet is 3.4 People.
What is the Average Household Size in Mahomet
Average Household Size in Mahomet is 3.0 People.
What is Per Capita Income in Mahomet?
Per Capita income in Mahomet is $47,023.
What is the Median Family Income in Mahomet?
Median Family Income in Mahomet is $140,435.
What is the Median Household income in Mahomet?
Median Household Income in Mahomet is $114,083.
What is Income or Wage Gap in Mahomet?
Income or Wage Gap in Mahomet is 42.5%.
Women in Mahomet earn 57.5 cents for every dollar earned by a man.
What is Inequality or Gini Index in Mahomet?
Inequality or Gini Index in Mahomet is 0.37.
How Large is the Labor Force in Mahomet?
There are 4,794 People in the Labor Forcein in Mahomet.
What is the Percentage of People in the Labor Force in Mahomet?
69.9% of People are in the Labor Force in Mahomet.
What is the Unemployment Rate in Mahomet?
Unemployment Rate in Mahomet is 1.0%.