Blessing, TX
Blessing Map
Blessing Overview
337
TOTAL POPULATION
209
MALE POPULATION
128
FEMALE POPULATION
163.28
MALES / 100 FEMALES
61.24
FEMALES / 100 MALES
24.8
MEDIAN AGE
1.8
AVG FAMILY SIZE
1.6
AVG HOUSEHOLD SIZE
$20,556
PER CAPITA INCOME
$2,499
AVG FAMILY INCOME
0.59
INEQUALITY / GINI INDEX
130
LABOR FORCE [ PEOPLE ]
56.3%
PERCENT IN LABOR FORCE
Blessing Zip Codes
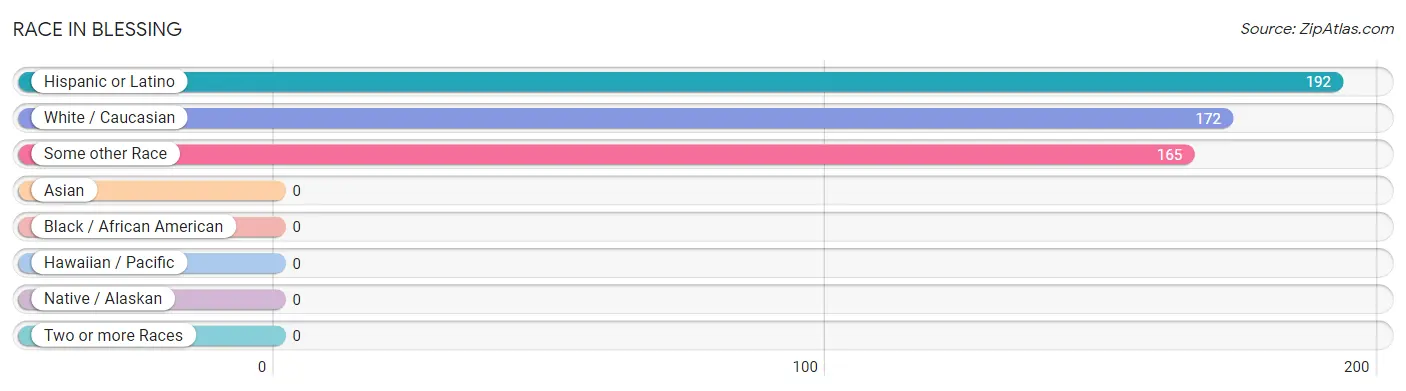
Race in Blessing
The most populous races in Blessing are Hispanic or Latino (192 | 57.0%), White / Caucasian (172 | 51.0%), and Some other Race (165 | 49.0%).
| Race | # Population | % Population |
| Asian | 0 | 0.0% |
| Black / African American | 0 | 0.0% |
| Hawaiian / Pacific | 0 | 0.0% |
| Hispanic or Latino | 192 | 57.0% |
| Native / Alaskan | 0 | 0.0% |
| White / Caucasian | 172 | 51.0% |
| Two or more Races | 0 | 0.0% |
| Some other Race | 165 | 49.0% |
| Total | 337 | 100.0% |
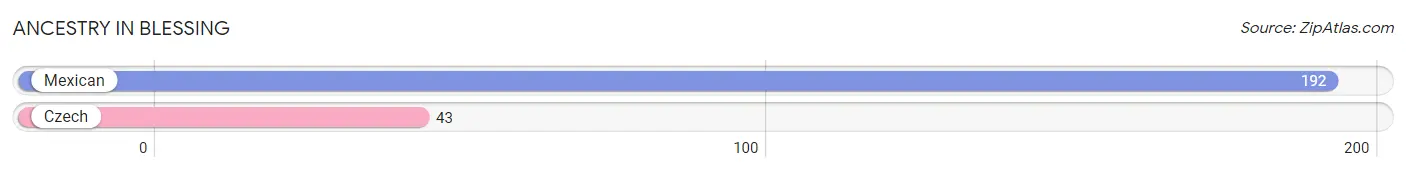
Ancestry in Blessing
The most populous ancestries reported in Blessing are Mexican (192 | 57.0%), and Czech (43 | 12.8%), together accounting for 69.7% of all Blessing residents.
| Ancestry | # Population | % Population |
| Czech | 43 | 12.8% |
| Mexican | 192 | 57.0% | View All 2 Rows |
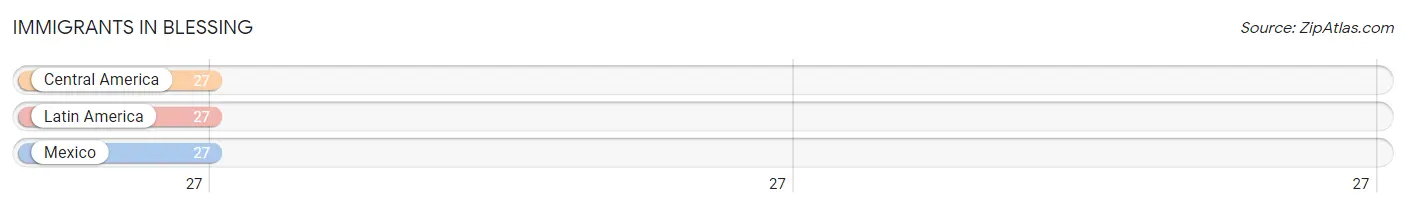
Immigrants in Blessing
The most numerous immigrant groups reported in Blessing came from Central America (27 | 8.0%), Latin America (27 | 8.0%), and Mexico (27 | 8.0%), together accounting for 24.0% of all Blessing residents.
| Immigration Origin | # Population | % Population |
| Central America | 27 | 8.0% |
| Latin America | 27 | 8.0% |
| Mexico | 27 | 8.0% | View All 3 Rows |
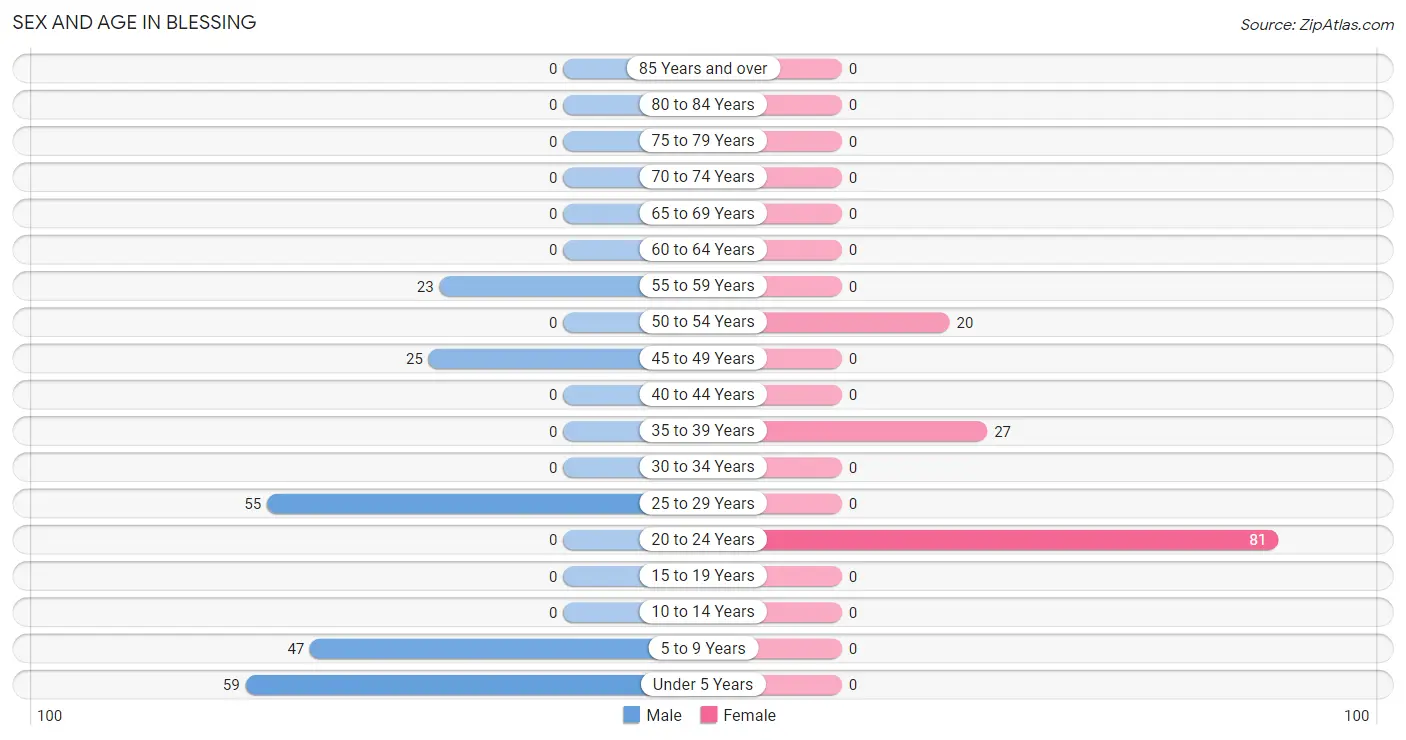
Sex and Age in Blessing
Sex and Age in Blessing
The most populous age groups in Blessing are Under 5 Years (59 | 28.2%) for men and 20 to 24 Years (81 | 63.3%) for women.
| Age Bracket | Male | Female |
| Under 5 Years | 59 (28.2%) | 0 (0.0%) |
| 5 to 9 Years | 47 (22.5%) | 0 (0.0%) |
| 10 to 14 Years | 0 (0.0%) | 0 (0.0%) |
| 15 to 19 Years | 0 (0.0%) | 0 (0.0%) |
| 20 to 24 Years | 0 (0.0%) | 81 (63.3%) |
| 25 to 29 Years | 55 (26.3%) | 0 (0.0%) |
| 30 to 34 Years | 0 (0.0%) | 0 (0.0%) |
| 35 to 39 Years | 0 (0.0%) | 27 (21.1%) |
| 40 to 44 Years | 0 (0.0%) | 0 (0.0%) |
| 45 to 49 Years | 25 (12.0%) | 0 (0.0%) |
| 50 to 54 Years | 0 (0.0%) | 20 (15.6%) |
| 55 to 59 Years | 23 (11.0%) | 0 (0.0%) |
| 60 to 64 Years | 0 (0.0%) | 0 (0.0%) |
| 65 to 69 Years | 0 (0.0%) | 0 (0.0%) |
| 70 to 74 Years | 0 (0.0%) | 0 (0.0%) |
| 75 to 79 Years | 0 (0.0%) | 0 (0.0%) |
| 80 to 84 Years | 0 (0.0%) | 0 (0.0%) |
| 85 Years and over | 0 (0.0%) | 0 (0.0%) |
| Total | 209 (100.0%) | 128 (100.0%) |
Families and Households in Blessing
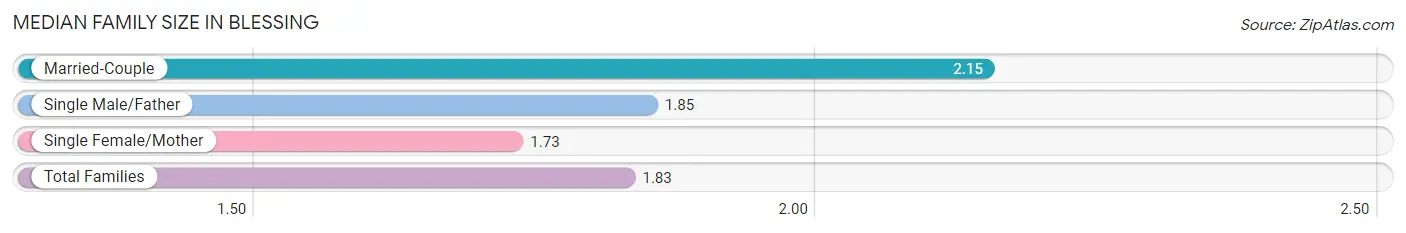
Median Family Size in Blessing
The median family size in Blessing is 1.83 persons per family, with married-couple families (20 | 12.8%) accounting for the largest median family size of 2.15 persons per family. On the other hand, single female/mother families (81 | 51.9%) represent the smallest median family size with 1.73 persons per family.
| Family Type | # Families | Family Size |
| Married-Couple | 20 (12.8%) | 2.15 |
| Single Male/Father | 55 (35.3%) | 1.85 |
| Single Female/Mother | 81 (51.9%) | 1.73 |
| Total Families | 156 (100.0%) | 1.83 |
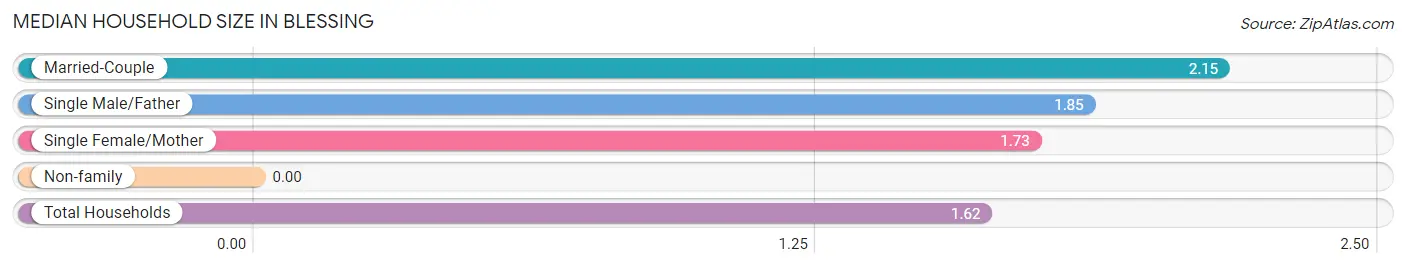
Median Household Size in Blessing
| Household Type | # Households | Household Size |
| Married-Couple | 20 (9.6%) | 2.15 |
| Single Male/Father | 55 (26.4%) | 1.85 |
| Single Female/Mother | 81 (38.9%) | 1.73 |
| Non-family | 52 (25.0%) | - |
| Total Households | 208 (100.0%) | 1.62 |
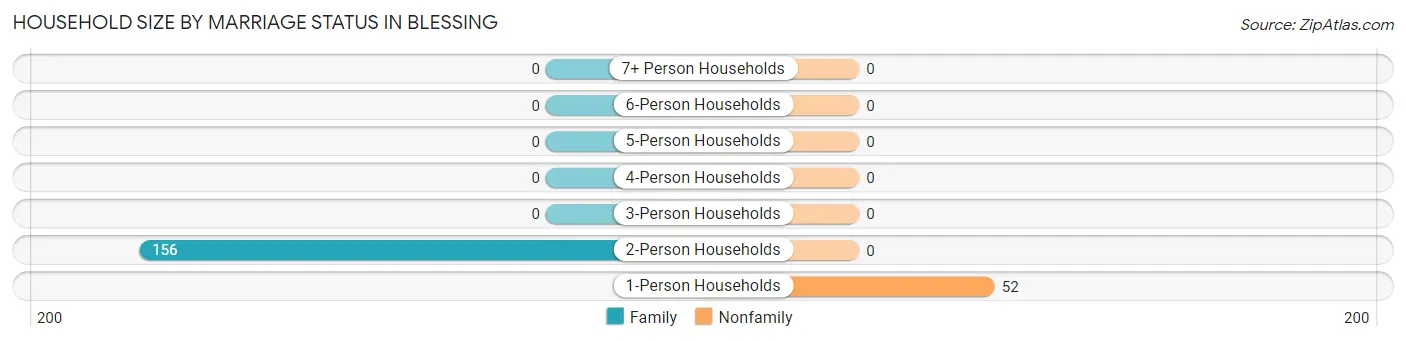
Household Size by Marriage Status in Blessing
Out of a total of 208 households in Blessing, 156 (75.0%) are family households, while 52 (25.0%) are nonfamily households. The most numerous type of family households are 2-person households, comprising 156, and the most common type of nonfamily households are 1-person households, comprising 52.
| Household Size | Family Households | Nonfamily Households |
| 1-Person Households | - | 52 (25.0%) |
| 2-Person Households | 156 (75.0%) | 0 (0.0%) |
| 3-Person Households | 0 (0.0%) | 0 (0.0%) |
| 4-Person Households | 0 (0.0%) | 0 (0.0%) |
| 5-Person Households | 0 (0.0%) | 0 (0.0%) |
| 6-Person Households | 0 (0.0%) | 0 (0.0%) |
| 7+ Person Households | 0 (0.0%) | 0 (0.0%) |
| Total | 156 (75.0%) | 52 (25.0%) |
Female Fertility in Blessing
Fertility by Age in Blessing
| Age Bracket | Women with Births | Births / 1,000 Women |
| 15 to 19 years | 0 (0.0%) | 0.0 |
| 20 to 34 years | 0 (0.0%) | 0.0 |
| 35 to 50 years | 0 (0.0%) | 0.0 |
| Total | 0 (0.0%) | 0.0 |
Fertility by Age by Marriage Status in Blessing
| Age Bracket | Married | Unmarried |
| 15 to 19 years | 0 (0.0%) | 0 (0.0%) |
| 20 to 34 years | 0 (0.0%) | 0 (0.0%) |
| 35 to 50 years | 0 (0.0%) | 0 (0.0%) |
| Total | 0 (0.0%) | 0 (0.0%) |
Fertility by Education in Blessing
| Educational Attainment | Women with Births | Births / 1,000 Women |
| Less than High School | 0 (0.0%) | 0.0 |
| High School Diploma | 0 (0.0%) | 0.0 |
| College or Associate's Degree | 0 (0.0%) | 0.0 |
| Bachelor's Degree | 0 (0.0%) | 0.0 |
| Graduate Degree | 0 (0.0%) | 0.0 |
| Total | 0 (0.0%) | 0.0 |
Fertility by Education by Marriage Status in Blessing
| Educational Attainment | Married | Unmarried |
| Less than High School | 0 (0.0%) | 0 (0.0%) |
| High School Diploma | 0 (0.0%) | 0 (0.0%) |
| College or Associate's Degree | 0 (0.0%) | 0 (0.0%) |
| Bachelor's Degree | 0 (0.0%) | 0 (0.0%) |
| Graduate Degree | 0 (0.0%) | 0 (0.0%) |
| Total | 0 (0.0%) | 0 (0.0%) |
Income in Blessing
Income Overview in Blessing
| Characteristic | Number | Measure |
| Per Capita Income | 337 | $20,556 |
| Median Family Income | 156 | $2,499 |
| Mean Family Income | 156 | $0 |
| Median Household Income | 208 | $0 |
| Mean Household Income | 208 | $31,642 |
| Income Deficit | 156 | $0 |
| Wage / Income Gap (%) | 337 | 0.00% |
| Wage / Income Gap ($) | 337 | 100.00¢ per $1 |
| Gini / Inequality Index | 337 | 0.59 |
Earnings by Sex in Blessing
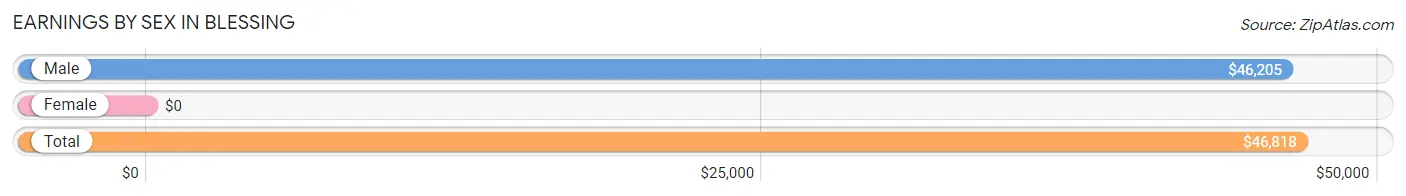
| Sex | Number | Average Earnings |
| Male | 103 (79.2%) | $46,205 |
| Female | 27 (20.8%) | $0 |
| Total | 130 (100.0%) | $46,818 |
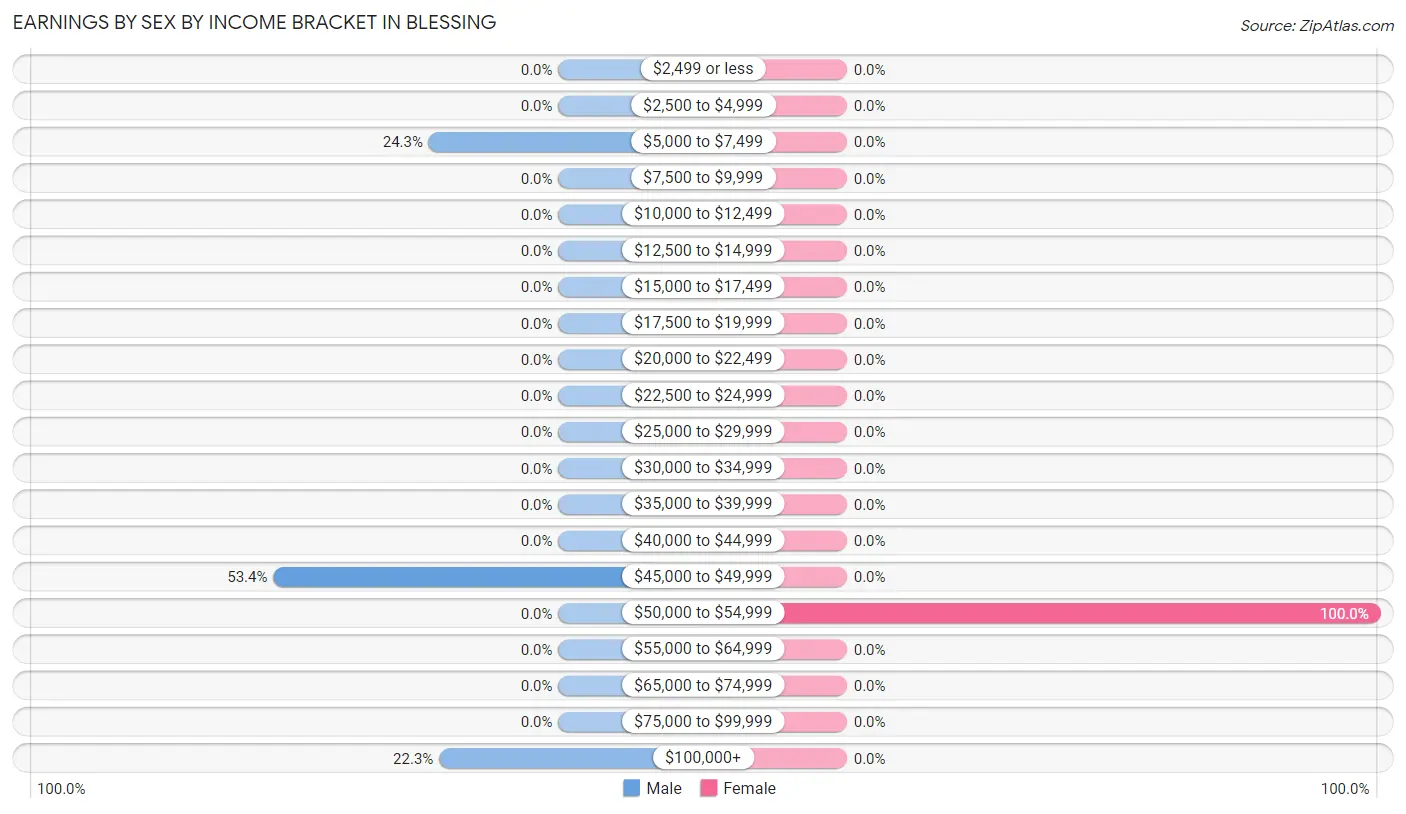
Earnings by Sex by Income Bracket in Blessing
The most common earnings brackets in Blessing are $45,000 to $49,999 for men (55 | 53.4%) and $50,000 to $54,999 for women (27 | 100.0%).
| Income | Male | Female |
| $2,499 or less | 0 (0.0%) | 0 (0.0%) |
| $2,500 to $4,999 | 0 (0.0%) | 0 (0.0%) |
| $5,000 to $7,499 | 25 (24.3%) | 0 (0.0%) |
| $7,500 to $9,999 | 0 (0.0%) | 0 (0.0%) |
| $10,000 to $12,499 | 0 (0.0%) | 0 (0.0%) |
| $12,500 to $14,999 | 0 (0.0%) | 0 (0.0%) |
| $15,000 to $17,499 | 0 (0.0%) | 0 (0.0%) |
| $17,500 to $19,999 | 0 (0.0%) | 0 (0.0%) |
| $20,000 to $22,499 | 0 (0.0%) | 0 (0.0%) |
| $22,500 to $24,999 | 0 (0.0%) | 0 (0.0%) |
| $25,000 to $29,999 | 0 (0.0%) | 0 (0.0%) |
| $30,000 to $34,999 | 0 (0.0%) | 0 (0.0%) |
| $35,000 to $39,999 | 0 (0.0%) | 0 (0.0%) |
| $40,000 to $44,999 | 0 (0.0%) | 0 (0.0%) |
| $45,000 to $49,999 | 55 (53.4%) | 0 (0.0%) |
| $50,000 to $54,999 | 0 (0.0%) | 27 (100.0%) |
| $55,000 to $64,999 | 0 (0.0%) | 0 (0.0%) |
| $65,000 to $74,999 | 0 (0.0%) | 0 (0.0%) |
| $75,000 to $99,999 | 0 (0.0%) | 0 (0.0%) |
| $100,000+ | 23 (22.3%) | 0 (0.0%) |
| Total | 103 (100.0%) | 27 (100.0%) |
Earnings by Sex by Educational Attainment in Blessing
| Educational Attainment | Male Income | Female Income |
| Less than High School | - | - |
| High School Diploma | - | - |
| College or Associate's Degree | - | - |
| Bachelor's Degree | - | - |
| Graduate Degree | - | - |
| Total | $46,205 | $0 |
Family Income in Blessing
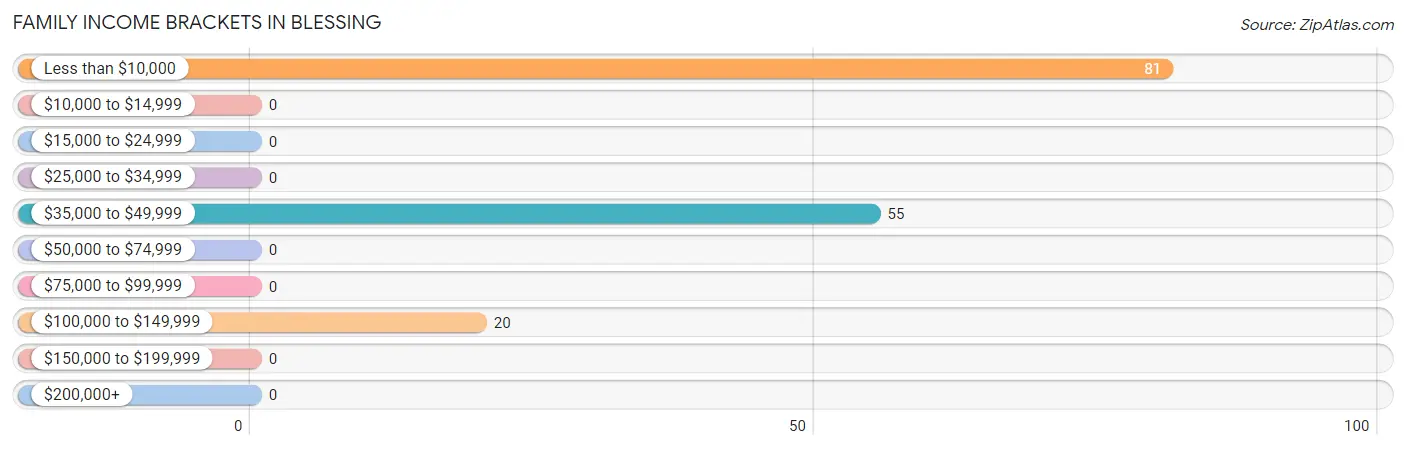
Family Income Brackets in Blessing
According to the Blessing family income data, there are 81 families falling into the less than $10,000 income range, which is the most common income bracket and makes up 51.9% of all families.
| Income Bracket | # Families | % Families |
| Less than $10,000 | 81 | 51.9% |
| $10,000 to $14,999 | 0 | 0.0% |
| $15,000 to $24,999 | 0 | 0.0% |
| $25,000 to $34,999 | 0 | 0.0% |
| $35,000 to $49,999 | 55 | 35.3% |
| $50,000 to $74,999 | 0 | 0.0% |
| $75,000 to $99,999 | 0 | 0.0% |
| $100,000 to $149,999 | 20 | 12.8% |
| $150,000 to $199,999 | 0 | 0.0% |
| $200,000+ | 0 | 0.0% |
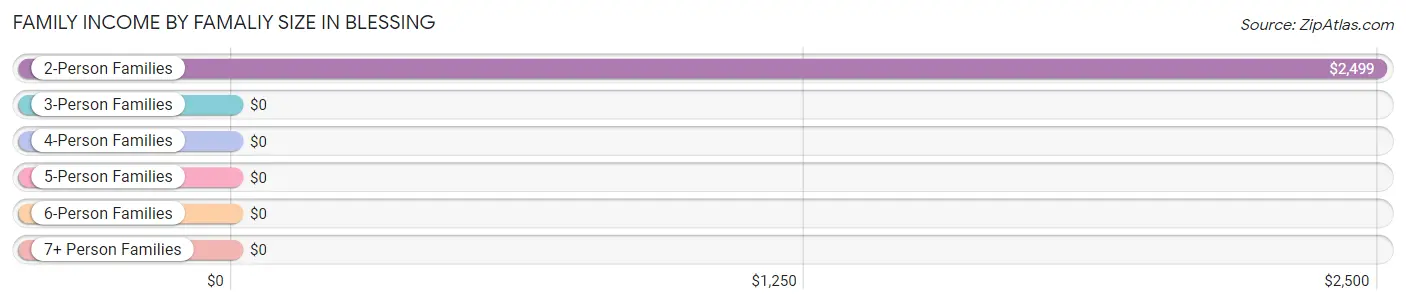
Family Income by Famaliy Size in Blessing
2-person families (156 | 100.0%) account for the highest median family income in Blessing with $2,499 per family, while 2-person families (156 | 100.0%) have the highest median income of $1,250 per family member.
| Income Bracket | # Families | Median Income |
| 2-Person Families | 156 (100.0%) | $2,499 |
| 3-Person Families | 0 (0.0%) | $0 |
| 4-Person Families | 0 (0.0%) | $0 |
| 5-Person Families | 0 (0.0%) | $0 |
| 6-Person Families | 0 (0.0%) | $0 |
| 7+ Person Families | 0 (0.0%) | $0 |
| Total | 156 (100.0%) | $2,499 |
Family Income by Number of Earners in Blessing
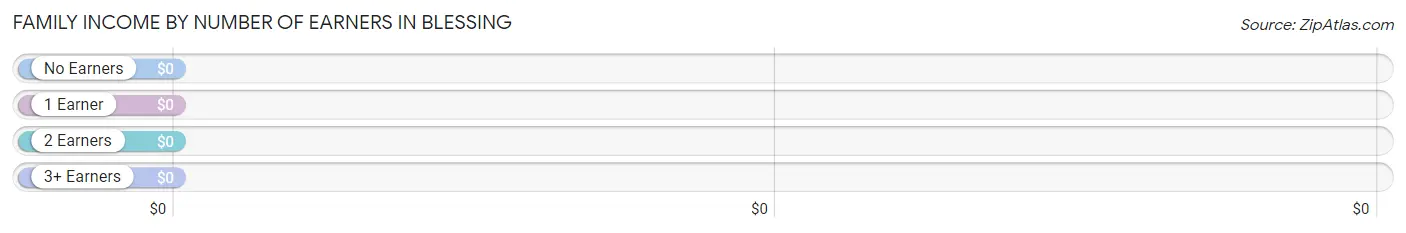
| Number of Earners | # Families | Median Income |
| No Earners | 81 (51.9%) | $0 |
| 1 Earner | 75 (48.1%) | $0 |
| 2 Earners | 0 (0.0%) | $0 |
| 3+ Earners | 0 (0.0%) | $0 |
| Total | 156 (100.0%) | $2,499 |
Household Income in Blessing
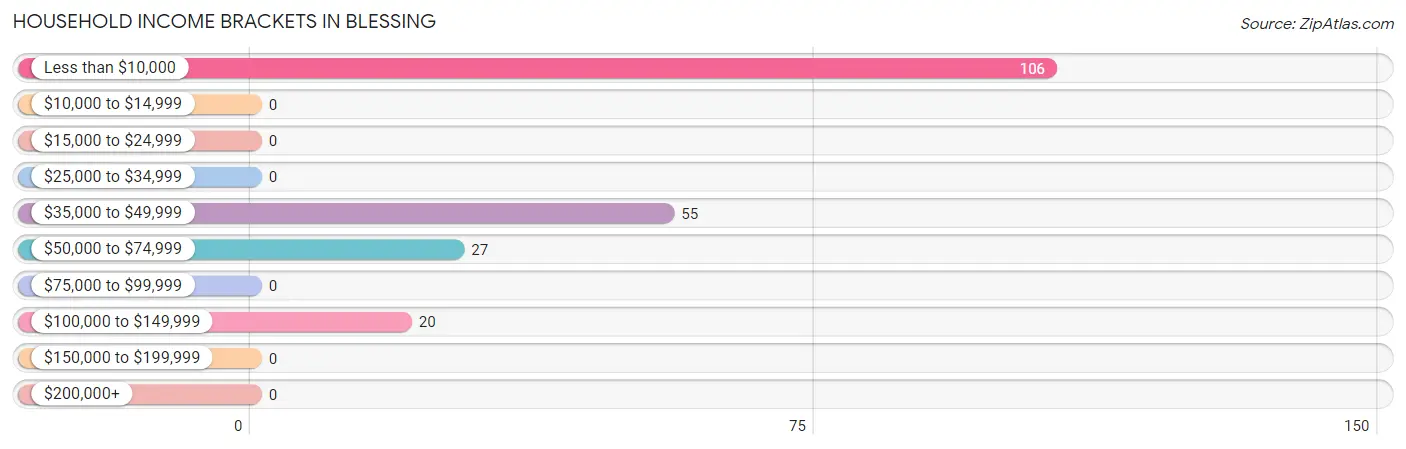
Household Income Brackets in Blessing
With 106 households falling in the category, the less than $10,000 income range is the most frequent in Blessing, accounting for 51.0% of all households.
| Income Bracket | # Households | % Households |
| Less than $10,000 | 106 | 51.0% |
| $10,000 to $14,999 | 0 | 0.0% |
| $15,000 to $24,999 | 0 | 0.0% |
| $25,000 to $34,999 | 0 | 0.0% |
| $35,000 to $49,999 | 55 | 26.4% |
| $50,000 to $74,999 | 27 | 13.0% |
| $75,000 to $99,999 | 0 | 0.0% |
| $100,000 to $149,999 | 20 | 9.6% |
| $150,000 to $199,999 | 0 | 0.0% |
| $200,000+ | 0 | 0.0% |
Household Income by Householder Age in Blessing
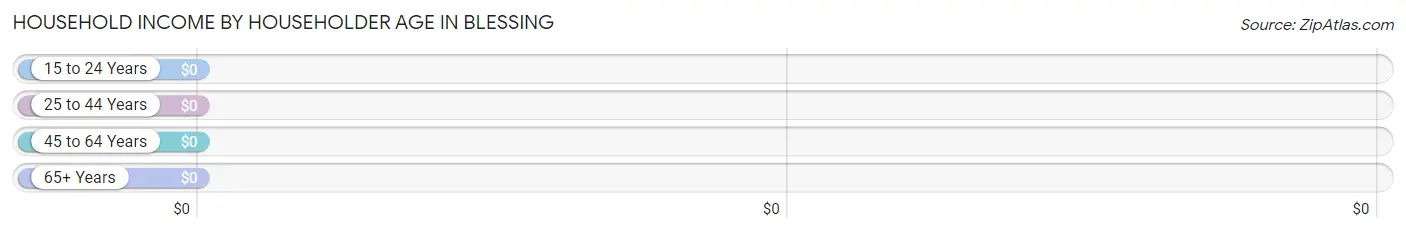
| Income Bracket | # Households | Median Income |
| 15 to 24 Years | 81 (38.9%) | $0 |
| 25 to 44 Years | 82 (39.4%) | $0 |
| 45 to 64 Years | 45 (21.6%) | $0 |
| 65+ Years | 0 (0.0%) | $0 |
| Total | 208 (100.0%) | $0 |
Poverty in Blessing
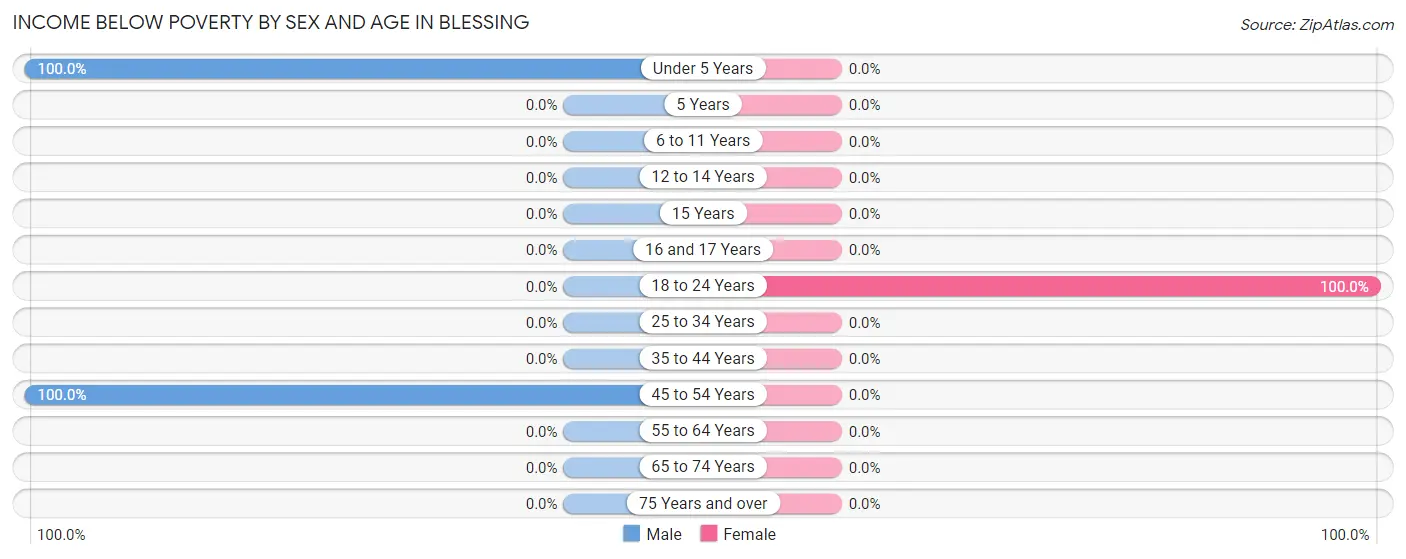
Income Below Poverty by Sex and Age in Blessing
With 40.2% poverty level for males and 63.3% for females among the residents of Blessing, under 5 year old males and 18 to 24 year old females are the most vulnerable to poverty, with 59 males (100.0%) and 81 females (100.0%) in their respective age groups living below the poverty level.
| Age Bracket | Male | Female |
| Under 5 Years | 59 (100.0%) | 0 (0.0%) |
| 5 Years | 0 (0.0%) | 0 (0.0%) |
| 6 to 11 Years | 0 (0.0%) | 0 (0.0%) |
| 12 to 14 Years | 0 (0.0%) | 0 (0.0%) |
| 15 Years | 0 (0.0%) | 0 (0.0%) |
| 16 and 17 Years | 0 (0.0%) | 0 (0.0%) |
| 18 to 24 Years | 0 (0.0%) | 81 (100.0%) |
| 25 to 34 Years | 0 (0.0%) | 0 (0.0%) |
| 35 to 44 Years | 0 (0.0%) | 0 (0.0%) |
| 45 to 54 Years | 25 (100.0%) | 0 (0.0%) |
| 55 to 64 Years | 0 (0.0%) | 0 (0.0%) |
| 65 to 74 Years | 0 (0.0%) | 0 (0.0%) |
| 75 Years and over | 0 (0.0%) | 0 (0.0%) |
| Total | 84 (40.2%) | 81 (63.3%) |
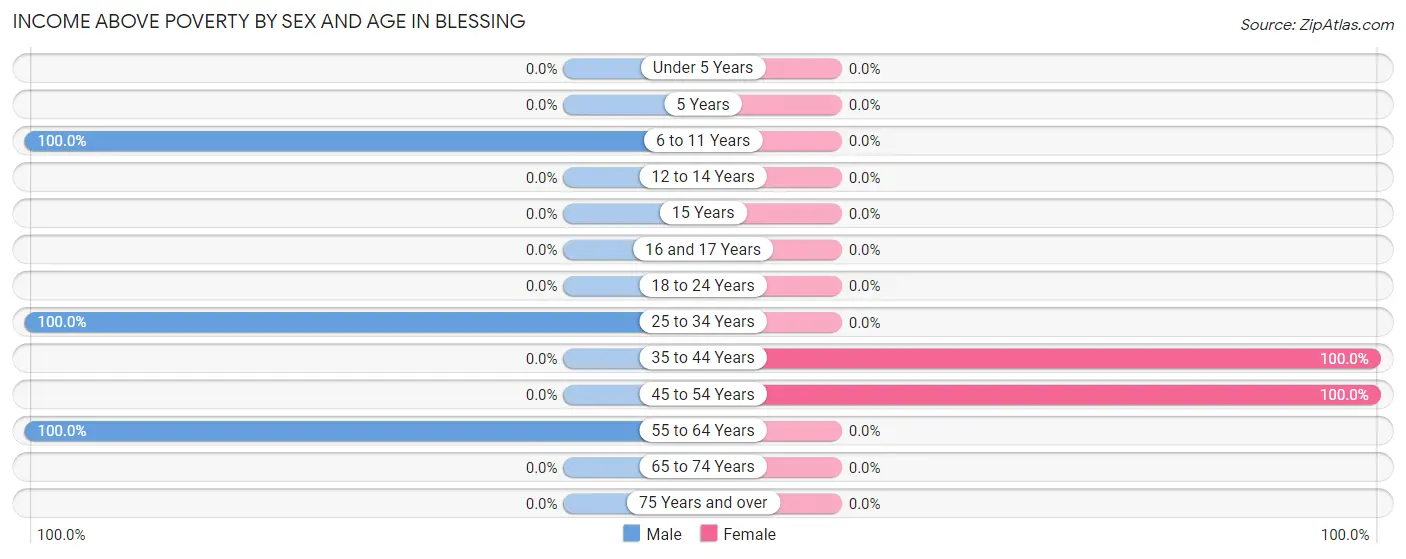
Income Above Poverty by Sex and Age in Blessing
According to the poverty statistics in Blessing, males aged 6 to 11 years and females aged 35 to 44 years are the age groups that are most secure financially, with 100.0% of males and 100.0% of females in these age groups living above the poverty line.
| Age Bracket | Male | Female |
| Under 5 Years | 0 (0.0%) | 0 (0.0%) |
| 5 Years | 0 (0.0%) | 0 (0.0%) |
| 6 to 11 Years | 47 (100.0%) | 0 (0.0%) |
| 12 to 14 Years | 0 (0.0%) | 0 (0.0%) |
| 15 Years | 0 (0.0%) | 0 (0.0%) |
| 16 and 17 Years | 0 (0.0%) | 0 (0.0%) |
| 18 to 24 Years | 0 (0.0%) | 0 (0.0%) |
| 25 to 34 Years | 55 (100.0%) | 0 (0.0%) |
| 35 to 44 Years | 0 (0.0%) | 27 (100.0%) |
| 45 to 54 Years | 0 (0.0%) | 20 (100.0%) |
| 55 to 64 Years | 23 (100.0%) | 0 (0.0%) |
| 65 to 74 Years | 0 (0.0%) | 0 (0.0%) |
| 75 Years and over | 0 (0.0%) | 0 (0.0%) |
| Total | 125 (59.8%) | 47 (36.7%) |
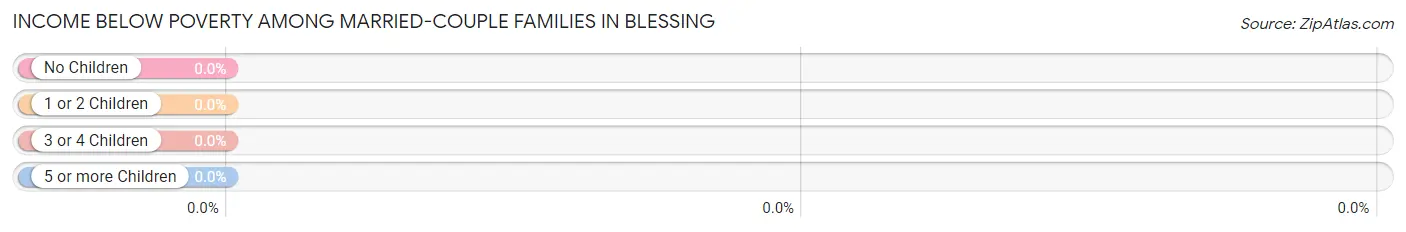
Income Below Poverty Among Married-Couple Families in Blessing
| Children | Above Poverty | Below Poverty |
| No Children | 20 (100.0%) | 0 (0.0%) |
| 1 or 2 Children | 0 (0.0%) | 0 (0.0%) |
| 3 or 4 Children | 0 (0.0%) | 0 (0.0%) |
| 5 or more Children | 0 (0.0%) | 0 (0.0%) |
| Total | 20 (100.0%) | 0 (0.0%) |
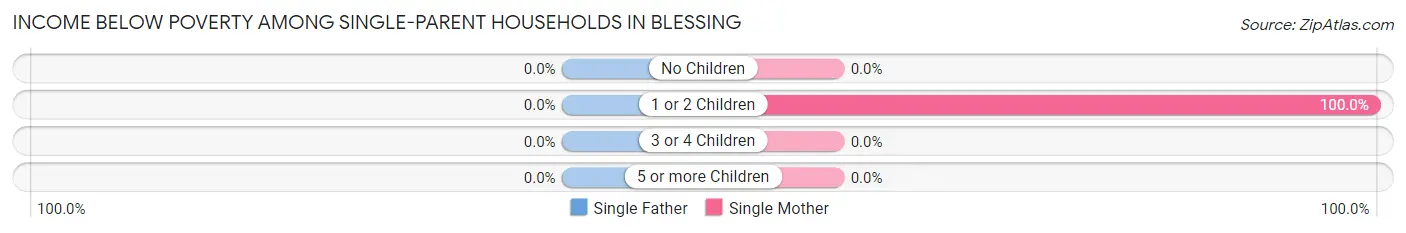
Income Below Poverty Among Single-Parent Households in Blessing
| Children | Single Father | Single Mother |
| No Children | 0 (0.0%) | 0 (0.0%) |
| 1 or 2 Children | 0 (0.0%) | 81 (100.0%) |
| 3 or 4 Children | 0 (0.0%) | 0 (0.0%) |
| 5 or more Children | 0 (0.0%) | 0 (0.0%) |
| Total | 0 (0.0%) | 81 (100.0%) |
Income Below Poverty Among Married-Couple vs Single-Parent Households in Blessing
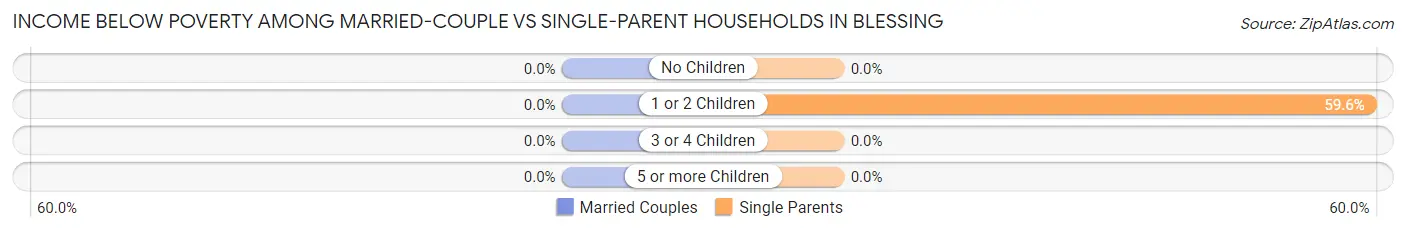
| Children | Married-Couple Families | Single-Parent Households |
| No Children | 0 (0.0%) | 0 (0.0%) |
| 1 or 2 Children | 0 (0.0%) | 81 (59.6%) |
| 3 or 4 Children | 0 (0.0%) | 0 (0.0%) |
| 5 or more Children | 0 (0.0%) | 0 (0.0%) |
| Total | 0 (0.0%) | 81 (59.6%) |
Employment Characteristics in Blessing
Employment by Class of Employer in Blessing
Among the 130 employed individuals in Blessing, private company employees (75 | 57.7%), and state government employees (55 | 42.3%) make up the most common classes of employment.
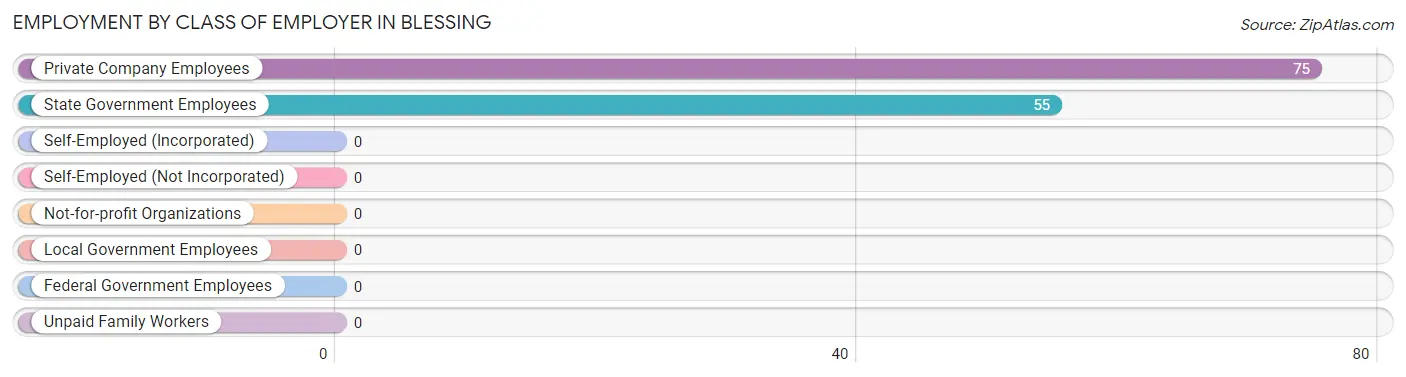
| Employer Class | # Employees | % Employees |
| Private Company Employees | 75 | 57.7% |
| Self-Employed (Incorporated) | 0 | 0.0% |
| Self-Employed (Not Incorporated) | 0 | 0.0% |
| Not-for-profit Organizations | 0 | 0.0% |
| Local Government Employees | 0 | 0.0% |
| State Government Employees | 55 | 42.3% |
| Federal Government Employees | 0 | 0.0% |
| Unpaid Family Workers | 0 | 0.0% |
| Total | 130 | 100.0% |
Employment Status by Age in Blessing
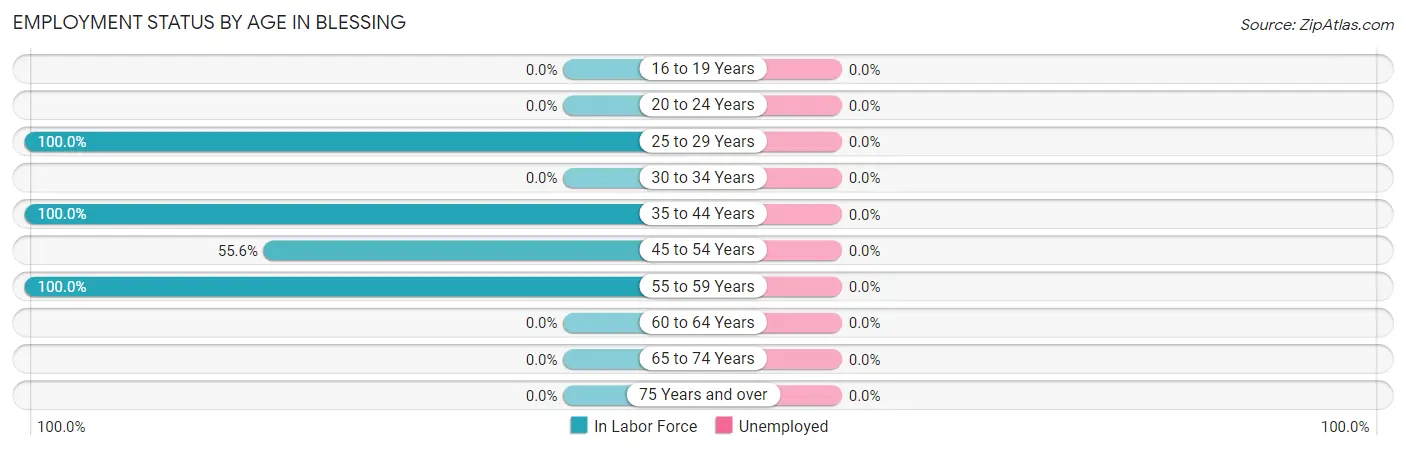
| Age Bracket | In Labor Force | Unemployed |
| 16 to 19 Years | 0 (0.0%) | 0 (0.0%) |
| 20 to 24 Years | 0 (0.0%) | 0 (0.0%) |
| 25 to 29 Years | 55 (100.0%) | 0 (0.0%) |
| 30 to 34 Years | 0 (0.0%) | 0 (0.0%) |
| 35 to 44 Years | 27 (100.0%) | 0 (0.0%) |
| 45 to 54 Years | 25 (55.6%) | 0 (0.0%) |
| 55 to 59 Years | 23 (100.0%) | 0 (0.0%) |
| 60 to 64 Years | 0 (0.0%) | 0 (0.0%) |
| 65 to 74 Years | 0 (0.0%) | 0 (0.0%) |
| 75 Years and over | 0 (0.0%) | 0 (0.0%) |
| Total | 130 (56.3%) | 0 (0.0%) |
Employment Status by Educational Attainment in Blessing
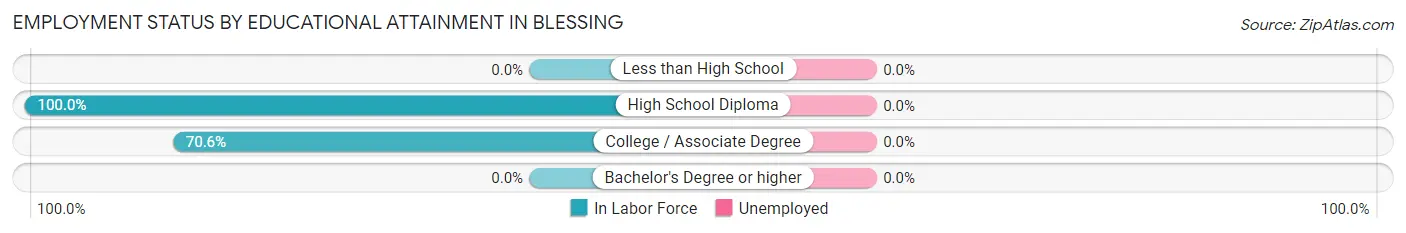
| Educational Attainment | In Labor Force | Unemployed |
| Less than High School | 0 (0.0%) | 0 (0.0%) |
| High School Diploma | 82 (100.0%) | 0 (0.0%) |
| College / Associate Degree | 48 (70.6%) | 0 (0.0%) |
| Bachelor's Degree or higher | 0 (0.0%) | 0 (0.0%) |
| Total | 130 (86.7%) | 0 (0.0%) |
Employment Occupations by Sex in Blessing
Management, Business, Science and Arts Occupations
The most common Management, Business, Science and Arts occupations in Blessing are , and Management (23 | 17.7%).
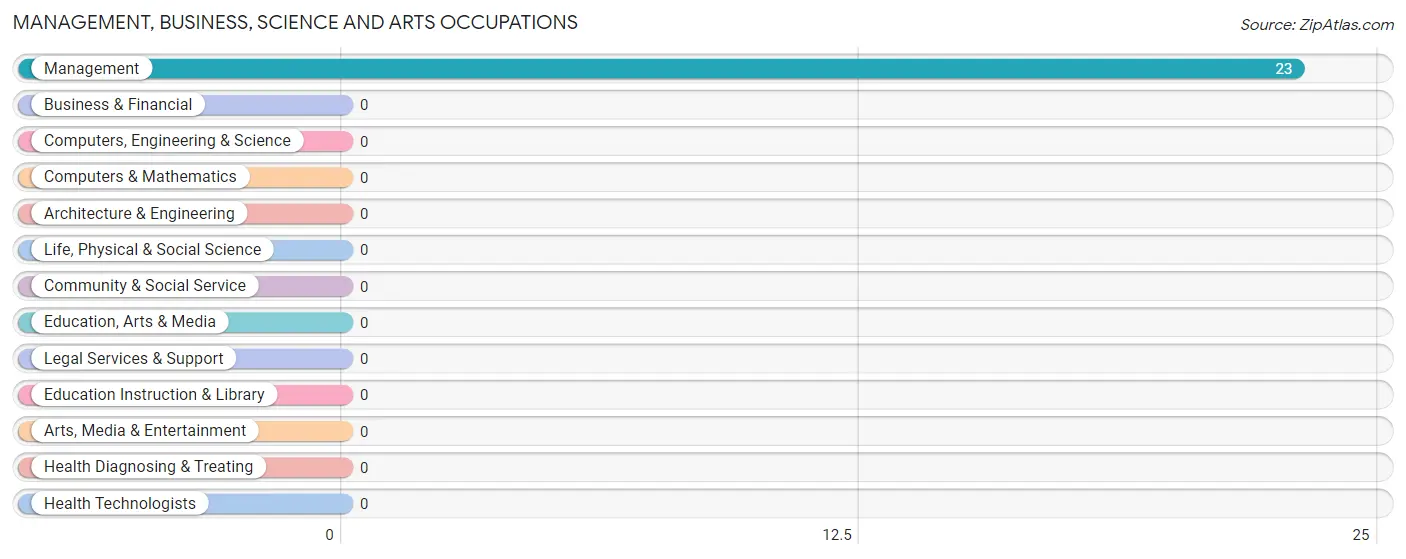
Management, Business, Science and Arts Occupations by Sex
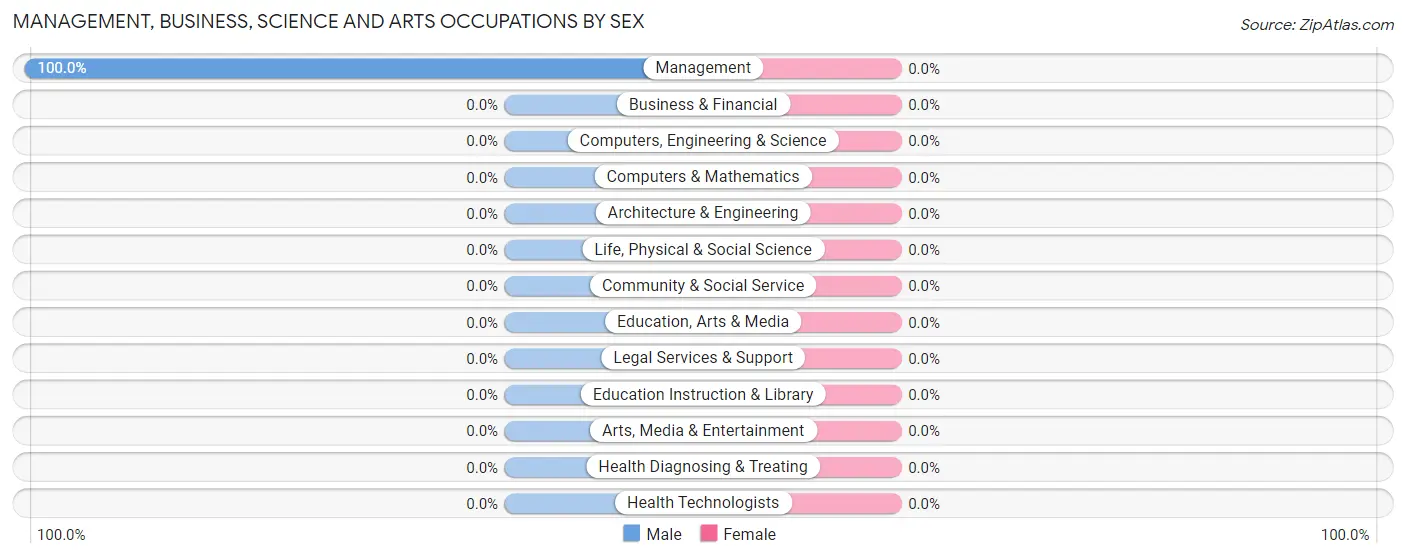
| Occupation | Male | Female |
| Management | 23 (100.0%) | 0 (0.0%) |
| Business & Financial | 0 (0.0%) | 0 (0.0%) |
| Computers, Engineering & Science | 0 (0.0%) | 0 (0.0%) |
| Computers & Mathematics | 0 (0.0%) | 0 (0.0%) |
| Architecture & Engineering | 0 (0.0%) | 0 (0.0%) |
| Life, Physical & Social Science | 0 (0.0%) | 0 (0.0%) |
| Community & Social Service | 0 (0.0%) | 0 (0.0%) |
| Education, Arts & Media | 0 (0.0%) | 0 (0.0%) |
| Legal Services & Support | 0 (0.0%) | 0 (0.0%) |
| Education Instruction & Library | 0 (0.0%) | 0 (0.0%) |
| Arts, Media & Entertainment | 0 (0.0%) | 0 (0.0%) |
| Health Diagnosing & Treating | 0 (0.0%) | 0 (0.0%) |
| Health Technologists | 0 (0.0%) | 0 (0.0%) |
| Total (Category) | 23 (100.0%) | 0 (0.0%) |
| Total (Overall) | 103 (79.2%) | 27 (20.8%) |
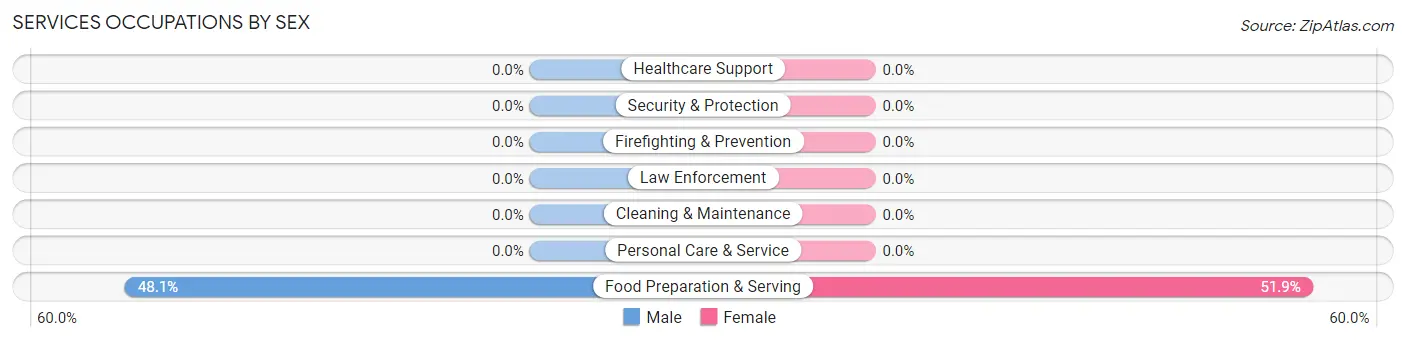
Services Occupations
The most common Services occupations in Blessing are , and Food Preparation & Serving (52 | 40.0%).

Services Occupations by Sex
| Occupation | Male | Female |
| Healthcare Support | 0 (0.0%) | 0 (0.0%) |
| Security & Protection | 0 (0.0%) | 0 (0.0%) |
| Firefighting & Prevention | 0 (0.0%) | 0 (0.0%) |
| Law Enforcement | 0 (0.0%) | 0 (0.0%) |
| Food Preparation & Serving | 25 (48.1%) | 27 (51.9%) |
| Cleaning & Maintenance | 0 (0.0%) | 0 (0.0%) |
| Personal Care & Service | 0 (0.0%) | 0 (0.0%) |
| Total (Category) | 25 (48.1%) | 27 (51.9%) |
| Total (Overall) | 103 (79.2%) | 27 (20.8%) |
Sales and Office Occupations
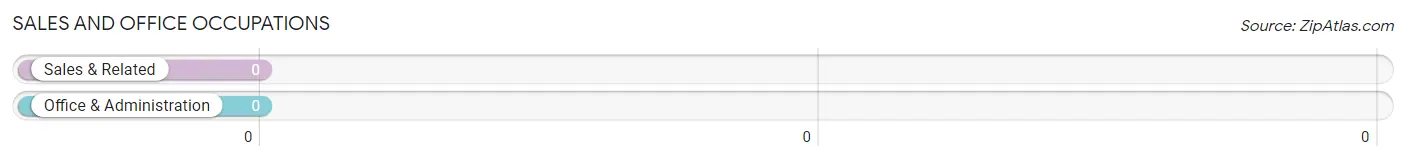
Sales and Office Occupations by Sex
| Occupation | Male | Female |
| Sales & Related | 0 (0.0%) | 0 (0.0%) |
| Office & Administration | 0 (0.0%) | 0 (0.0%) |
| Total (Category) | 0 (0.0%) | 0 (0.0%) |
| Total (Overall) | 103 (79.2%) | 27 (20.8%) |
Natural Resources, Construction and Maintenance Occupations
The most common Natural Resources, Construction and Maintenance occupations in Blessing are , and Construction & Extraction (55 | 42.3%).
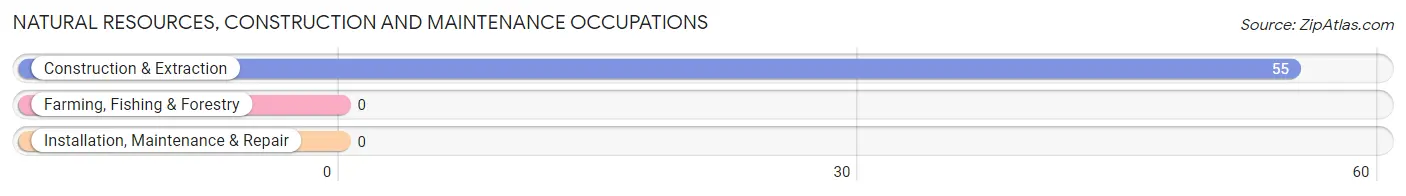
Natural Resources, Construction and Maintenance Occupations by Sex
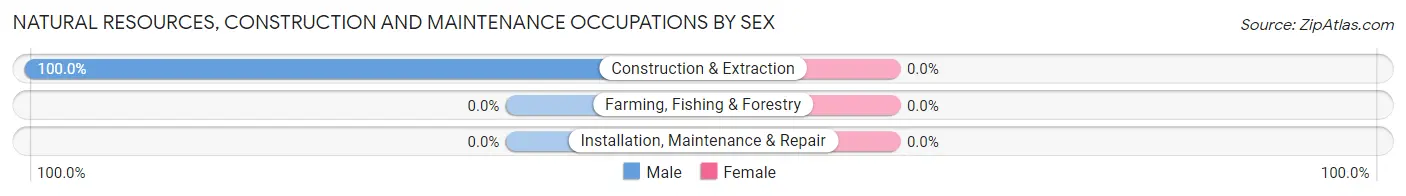
| Occupation | Male | Female |
| Farming, Fishing & Forestry | 0 (0.0%) | 0 (0.0%) |
| Construction & Extraction | 55 (100.0%) | 0 (0.0%) |
| Installation, Maintenance & Repair | 0 (0.0%) | 0 (0.0%) |
| Total (Category) | 55 (100.0%) | 0 (0.0%) |
| Total (Overall) | 103 (79.2%) | 27 (20.8%) |
Production, Transportation and Moving Occupations
Production, Transportation and Moving Occupations by Sex
| Occupation | Male | Female |
| Production | 0 (0.0%) | 0 (0.0%) |
| Transportation | 0 (0.0%) | 0 (0.0%) |
| Material Moving | 0 (0.0%) | 0 (0.0%) |
| Total (Category) | 0 (0.0%) | 0 (0.0%) |
| Total (Overall) | 103 (79.2%) | 27 (20.8%) |
Employment Industries by Sex in Blessing
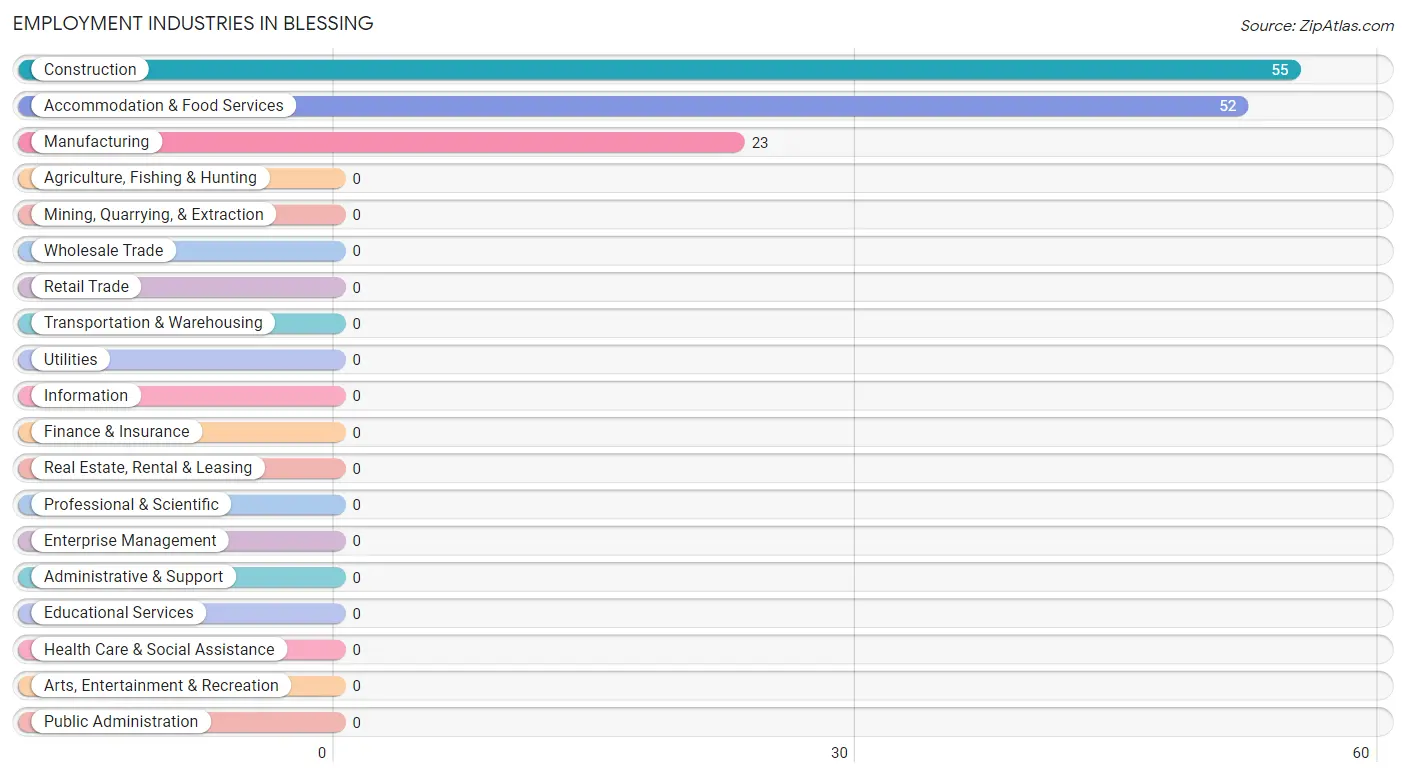
Employment Industries in Blessing
The major employment industries in Blessing include Construction (55 | 42.3%), Accommodation & Food Services (52 | 40.0%), and Manufacturing (23 | 17.7%).
Employment Industries by Sex in Blessing
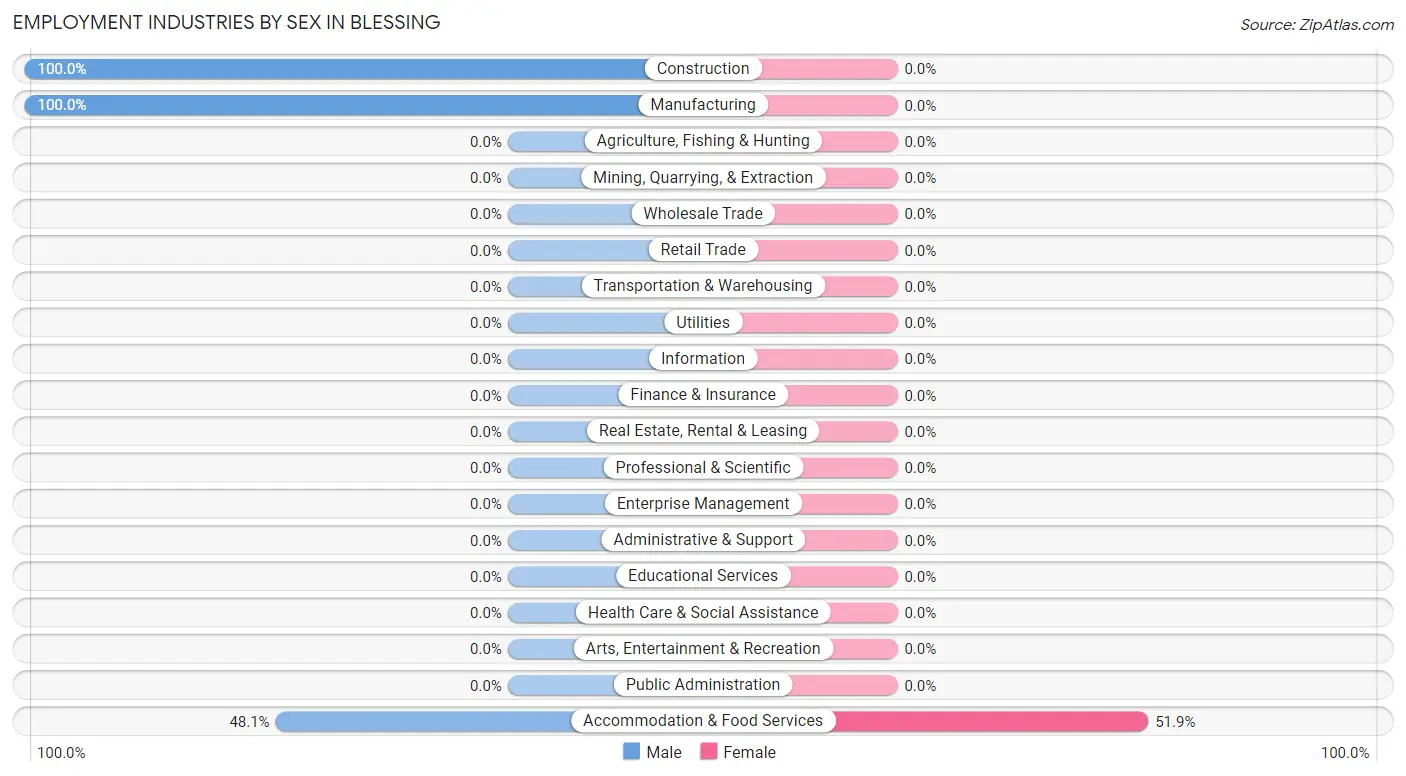
| Industry | Male | Female |
| Agriculture, Fishing & Hunting | 0 (0.0%) | 0 (0.0%) |
| Mining, Quarrying, & Extraction | 0 (0.0%) | 0 (0.0%) |
| Construction | 55 (100.0%) | 0 (0.0%) |
| Manufacturing | 23 (100.0%) | 0 (0.0%) |
| Wholesale Trade | 0 (0.0%) | 0 (0.0%) |
| Retail Trade | 0 (0.0%) | 0 (0.0%) |
| Transportation & Warehousing | 0 (0.0%) | 0 (0.0%) |
| Utilities | 0 (0.0%) | 0 (0.0%) |
| Information | 0 (0.0%) | 0 (0.0%) |
| Finance & Insurance | 0 (0.0%) | 0 (0.0%) |
| Real Estate, Rental & Leasing | 0 (0.0%) | 0 (0.0%) |
| Professional & Scientific | 0 (0.0%) | 0 (0.0%) |
| Enterprise Management | 0 (0.0%) | 0 (0.0%) |
| Administrative & Support | 0 (0.0%) | 0 (0.0%) |
| Educational Services | 0 (0.0%) | 0 (0.0%) |
| Health Care & Social Assistance | 0 (0.0%) | 0 (0.0%) |
| Arts, Entertainment & Recreation | 0 (0.0%) | 0 (0.0%) |
| Accommodation & Food Services | 25 (48.1%) | 27 (51.9%) |
| Public Administration | 0 (0.0%) | 0 (0.0%) |
| Total | 103 (79.2%) | 27 (20.8%) |
Education in Blessing
School Enrollment in Blessing
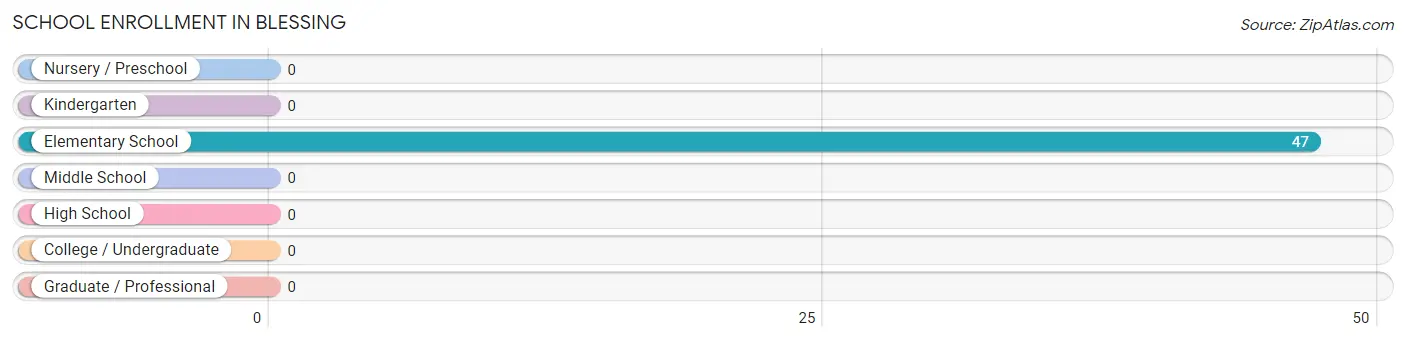
| School Level | # Students | % Students |
| Nursery / Preschool | 0 | 0.0% |
| Kindergarten | 0 | 0.0% |
| Elementary School | 47 | 100.0% |
| Middle School | 0 | 0.0% |
| High School | 0 | 0.0% |
| College / Undergraduate | 0 | 0.0% |
| Graduate / Professional | 0 | 0.0% |
| Total | 47 | 100.0% |
School Enrollment by Age by Funding Source in Blessing
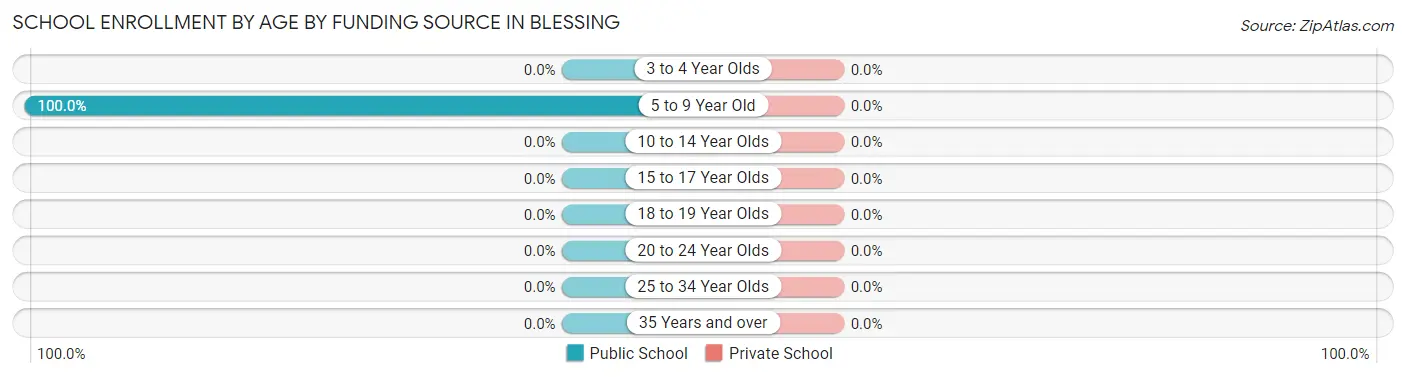
| Age Bracket | Public School | Private School |
| 3 to 4 Year Olds | 0 (0.0%) | 0 (0.0%) |
| 5 to 9 Year Old | 47 (100.0%) | 0 (0.0%) |
| 10 to 14 Year Olds | 0 (0.0%) | 0 (0.0%) |
| 15 to 17 Year Olds | 0 (0.0%) | 0 (0.0%) |
| 18 to 19 Year Olds | 0 (0.0%) | 0 (0.0%) |
| 20 to 24 Year Olds | 0 (0.0%) | 0 (0.0%) |
| 25 to 34 Year Olds | 0 (0.0%) | 0 (0.0%) |
| 35 Years and over | 0 (0.0%) | 0 (0.0%) |
| Total | 47 (100.0%) | 0 (0.0%) |
Educational Attainment by Field of Study in Blessing
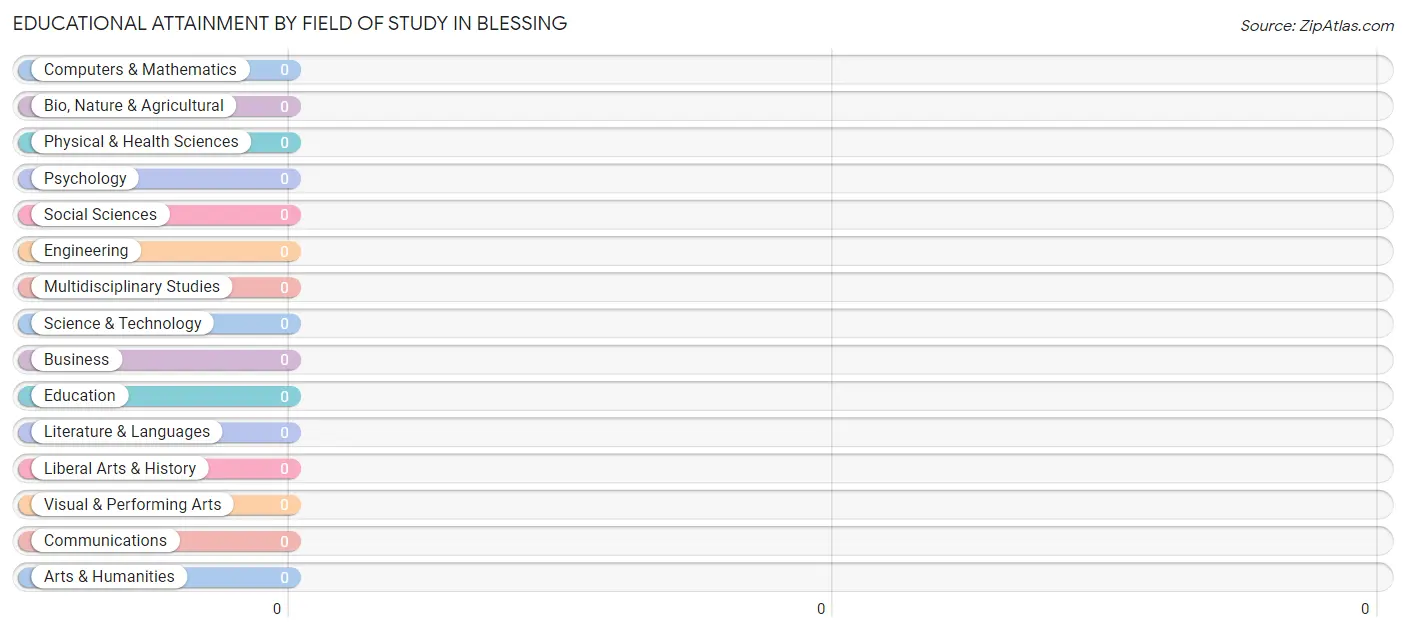
| Field of Study | # Graduates | % Graduates |
| Computers & Mathematics | 0 | 0.0% |
| Bio, Nature & Agricultural | 0 | 0.0% |
| Physical & Health Sciences | 0 | 0.0% |
| Psychology | 0 | 0.0% |
| Social Sciences | 0 | 0.0% |
| Engineering | 0 | 0.0% |
| Multidisciplinary Studies | 0 | 0.0% |
| Science & Technology | 0 | 0.0% |
| Business | 0 | 0.0% |
| Education | 0 | 0.0% |
| Literature & Languages | 0 | 0.0% |
| Liberal Arts & History | 0 | 0.0% |
| Visual & Performing Arts | 0 | 0.0% |
| Communications | 0 | 0.0% |
| Arts & Humanities | 0 | 0.0% |
| Total | 0 | 0.0% |
Transportation & Commute in Blessing
Vehicle Availability by Sex in Blessing
The most prevalent vehicle ownership categories in Blessing are males with 1 vehicle (80, accounting for 77.7%) and females with 1 vehicle (0, making up 296.3%).
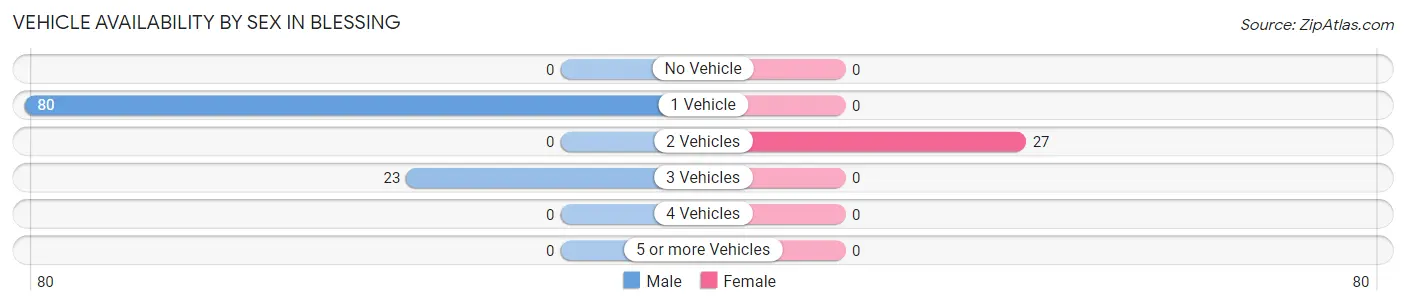
| Vehicles Available | Male | Female |
| No Vehicle | 0 (0.0%) | 0 (0.0%) |
| 1 Vehicle | 80 (77.7%) | 0 (0.0%) |
| 2 Vehicles | 0 (0.0%) | 27 (100.0%) |
| 3 Vehicles | 23 (22.3%) | 0 (0.0%) |
| 4 Vehicles | 0 (0.0%) | 0 (0.0%) |
| 5 or more Vehicles | 0 (0.0%) | 0 (0.0%) |
| Total | 103 (100.0%) | 27 (100.0%) |
Commute Time in Blessing
The most frequently occuring commute durations in Blessing are 30 to 34 minutes (55 commuters, 42.3%), less than 5 minutes (48 commuters, 36.9%), and 20 to 24 minutes (27 commuters, 20.8%).
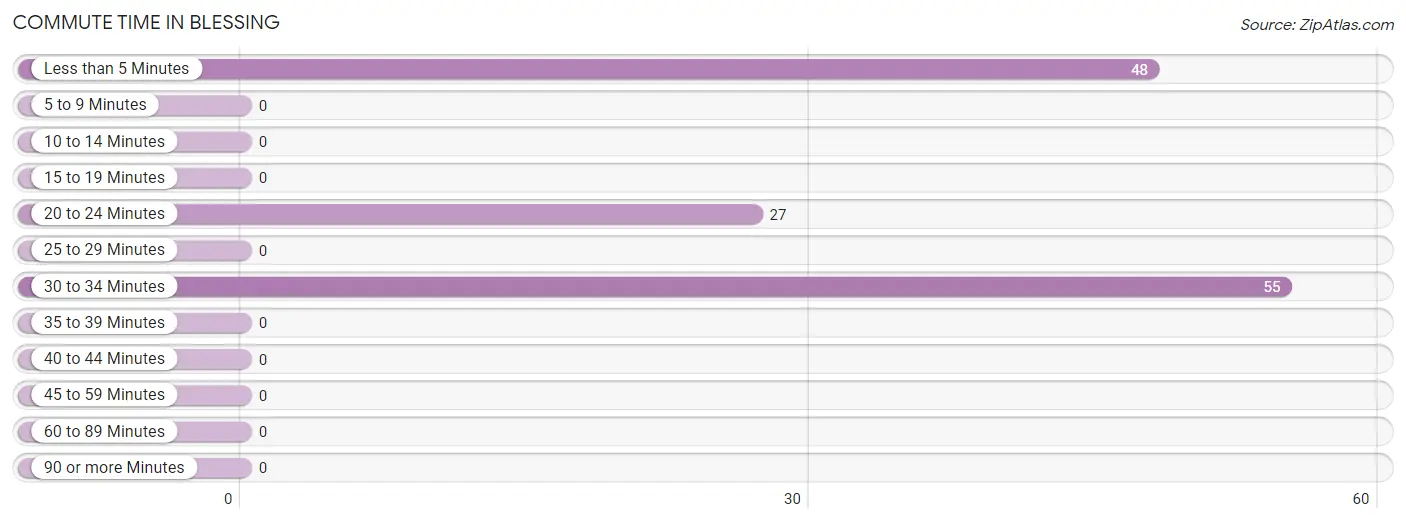
| Commute Time | # Commuters | % Commuters |
| Less than 5 Minutes | 48 | 36.9% |
| 5 to 9 Minutes | 0 | 0.0% |
| 10 to 14 Minutes | 0 | 0.0% |
| 15 to 19 Minutes | 0 | 0.0% |
| 20 to 24 Minutes | 27 | 20.8% |
| 25 to 29 Minutes | 0 | 0.0% |
| 30 to 34 Minutes | 55 | 42.3% |
| 35 to 39 Minutes | 0 | 0.0% |
| 40 to 44 Minutes | 0 | 0.0% |
| 45 to 59 Minutes | 0 | 0.0% |
| 60 to 89 Minutes | 0 | 0.0% |
| 90 or more Minutes | 0 | 0.0% |
Commute Time by Sex in Blessing
The most common commute times in Blessing are 30 to 34 minutes (55 commuters, 53.4%) for males and 20 to 24 minutes (27 commuters, 100.0%) for females.
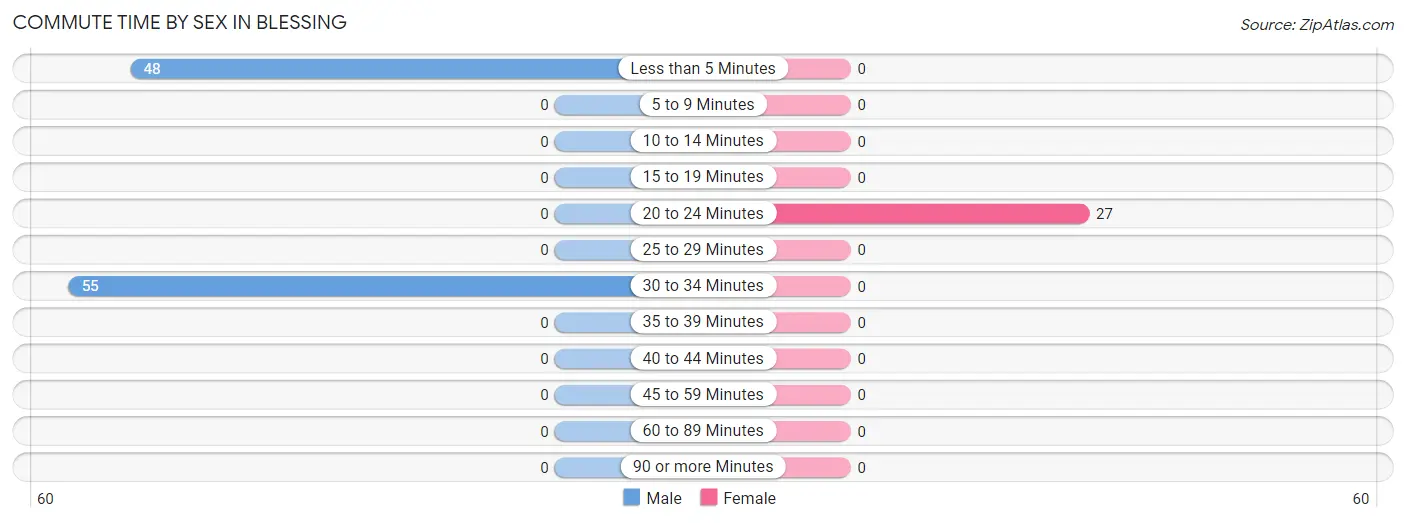
| Commute Time | Male | Female |
| Less than 5 Minutes | 48 (46.6%) | 0 (0.0%) |
| 5 to 9 Minutes | 0 (0.0%) | 0 (0.0%) |
| 10 to 14 Minutes | 0 (0.0%) | 0 (0.0%) |
| 15 to 19 Minutes | 0 (0.0%) | 0 (0.0%) |
| 20 to 24 Minutes | 0 (0.0%) | 27 (100.0%) |
| 25 to 29 Minutes | 0 (0.0%) | 0 (0.0%) |
| 30 to 34 Minutes | 55 (53.4%) | 0 (0.0%) |
| 35 to 39 Minutes | 0 (0.0%) | 0 (0.0%) |
| 40 to 44 Minutes | 0 (0.0%) | 0 (0.0%) |
| 45 to 59 Minutes | 0 (0.0%) | 0 (0.0%) |
| 60 to 89 Minutes | 0 (0.0%) | 0 (0.0%) |
| 90 or more Minutes | 0 (0.0%) | 0 (0.0%) |
Time of Departure to Work by Sex in Blessing
The most frequent times of departure to work in Blessing are 6:30 AM to 6:59 AM (55, 53.4%) for males and 7:00 AM to 7:29 AM (27, 100.0%) for females.
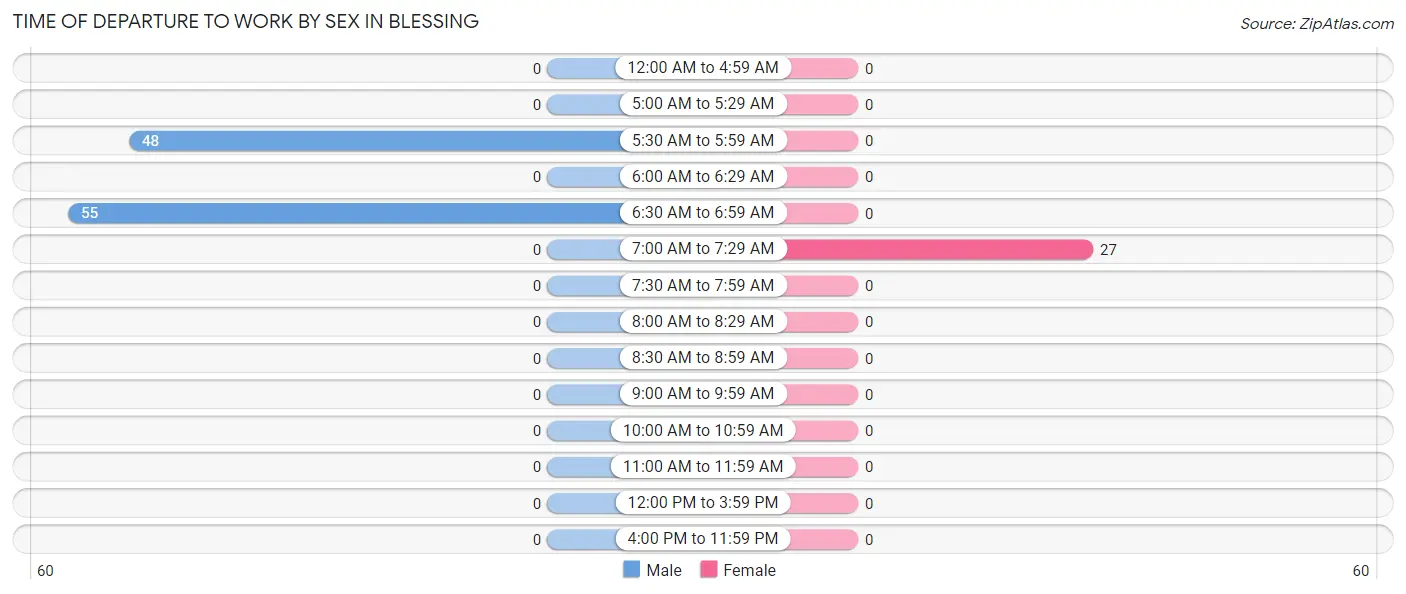
| Time of Departure | Male | Female |
| 12:00 AM to 4:59 AM | 0 (0.0%) | 0 (0.0%) |
| 5:00 AM to 5:29 AM | 0 (0.0%) | 0 (0.0%) |
| 5:30 AM to 5:59 AM | 48 (46.6%) | 0 (0.0%) |
| 6:00 AM to 6:29 AM | 0 (0.0%) | 0 (0.0%) |
| 6:30 AM to 6:59 AM | 55 (53.4%) | 0 (0.0%) |
| 7:00 AM to 7:29 AM | 0 (0.0%) | 27 (100.0%) |
| 7:30 AM to 7:59 AM | 0 (0.0%) | 0 (0.0%) |
| 8:00 AM to 8:29 AM | 0 (0.0%) | 0 (0.0%) |
| 8:30 AM to 8:59 AM | 0 (0.0%) | 0 (0.0%) |
| 9:00 AM to 9:59 AM | 0 (0.0%) | 0 (0.0%) |
| 10:00 AM to 10:59 AM | 0 (0.0%) | 0 (0.0%) |
| 11:00 AM to 11:59 AM | 0 (0.0%) | 0 (0.0%) |
| 12:00 PM to 3:59 PM | 0 (0.0%) | 0 (0.0%) |
| 4:00 PM to 11:59 PM | 0 (0.0%) | 0 (0.0%) |
| Total | 103 (100.0%) | 27 (100.0%) |
Housing Occupancy in Blessing
Occupancy by Ownership in Blessing
Of the total 208 dwellings in Blessing, owner-occupied units account for 183 (88.0%), while renter-occupied units make up 25 (12.0%).
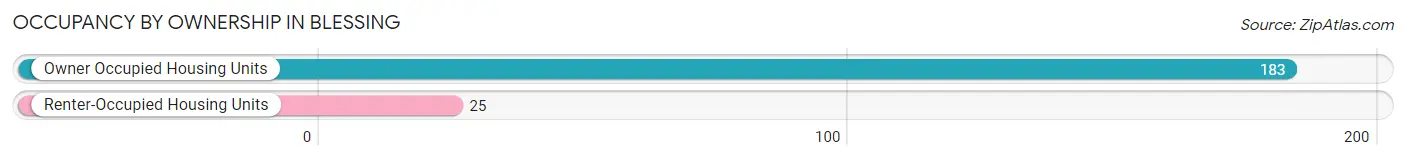
| Occupancy | # Housing Units | % Housing Units |
| Owner Occupied Housing Units | 183 | 88.0% |
| Renter-Occupied Housing Units | 25 | 12.0% |
| Total Occupied Housing Units | 208 | 100.0% |
Occupancy by Household Size in Blessing
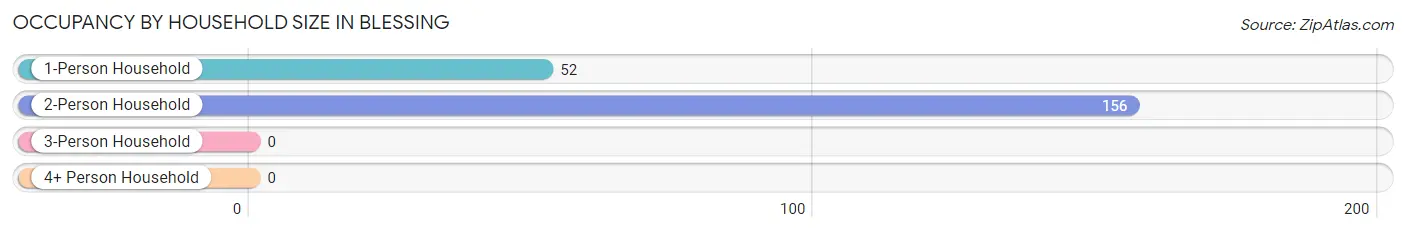
| Household Size | # Housing Units | % Housing Units |
| 1-Person Household | 52 | 25.0% |
| 2-Person Household | 156 | 75.0% |
| 3-Person Household | 0 | 0.0% |
| 4+ Person Household | 0 | 0.0% |
| Total Housing Units | 208 | 100.0% |
Occupancy by Ownership by Household Size in Blessing
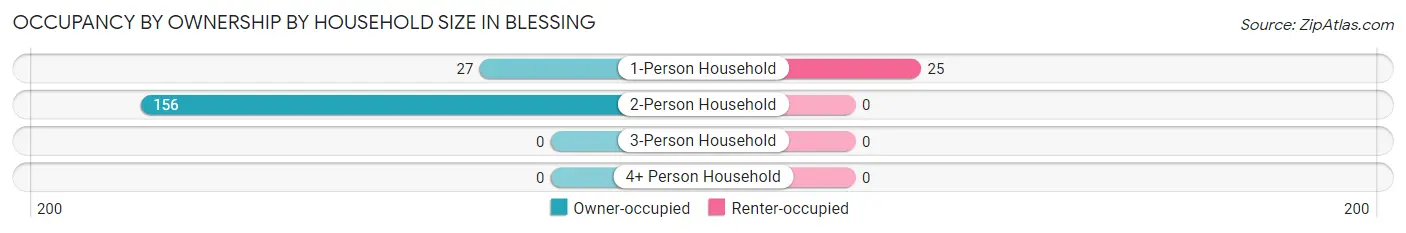
| Household Size | Owner-occupied | Renter-occupied |
| 1-Person Household | 27 (51.9%) | 25 (48.1%) |
| 2-Person Household | 156 (100.0%) | 0 (0.0%) |
| 3-Person Household | 0 (0.0%) | 0 (0.0%) |
| 4+ Person Household | 0 (0.0%) | 0 (0.0%) |
| Total Housing Units | 183 (88.0%) | 25 (12.0%) |
Occupancy by Educational Attainment in Blessing
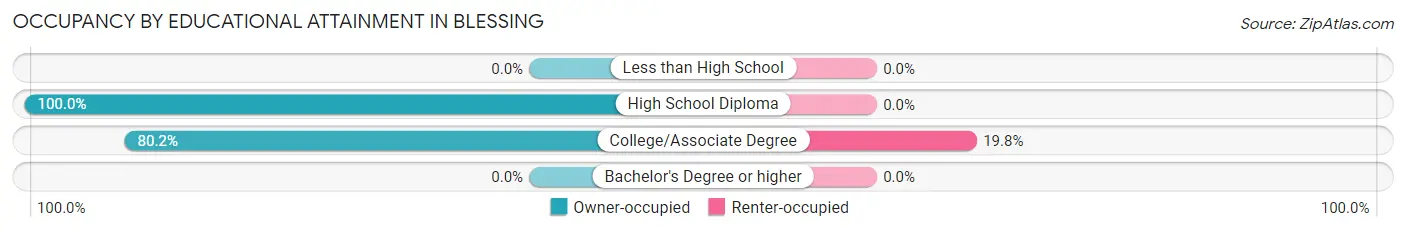
| Household Size | Owner-occupied | Renter-occupied |
| Less than High School | 0 (0.0%) | 0 (0.0%) |
| High School Diploma | 82 (100.0%) | 0 (0.0%) |
| College/Associate Degree | 101 (80.2%) | 25 (19.8%) |
| Bachelor's Degree or higher | 0 (0.0%) | 0 (0.0%) |
Occupancy by Age of Householder in Blessing
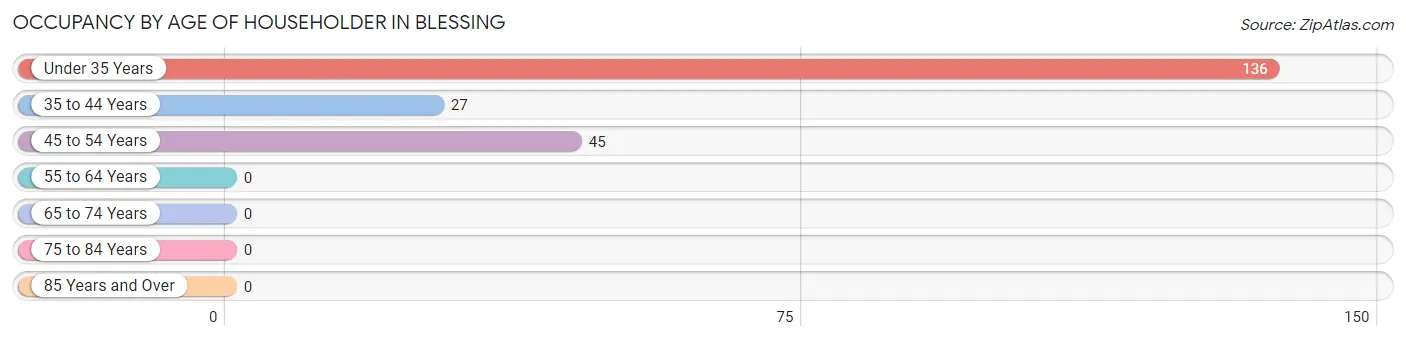
| Age Bracket | # Households | % Households |
| Under 35 Years | 136 | 65.4% |
| 35 to 44 Years | 27 | 13.0% |
| 45 to 54 Years | 45 | 21.6% |
| 55 to 64 Years | 0 | 0.0% |
| 65 to 74 Years | 0 | 0.0% |
| 75 to 84 Years | 0 | 0.0% |
| 85 Years and Over | 0 | 0.0% |
| Total | 208 | 100.0% |
Housing Finances in Blessing
Median Income by Occupancy in Blessing
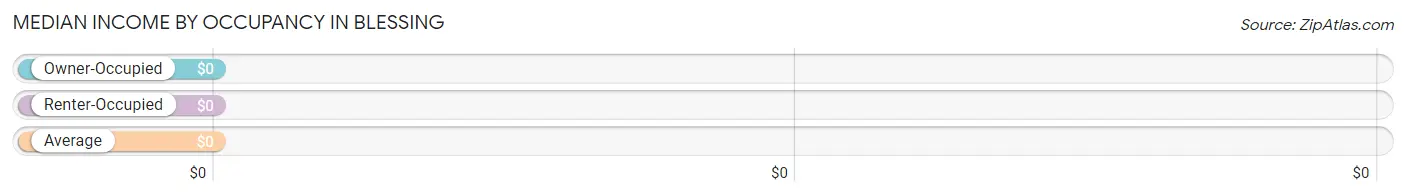
| Occupancy Type | # Households | Median Income |
| Owner-Occupied | 183 (88.0%) | $0 |
| Renter-Occupied | 25 (12.0%) | $0 |
| Average | 208 (100.0%) | $0 |
Occupancy by Householder Income Bracket in Blessing
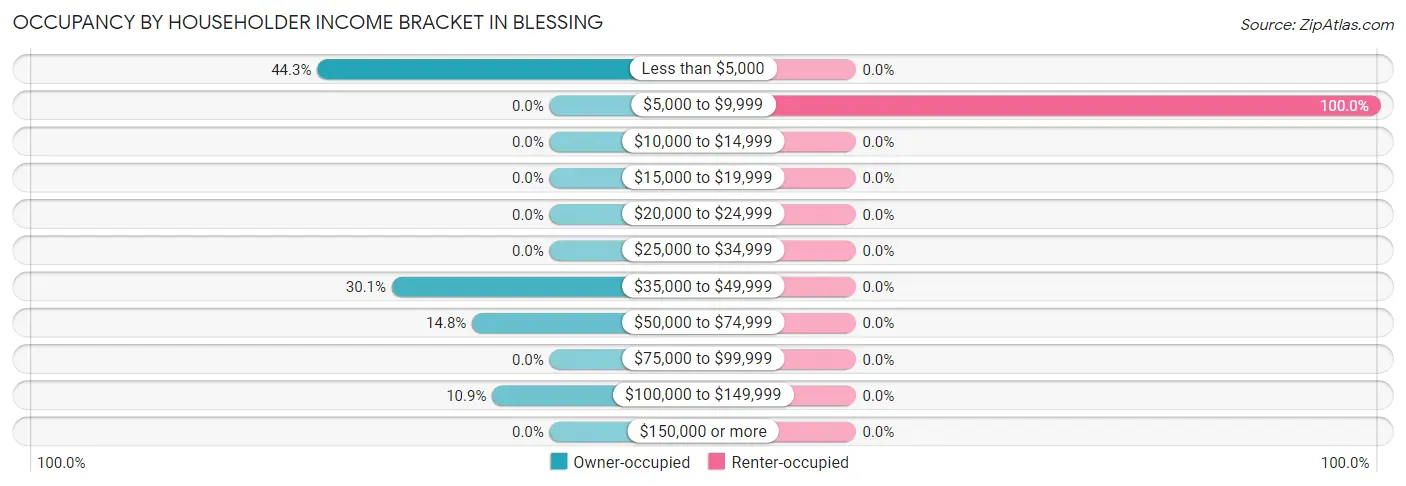
| Income Bracket | Owner-occupied | Renter-occupied |
| Less than $5,000 | 81 (44.3%) | 0 (0.0%) |
| $5,000 to $9,999 | 0 (0.0%) | 25 (100.0%) |
| $10,000 to $14,999 | 0 (0.0%) | 0 (0.0%) |
| $15,000 to $19,999 | 0 (0.0%) | 0 (0.0%) |
| $20,000 to $24,999 | 0 (0.0%) | 0 (0.0%) |
| $25,000 to $34,999 | 0 (0.0%) | 0 (0.0%) |
| $35,000 to $49,999 | 55 (30.0%) | 0 (0.0%) |
| $50,000 to $74,999 | 27 (14.7%) | 0 (0.0%) |
| $75,000 to $99,999 | 0 (0.0%) | 0 (0.0%) |
| $100,000 to $149,999 | 20 (10.9%) | 0 (0.0%) |
| $150,000 or more | 0 (0.0%) | 0 (0.0%) |
| Total | 183 (100.0%) | 25 (100.0%) |
Monthly Housing Cost Tiers in Blessing
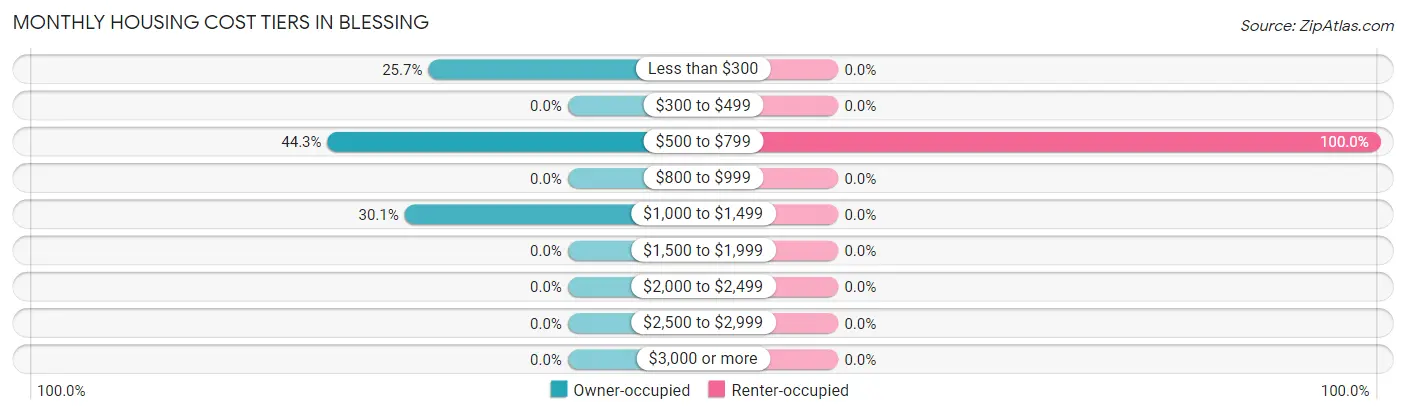
| Monthly Cost | Owner-occupied | Renter-occupied |
| Less than $300 | 47 (25.7%) | 0 (0.0%) |
| $300 to $499 | 0 (0.0%) | 0 (0.0%) |
| $500 to $799 | 81 (44.3%) | 25 (100.0%) |
| $800 to $999 | 0 (0.0%) | 0 (0.0%) |
| $1,000 to $1,499 | 55 (30.0%) | 0 (0.0%) |
| $1,500 to $1,999 | 0 (0.0%) | 0 (0.0%) |
| $2,000 to $2,499 | 0 (0.0%) | 0 (0.0%) |
| $2,500 to $2,999 | 0 (0.0%) | 0 (0.0%) |
| $3,000 or more | 0 (0.0%) | 0 (0.0%) |
| Total | 183 (100.0%) | 25 (100.0%) |
Physical Housing Characteristics in Blessing
Housing Structures in Blessing
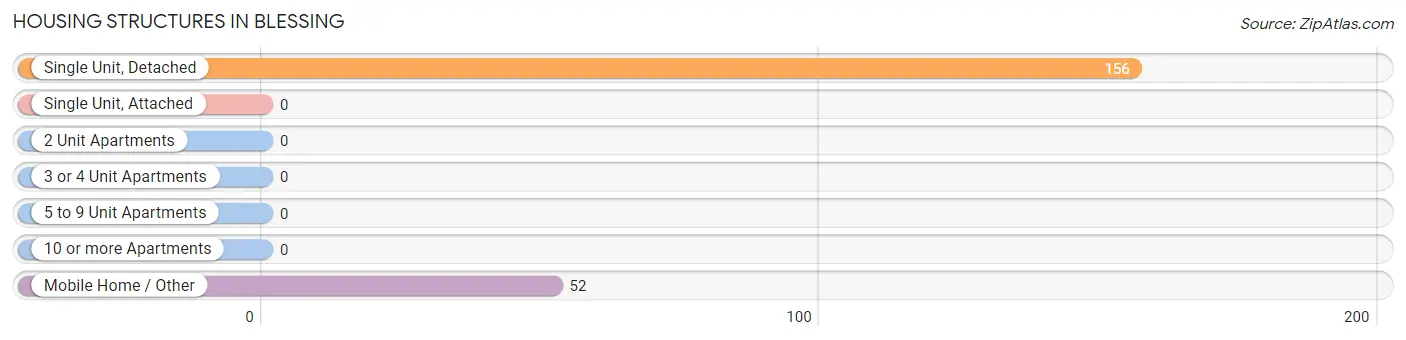
| Structure Type | # Housing Units | % Housing Units |
| Single Unit, Detached | 156 | 75.0% |
| Single Unit, Attached | 0 | 0.0% |
| 2 Unit Apartments | 0 | 0.0% |
| 3 or 4 Unit Apartments | 0 | 0.0% |
| 5 to 9 Unit Apartments | 0 | 0.0% |
| 10 or more Apartments | 0 | 0.0% |
| Mobile Home / Other | 52 | 25.0% |
| Total | 208 | 100.0% |
Housing Structures by Occupancy in Blessing
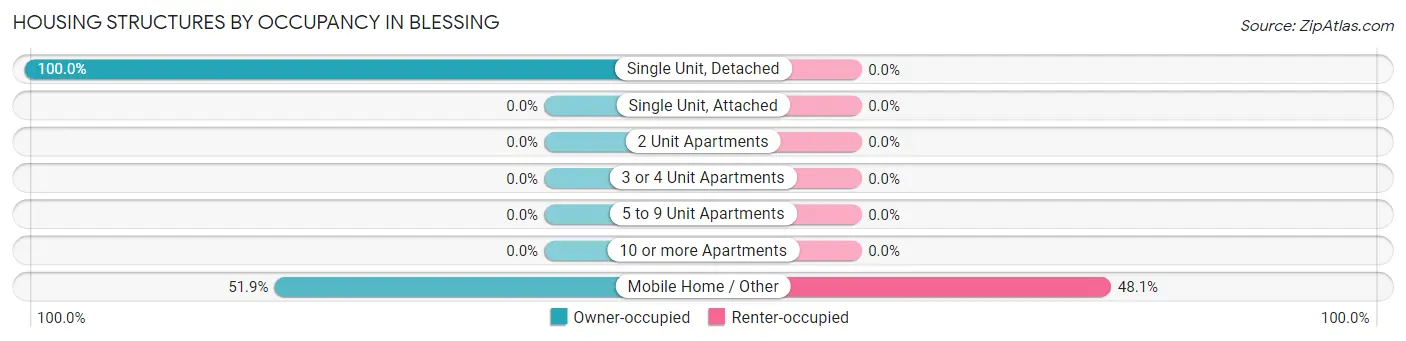
| Structure Type | Owner-occupied | Renter-occupied |
| Single Unit, Detached | 156 (100.0%) | 0 (0.0%) |
| Single Unit, Attached | 0 (0.0%) | 0 (0.0%) |
| 2 Unit Apartments | 0 (0.0%) | 0 (0.0%) |
| 3 or 4 Unit Apartments | 0 (0.0%) | 0 (0.0%) |
| 5 to 9 Unit Apartments | 0 (0.0%) | 0 (0.0%) |
| 10 or more Apartments | 0 (0.0%) | 0 (0.0%) |
| Mobile Home / Other | 27 (51.9%) | 25 (48.1%) |
| Total | 183 (88.0%) | 25 (12.0%) |
Housing Structures by Number of Rooms in Blessing
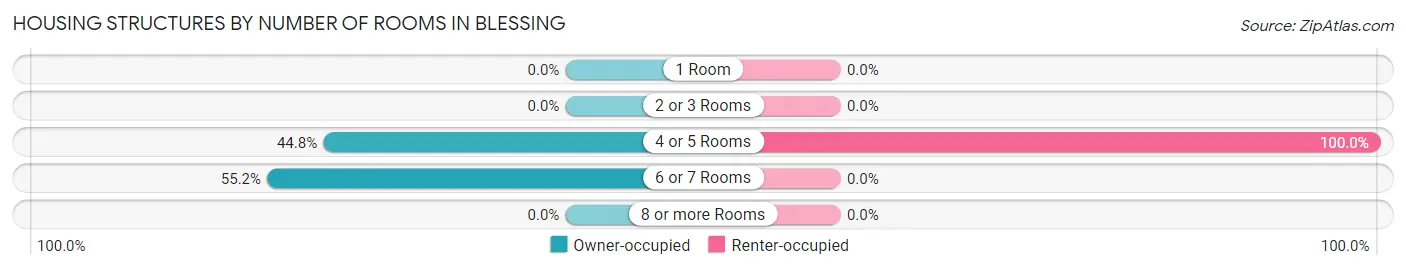
| Number of Rooms | Owner-occupied | Renter-occupied |
| 1 Room | 0 (0.0%) | 0 (0.0%) |
| 2 or 3 Rooms | 0 (0.0%) | 0 (0.0%) |
| 4 or 5 Rooms | 82 (44.8%) | 25 (100.0%) |
| 6 or 7 Rooms | 101 (55.2%) | 0 (0.0%) |
| 8 or more Rooms | 0 (0.0%) | 0 (0.0%) |
| Total | 183 (100.0%) | 25 (100.0%) |
Housing Structure by Heating Type in Blessing
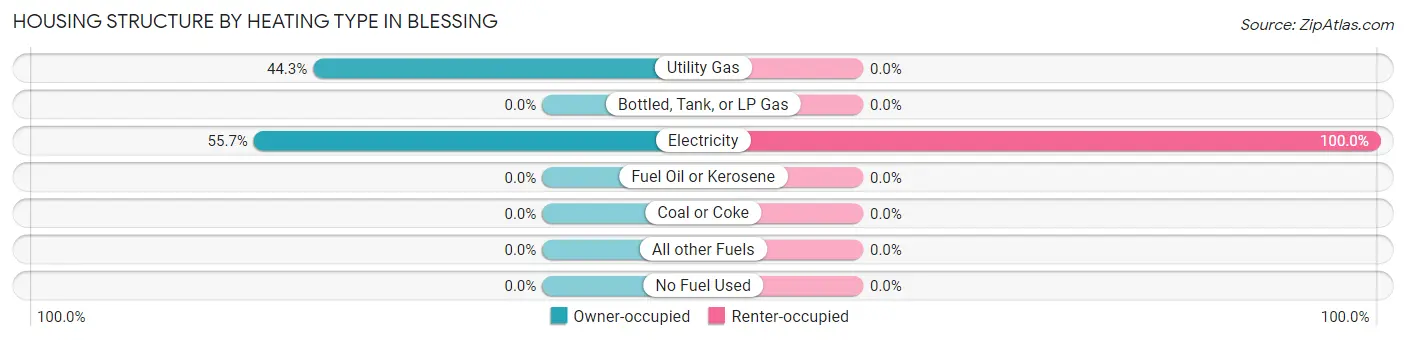
| Heating Type | Owner-occupied | Renter-occupied |
| Utility Gas | 81 (44.3%) | 0 (0.0%) |
| Bottled, Tank, or LP Gas | 0 (0.0%) | 0 (0.0%) |
| Electricity | 102 (55.7%) | 25 (100.0%) |
| Fuel Oil or Kerosene | 0 (0.0%) | 0 (0.0%) |
| Coal or Coke | 0 (0.0%) | 0 (0.0%) |
| All other Fuels | 0 (0.0%) | 0 (0.0%) |
| No Fuel Used | 0 (0.0%) | 0 (0.0%) |
| Total | 183 (100.0%) | 25 (100.0%) |
Household Vehicle Usage in Blessing
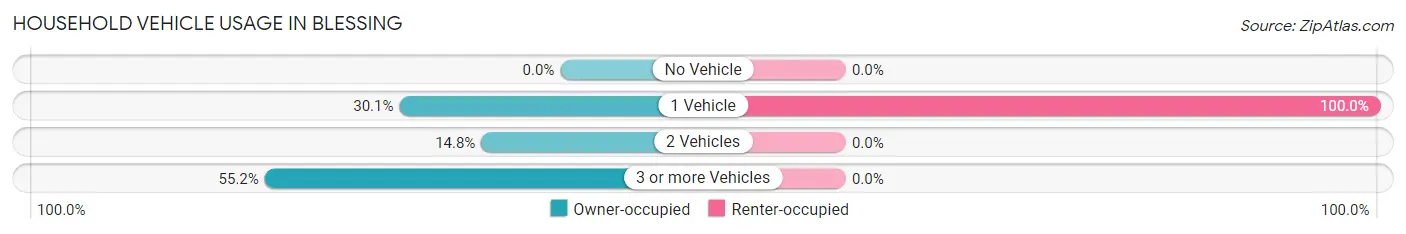
| Vehicles per Household | Owner-occupied | Renter-occupied |
| No Vehicle | 0 (0.0%) | 0 (0.0%) |
| 1 Vehicle | 55 (30.0%) | 25 (100.0%) |
| 2 Vehicles | 27 (14.7%) | 0 (0.0%) |
| 3 or more Vehicles | 101 (55.2%) | 0 (0.0%) |
| Total | 183 (100.0%) | 25 (100.0%) |
Real Estate & Mortgages in Blessing
Real Estate and Mortgage Overview in Blessing
| Characteristic | Without Mortgage | With Mortgage |
| Housing Units | 128 | 55 |
| Median Property Value | $155,200 | $0 |
| Median Household Income | $2,499 | $0 |
| Monthly Housing Costs | $621 | $0 |
| Real Estate Taxes | $1,183 | $0 |
Property Value by Mortgage Status in Blessing
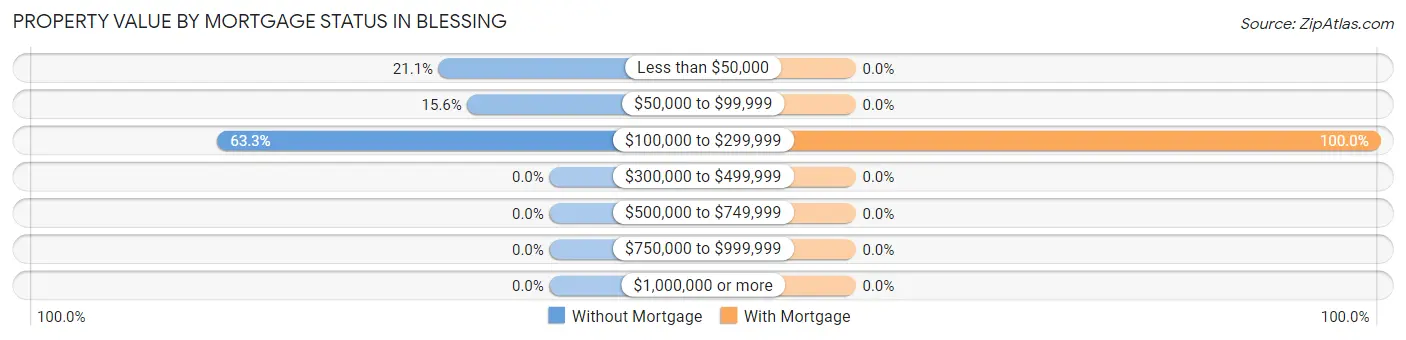
| Property Value | Without Mortgage | With Mortgage |
| Less than $50,000 | 27 (21.1%) | 0 (0.0%) |
| $50,000 to $99,999 | 20 (15.6%) | 0 (0.0%) |
| $100,000 to $299,999 | 81 (63.3%) | 55 (100.0%) |
| $300,000 to $499,999 | 0 (0.0%) | 0 (0.0%) |
| $500,000 to $749,999 | 0 (0.0%) | 0 (0.0%) |
| $750,000 to $999,999 | 0 (0.0%) | 0 (0.0%) |
| $1,000,000 or more | 0 (0.0%) | 0 (0.0%) |
| Total | 128 (100.0%) | 55 (100.0%) |
Household Income by Mortgage Status in Blessing
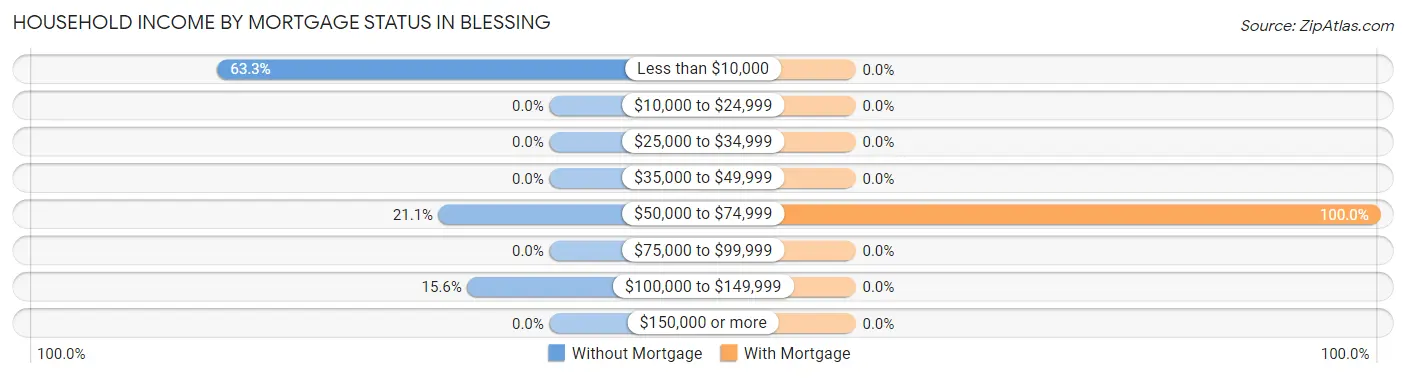
| Household Income | Without Mortgage | With Mortgage |
| Less than $10,000 | 81 (63.3%) | 0 (0.0%) |
| $10,000 to $24,999 | 0 (0.0%) | 0 (0.0%) |
| $25,000 to $34,999 | 0 (0.0%) | 0 (0.0%) |
| $35,000 to $49,999 | 0 (0.0%) | 0 (0.0%) |
| $50,000 to $74,999 | 27 (21.1%) | 55 (100.0%) |
| $75,000 to $99,999 | 0 (0.0%) | 0 (0.0%) |
| $100,000 to $149,999 | 20 (15.6%) | 0 (0.0%) |
| $150,000 or more | 0 (0.0%) | 0 (0.0%) |
| Total | 128 (100.0%) | 55 (100.0%) |
Property Value to Household Income Ratio in Blessing
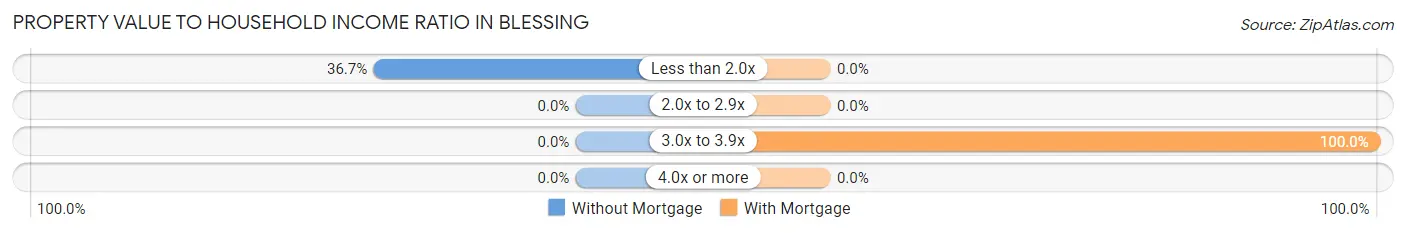
| Value-to-Income Ratio | Without Mortgage | With Mortgage |
| Less than 2.0x | 47 (36.7%) | 0 (0.0%) |
| 2.0x to 2.9x | 0 (0.0%) | 0 (0.0%) |
| 3.0x to 3.9x | 0 (0.0%) | 55 (100.0%) |
| 4.0x or more | 0 (0.0%) | 0 (0.0%) |
| Total | 128 (100.0%) | 55 (100.0%) |
Real Estate Taxes by Mortgage Status in Blessing
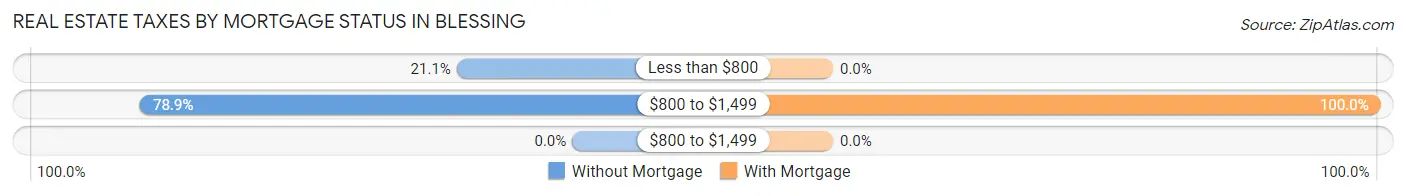
| Property Taxes | Without Mortgage | With Mortgage |
| Less than $800 | 27 (21.1%) | 0 (0.0%) |
| $800 to $1,499 | 101 (78.9%) | 55 (100.0%) |
| $800 to $1,499 | 0 (0.0%) | 0 (0.0%) |
| Total | 128 (100.0%) | 55 (100.0%) |
Health & Disability in Blessing
Health Insurance Coverage by Age in Blessing
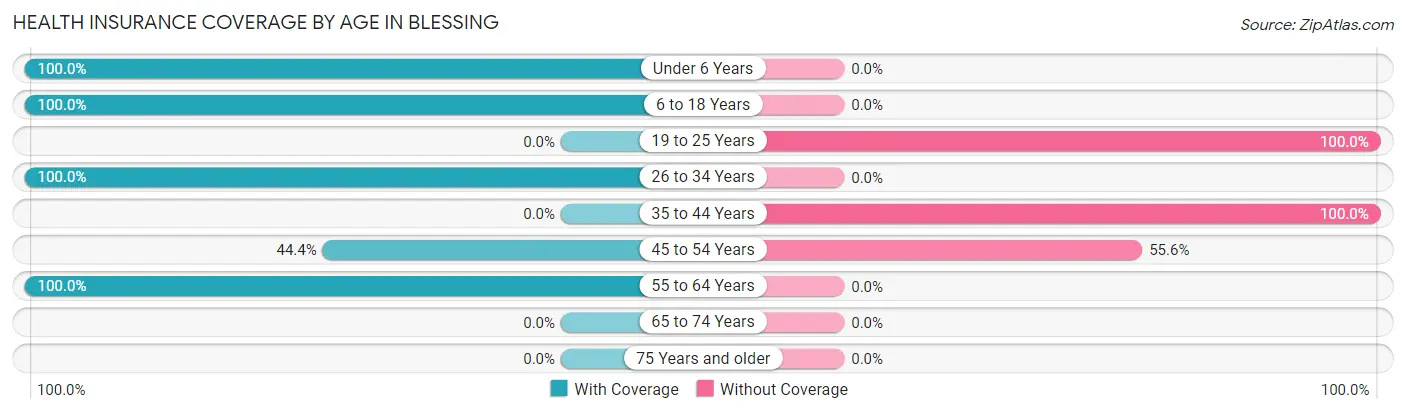
| Age Bracket | With Coverage | Without Coverage |
| Under 6 Years | 59 (100.0%) | 0 (0.0%) |
| 6 to 18 Years | 47 (100.0%) | 0 (0.0%) |
| 19 to 25 Years | 0 (0.0%) | 81 (100.0%) |
| 26 to 34 Years | 55 (100.0%) | 0 (0.0%) |
| 35 to 44 Years | 0 (0.0%) | 27 (100.0%) |
| 45 to 54 Years | 20 (44.4%) | 25 (55.6%) |
| 55 to 64 Years | 23 (100.0%) | 0 (0.0%) |
| 65 to 74 Years | 0 (0.0%) | 0 (0.0%) |
| 75 Years and older | 0 (0.0%) | 0 (0.0%) |
| Total | 204 (60.5%) | 133 (39.5%) |
Health Insurance Coverage by Citizenship Status in Blessing
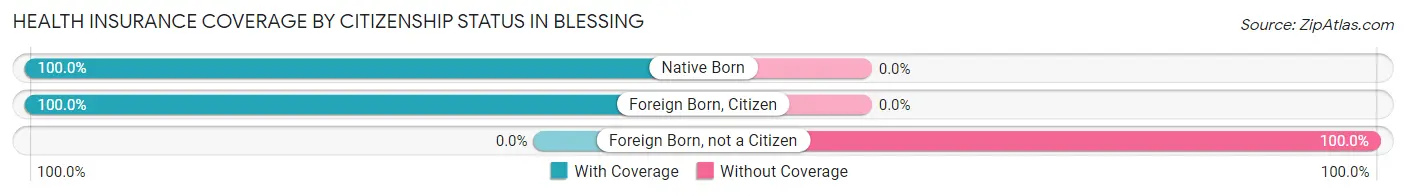
| Citizenship Status | With Coverage | Without Coverage |
| Native Born | 59 (100.0%) | 0 (0.0%) |
| Foreign Born, Citizen | 47 (100.0%) | 0 (0.0%) |
| Foreign Born, not a Citizen | 0 (0.0%) | 81 (100.0%) |
Health Insurance Coverage by Household Income in Blessing
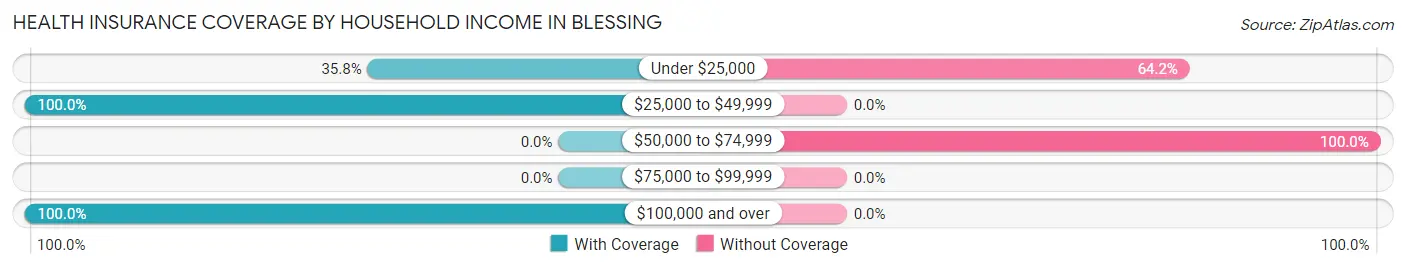
| Household Income | With Coverage | Without Coverage |
| Under $25,000 | 59 (35.8%) | 106 (64.2%) |
| $25,000 to $49,999 | 102 (100.0%) | 0 (0.0%) |
| $50,000 to $74,999 | 0 (0.0%) | 27 (100.0%) |
| $75,000 to $99,999 | 0 (0.0%) | 0 (0.0%) |
| $100,000 and over | 43 (100.0%) | 0 (0.0%) |
Public vs Private Health Insurance Coverage by Age in Blessing
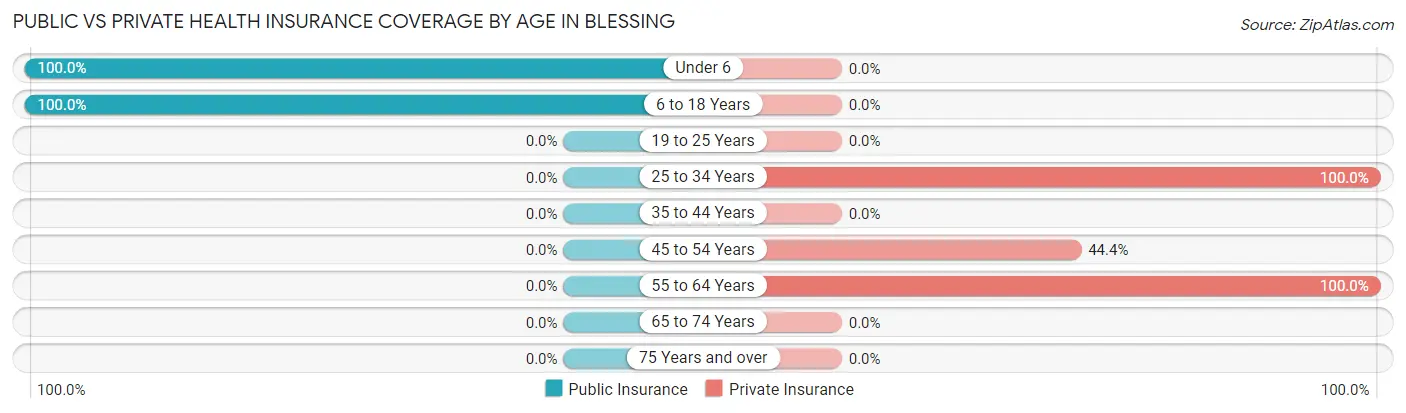
| Age Bracket | Public Insurance | Private Insurance |
| Under 6 | 59 (100.0%) | 0 (0.0%) |
| 6 to 18 Years | 47 (100.0%) | 0 (0.0%) |
| 19 to 25 Years | 0 (0.0%) | 0 (0.0%) |
| 25 to 34 Years | 0 (0.0%) | 55 (100.0%) |
| 35 to 44 Years | 0 (0.0%) | 0 (0.0%) |
| 45 to 54 Years | 0 (0.0%) | 20 (44.4%) |
| 55 to 64 Years | 0 (0.0%) | 23 (100.0%) |
| 65 to 74 Years | 0 (0.0%) | 0 (0.0%) |
| 75 Years and over | 0 (0.0%) | 0 (0.0%) |
| Total | 106 (31.5%) | 98 (29.1%) |
Disability Status by Sex by Age in Blessing
| Age Bracket | Male | Female |
| Under 5 Years | 0 (0.0%) | 0 (0.0%) |
| 5 to 17 Years | 0 (0.0%) | 0 (0.0%) |
| 18 to 34 Years | 0 (0.0%) | 0 (0.0%) |
| 35 to 64 Years | 0 (0.0%) | 0 (0.0%) |
| 65 to 74 Years | 0 (0.0%) | 0 (0.0%) |
| 75 Years and over | 0 (0.0%) | 0 (0.0%) |
Disability Class by Sex by Age in Blessing
Disability Class: Hearing Difficulty
| Age Bracket | Male | Female |
| Under 5 Years | 0 (0.0%) | 0 (0.0%) |
| 5 to 17 Years | 0 (0.0%) | 0 (0.0%) |
| 18 to 34 Years | 0 (0.0%) | 0 (0.0%) |
| 35 to 64 Years | 0 (0.0%) | 0 (0.0%) |
| 65 to 74 Years | 0 (0.0%) | 0 (0.0%) |
| 75 Years and over | 0 (0.0%) | 0 (0.0%) |
Disability Class: Vision Difficulty
| Age Bracket | Male | Female |
| Under 5 Years | 0 (0.0%) | 0 (0.0%) |
| 5 to 17 Years | 0 (0.0%) | 0 (0.0%) |
| 18 to 34 Years | 0 (0.0%) | 0 (0.0%) |
| 35 to 64 Years | 0 (0.0%) | 0 (0.0%) |
| 65 to 74 Years | 0 (0.0%) | 0 (0.0%) |
| 75 Years and over | 0 (0.0%) | 0 (0.0%) |
Disability Class: Cognitive Difficulty
| Age Bracket | Male | Female |
| 5 to 17 Years | 0 (0.0%) | 0 (0.0%) |
| 18 to 34 Years | 0 (0.0%) | 0 (0.0%) |
| 35 to 64 Years | 0 (0.0%) | 0 (0.0%) |
| 65 to 74 Years | 0 (0.0%) | 0 (0.0%) |
| 75 Years and over | 0 (0.0%) | 0 (0.0%) |
Disability Class: Ambulatory Difficulty
| Age Bracket | Male | Female |
| 5 to 17 Years | 0 (0.0%) | 0 (0.0%) |
| 18 to 34 Years | 0 (0.0%) | 0 (0.0%) |
| 35 to 64 Years | 0 (0.0%) | 0 (0.0%) |
| 65 to 74 Years | 0 (0.0%) | 0 (0.0%) |
| 75 Years and over | 0 (0.0%) | 0 (0.0%) |
Disability Class: Self-Care Difficulty

| Age Bracket | Male | Female |
| 5 to 17 Years | 0 (0.0%) | 0 (0.0%) |
| 18 to 34 Years | 0 (0.0%) | 0 (0.0%) |
| 35 to 64 Years | 0 (0.0%) | 0 (0.0%) |
| 65 to 74 Years | 0 (0.0%) | 0 (0.0%) |
| 75 Years and over | 0 (0.0%) | 0 (0.0%) |
Technology Access in Blessing
Computing Device Access in Blessing
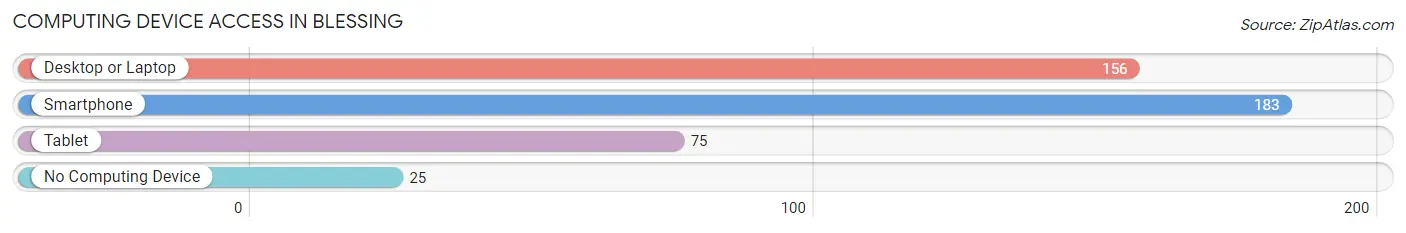
| Device Type | # Households | % Households |
| Desktop or Laptop | 156 | 75.0% |
| Smartphone | 183 | 88.0% |
| Tablet | 75 | 36.1% |
| No Computing Device | 25 | 12.0% |
| Total | 208 | 100.0% |
Internet Access in Blessing
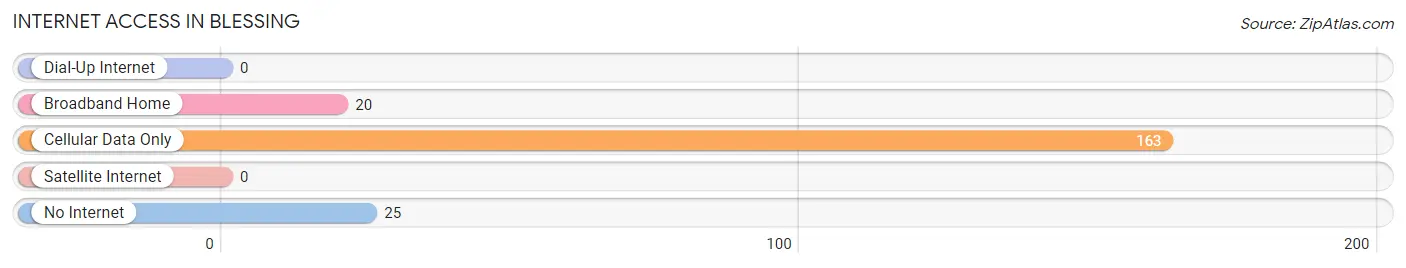
| Internet Type | # Households | % Households |
| Dial-Up Internet | 0 | 0.0% |
| Broadband Home | 20 | 9.6% |
| Cellular Data Only | 163 | 78.4% |
| Satellite Internet | 0 | 0.0% |
| No Internet | 25 | 12.0% |
| Total | 208 | 100.0% |
Blessing Summary
Blessing, Texas is a small town located in Matagorda County, Texas. It is situated on the Gulf Coast, approximately 90 miles southeast of Houston. The population of Blessing was estimated to be 545 in 2019.
History
Blessing was founded in 1892 by the Blessing Land and Immigration Company. The company was formed by a group of investors from Galveston, Texas, who wanted to develop the area for agricultural and industrial purposes. The town was named after the company's president, John Blessing.
The town was initially a farming community, with cotton and corn being the main crops. In the early 1900s, Blessing began to develop into a commercial center, with the opening of a post office, a bank, and a hotel.
In the 1920s, Blessing experienced a period of growth and prosperity. The town was home to several businesses, including a cotton gin, a lumber mill, and a canning factory. The town also had a movie theater, a library, and a hospital.
In the 1950s, Blessing began to decline. The cotton gin and lumber mill closed, and the canning factory moved away. The population of Blessing decreased, and the town became a quiet, rural community.
Geography
Blessing is located in Matagorda County, Texas, on the Gulf Coast. The town is situated on the banks of the Colorado River, approximately 90 miles southeast of Houston. The terrain is mostly flat, with some rolling hills. The climate is humid subtropical, with hot summers and mild winters.
Economy
The economy of Blessing is largely based on agriculture. The town is home to several farms, which produce cotton, corn, and other crops. Blessing also has a few small businesses, including a grocery store, a hardware store, and a restaurant.
Demographics
As of 2019, the population of Blessing was estimated to be 545. The racial makeup of the town was 94.3% White, 2.2% Hispanic or Latino, 1.3% African American, 0.7% Native American, and 1.5% from other races. The median household income was $37,500, and the median home value was $90,000.
Conclusion
Blessing, Texas is a small town located in Matagorda County, Texas. It was founded in 1892 and has a population of 545. The economy of Blessing is largely based on agriculture, and the town is home to several farms. The racial makeup of the town is 94.3% White, 2.2% Hispanic or Latino, 1.3% African American, 0.7% Native American, and 1.5% from other races. The median household income is $37,500, and the median home value is $90,000.
Common Questions
What is the Total Population of Blessing?
Total Population of Blessing is 337.
What is the Total Male Population of Blessing?
Total Male Population of Blessing is 209.
What is the Total Female Population of Blessing?
Total Female Population of Blessing is 128.
What is the Ratio of Males per 100 Females in Blessing?
There are 163.28 Males per 100 Females in Blessing.
What is the Ratio of Females per 100 Males in Blessing?
There are 61.24 Females per 100 Males in Blessing.
What is the Median Population Age in Blessing?
Median Population Age in Blessing is 24.8 Years.
What is the Average Family Size in Blessing
Average Family Size in Blessing is 1.8 People.
What is the Average Household Size in Blessing
Average Household Size in Blessing is 1.6 People.
What is Per Capita Income in Blessing?
Per Capita income in Blessing is $20,556.
What is the Median Family Income in Blessing?
Median Family Income in Blessing is $2,499.
What is Inequality or Gini Index in Blessing?
Inequality or Gini Index in Blessing is 0.59.
How Large is the Labor Force in Blessing?
There are 130 People in the Labor Forcein in Blessing.
What is the Percentage of People in the Labor Force in Blessing?
56.3% of People are in the Labor Force in Blessing.