Zip Codes with the Highest Percentage of Population Employed in Accommodation & Food Services in Amarillo, TX
RELATED REPORTS & OPTIONS
Accommodation & Food Services
Amarillo
Compare Zip Codes
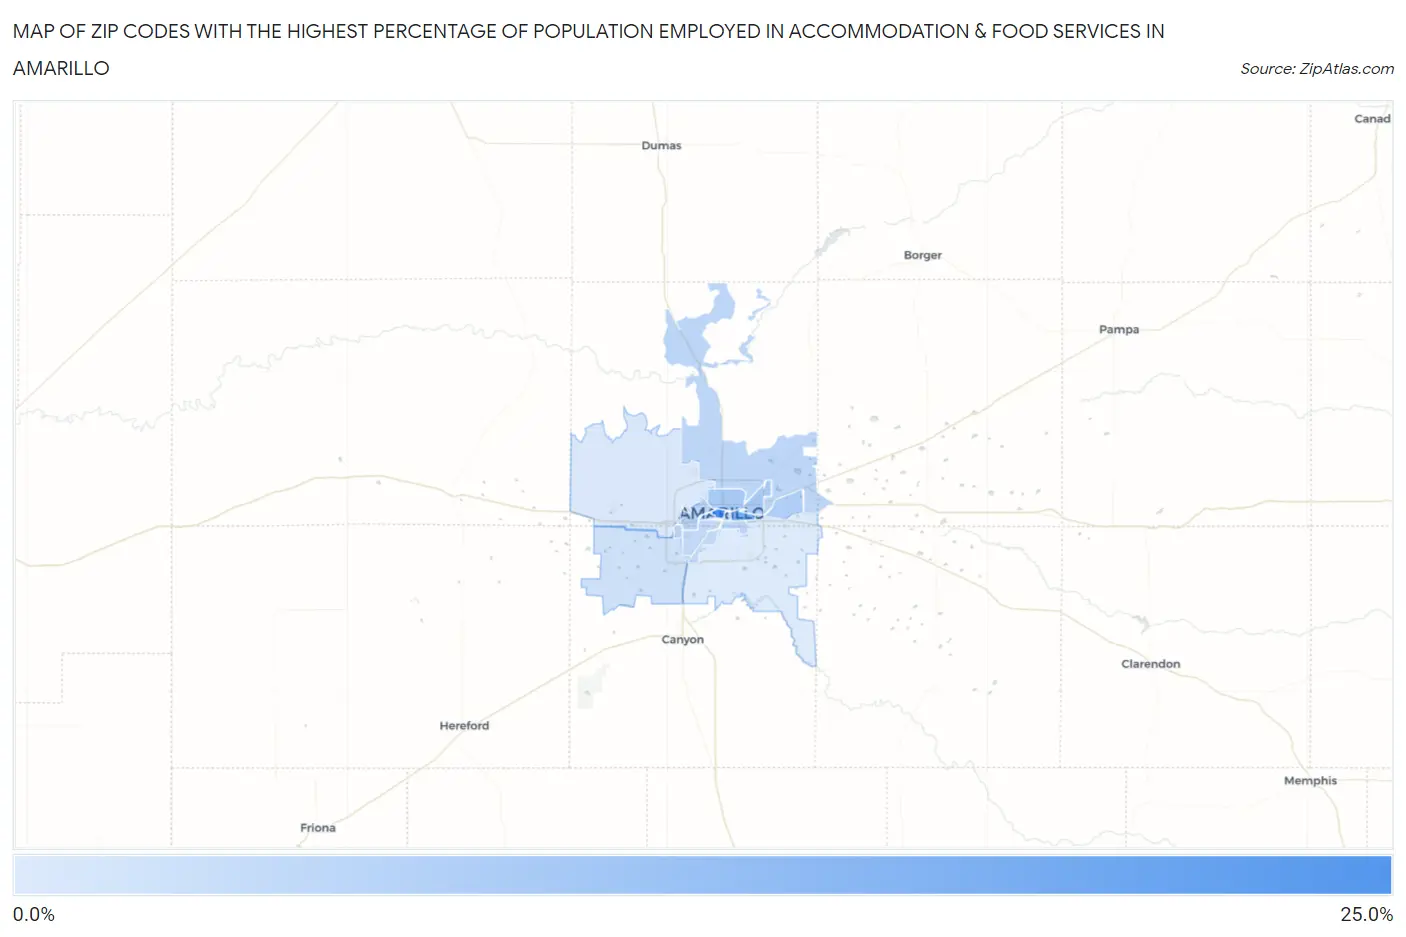
Map of Zip Codes with the Highest Percentage of Population Employed in Accommodation & Food Services in Amarillo
0.0%
25.0%
Zip Codes with the Highest Percentage of Population Employed in Accommodation & Food Services in Amarillo, TX
| Zip Code | % Employed | vs State | vs National | |
| 1. | 79101 | 24.5% | 7.2%(+17.3)#27 | 6.9%(+17.7)#527 |
| 2. | 79104 | 17.2% | 7.2%(+9.97)#63 | 6.9%(+10.3)#1,236 |
| 3. | 79107 | 11.0% | 7.2%(+3.83)#211 | 6.9%(+4.15)#3,527 |
| 4. | 79102 | 10.0% | 7.2%(+2.83)#287 | 6.9%(+3.15)#4,488 |
| 5. | 79111 | 10.0% | 7.2%(+2.79)#289 | 6.9%(+3.12)#4,538 |
| 6. | 79106 | 9.1% | 7.2%(+1.90)#387 | 6.9%(+2.22)#5,798 |
| 7. | 79108 | 8.5% | 7.2%(+1.31)#474 | 6.9%(+1.64)#6,797 |
| 8. | 79103 | 8.3% | 7.2%(+1.09)#506 | 6.9%(+1.42)#7,223 |
| 9. | 79109 | 8.0% | 7.2%(+0.751)#563 | 6.9%(+1.08)#7,906 |
| 10. | 79110 | 7.9% | 7.2%(+0.742)#565 | 6.9%(+1.07)#7,929 |
| 11. | 79121 | 7.7% | 7.2%(+0.539)#591 | 6.9%(+0.864)#8,383 |
| 12. | 79119 | 6.2% | 7.2%(-1.05)#890 | 6.9%(-0.728)#12,956 |
| 13. | 79124 | 4.6% | 7.2%(-2.59)#1,167 | 6.9%(-2.27)#18,131 |
| 14. | 79118 | 4.4% | 7.2%(-2.83)#1,211 | 6.9%(-2.50)#18,888 |
1
Common Questions
What are the Top 10 Zip Codes with the Highest Percentage of Population Employed in Accommodation & Food Services in Amarillo, TX?
Top 10 Zip Codes with the Highest Percentage of Population Employed in Accommodation & Food Services in Amarillo, TX are:
What zip code has the Highest Percentage of Population Employed in Accommodation & Food Services in Amarillo, TX?
79101 has the Highest Percentage of Population Employed in Accommodation & Food Services in Amarillo, TX with 24.5%.
What is the Percentage of Population Employed in Accommodation & Food Services in Amarillo, TX?
Percentage of Population Employed in Accommodation & Food Services in Amarillo is 8.6%.
What is the Percentage of Population Employed in Accommodation & Food Services in Texas?
Percentage of Population Employed in Accommodation & Food Services in Texas is 7.2%.
What is the Percentage of Population Employed in Accommodation & Food Services in the United States?
Percentage of Population Employed in Accommodation & Food Services in the United States is 6.9%.