Zip Codes with the Highest Percentage of Population Employed in Accommodation & Food Services in Irving, TX
RELATED REPORTS & OPTIONS
Accommodation & Food Services
Irving
Compare Zip Codes
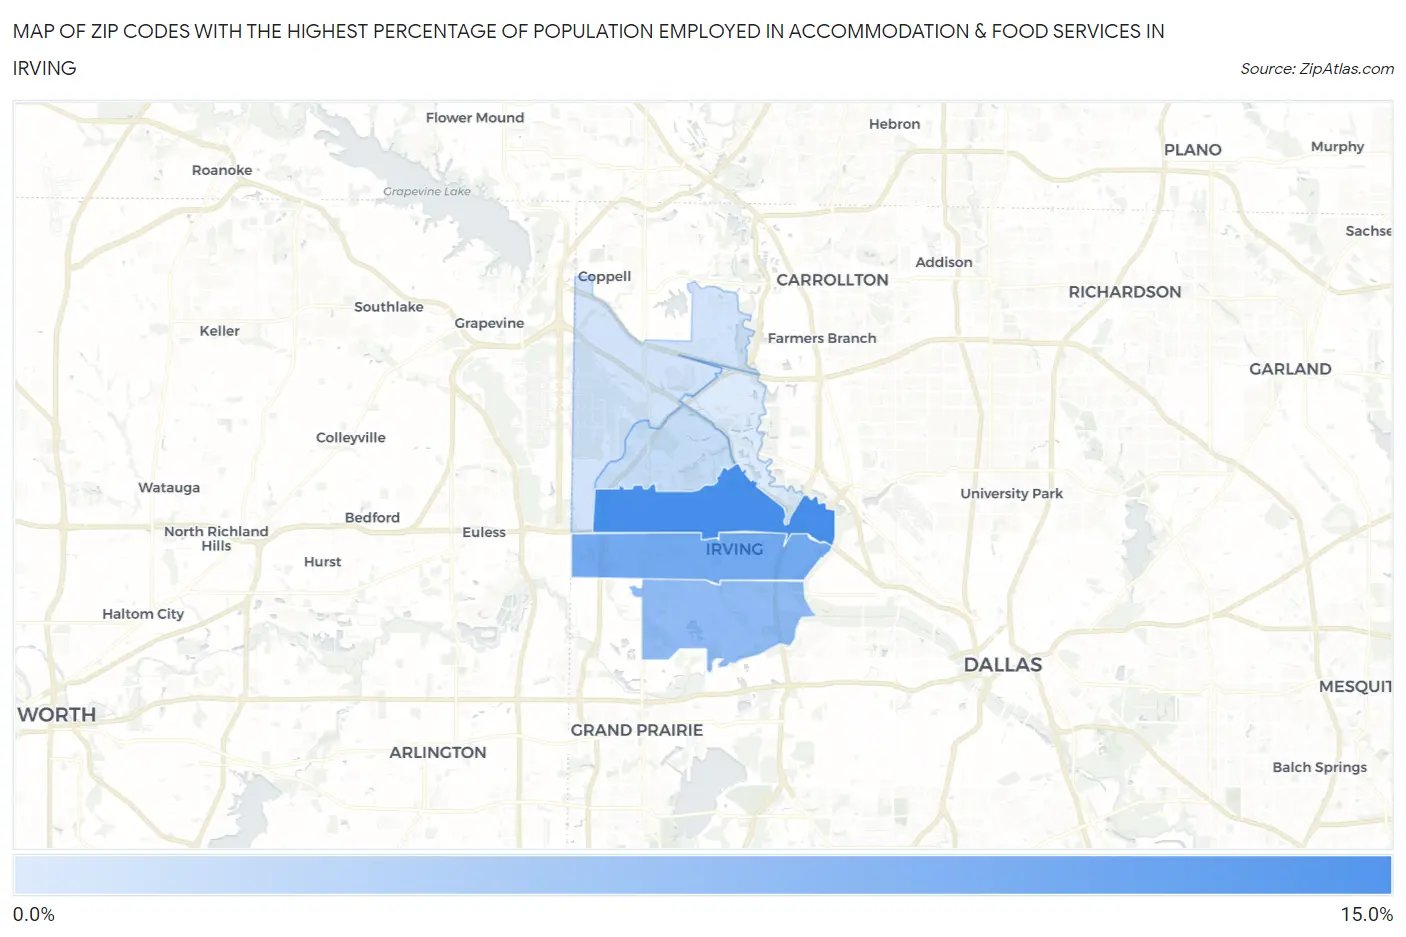
Map of Zip Codes with the Highest Percentage of Population Employed in Accommodation & Food Services in Irving
0.0%
15.0%
Zip Codes with the Highest Percentage of Population Employed in Accommodation & Food Services in Irving, TX
| Zip Code | % Employed | vs State | vs National | |
| 1. | 75062 | 12.5% | 7.2%(+5.29)#148 | 6.9%(+5.62)#2,581 |
| 2. | 75061 | 10.0% | 7.2%(+2.84)#285 | 6.9%(+3.17)#4,470 |
| 3. | 75060 | 8.6% | 7.2%(+1.35)#461 | 6.9%(+1.68)#6,712 |
| 4. | 75038 | 5.7% | 7.2%(-1.55)#971 | 6.9%(-1.22)#14,521 |
| 5. | 75063 | 5.1% | 7.2%(-2.12)#1,070 | 6.9%(-1.80)#16,530 |
| 6. | 75039 | 4.4% | 7.2%(-2.78)#1,204 | 6.9%(-2.46)#18,749 |
1
Common Questions
What are the Top 5 Zip Codes with the Highest Percentage of Population Employed in Accommodation & Food Services in Irving, TX?
Top 5 Zip Codes with the Highest Percentage of Population Employed in Accommodation & Food Services in Irving, TX are:
What zip code has the Highest Percentage of Population Employed in Accommodation & Food Services in Irving, TX?
75062 has the Highest Percentage of Population Employed in Accommodation & Food Services in Irving, TX with 12.5%.
What is the Percentage of Population Employed in Accommodation & Food Services in Irving, TX?
Percentage of Population Employed in Accommodation & Food Services in Irving is 8.3%.
What is the Percentage of Population Employed in Accommodation & Food Services in Texas?
Percentage of Population Employed in Accommodation & Food Services in Texas is 7.2%.
What is the Percentage of Population Employed in Accommodation & Food Services in the United States?
Percentage of Population Employed in Accommodation & Food Services in the United States is 6.9%.