Zip Codes with the Highest Percentage of Population Employed in Accommodation & Food Services in Corpus Christi, TX
RELATED REPORTS & OPTIONS
Accommodation & Food Services
Corpus Christi
Compare Zip Codes
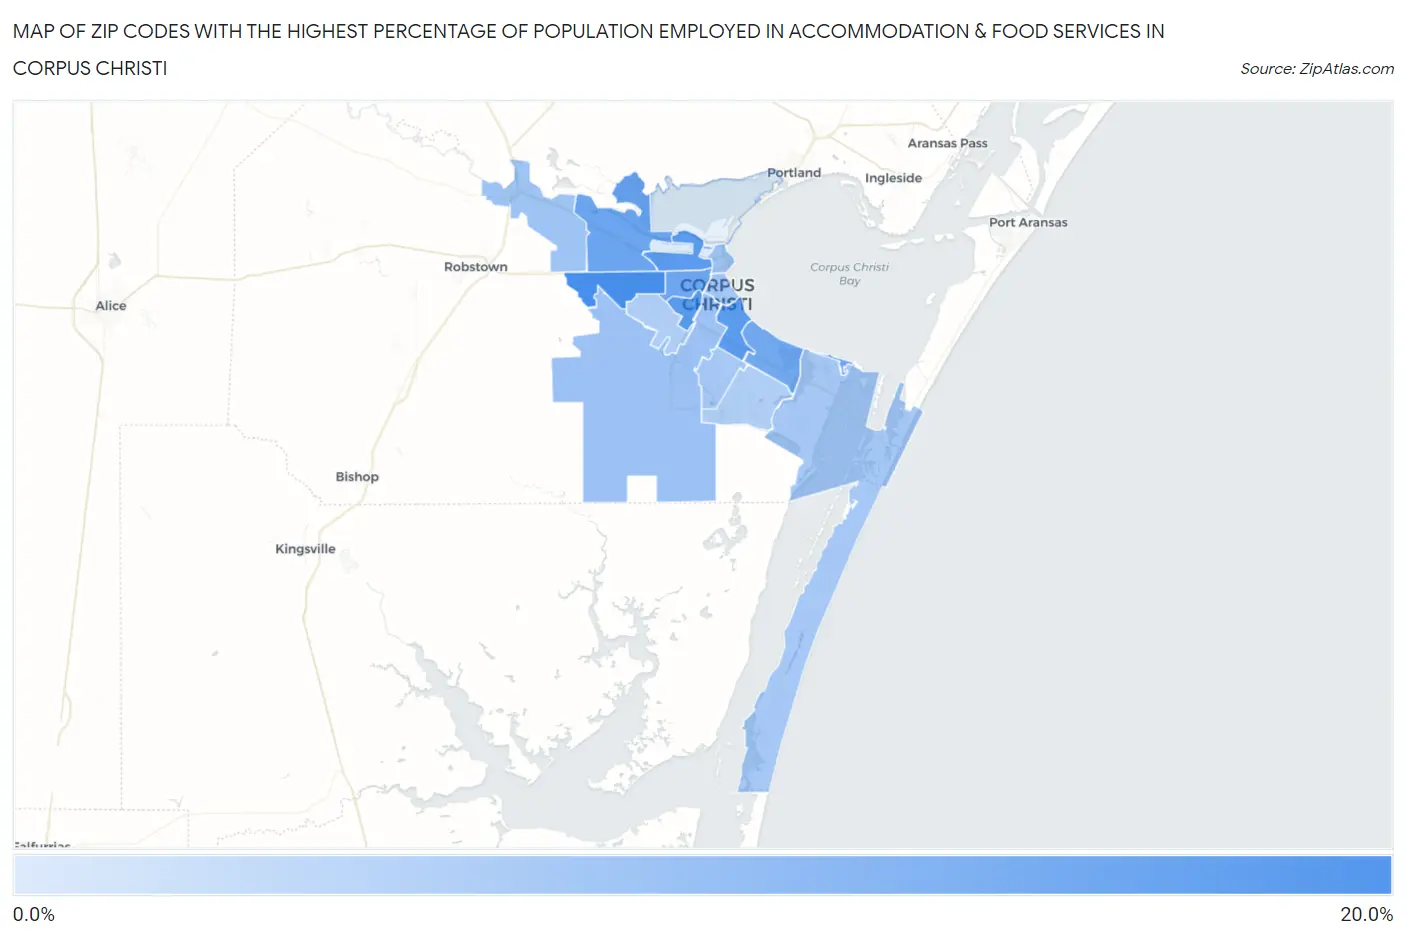
Map of Zip Codes with the Highest Percentage of Population Employed in Accommodation & Food Services in Corpus Christi
0.0%
20.0%
Zip Codes with the Highest Percentage of Population Employed in Accommodation & Food Services in Corpus Christi, TX
| Zip Code | % Employed | vs State | vs National | |
| 1. | 78406 | 17.5% | 7.2%(+10.3)#60 | 6.9%(+10.6)#1,176 |
| 2. | 78416 | 15.8% | 7.2%(+8.59)#75 | 6.9%(+8.91)#1,496 |
| 3. | 78408 | 15.5% | 7.2%(+8.31)#80 | 6.9%(+8.63)#1,551 |
| 4. | 78411 | 15.2% | 7.2%(+8.04)#83 | 6.9%(+8.37)#1,613 |
| 5. | 78409 | 13.6% | 7.2%(+6.36)#108 | 6.9%(+6.68)#2,108 |
| 6. | 78419 | 13.4% | 7.2%(+6.24)#113 | 6.9%(+6.56)#2,161 |
| 7. | 78405 | 13.2% | 7.2%(+6.02)#124 | 6.9%(+6.34)#2,258 |
| 8. | 78412 | 12.6% | 7.2%(+5.36)#143 | 6.9%(+5.69)#2,553 |
| 9. | 78415 | 8.5% | 7.2%(+1.26)#479 | 6.9%(+1.59)#6,876 |
| 10. | 78401 | 8.4% | 7.2%(+1.16)#492 | 6.9%(+1.49)#7,055 |
| 11. | 78410 | 8.0% | 7.2%(+0.841)#553 | 6.9%(+1.17)#7,733 |
| 12. | 78404 | 7.5% | 7.2%(+0.280)#635 | 6.9%(+0.605)#9,023 |
| 13. | 78418 | 7.4% | 7.2%(+0.208)#646 | 6.9%(+0.533)#9,213 |
| 14. | 78413 | 7.3% | 7.2%(+0.095)#667 | 6.9%(+0.420)#9,515 |
| 15. | 78417 | 6.3% | 7.2%(-0.886)#863 | 6.9%(-0.561)#12,418 |
| 16. | 78414 | 6.1% | 7.2%(-1.09)#896 | 6.9%(-0.764)#13,071 |
| 17. | 78407 | 1.8% | 7.2%(-5.40)#1,545 | 6.9%(-5.08)#25,944 |
1
Common Questions
What are the Top 10 Zip Codes with the Highest Percentage of Population Employed in Accommodation & Food Services in Corpus Christi, TX?
Top 10 Zip Codes with the Highest Percentage of Population Employed in Accommodation & Food Services in Corpus Christi, TX are:
What zip code has the Highest Percentage of Population Employed in Accommodation & Food Services in Corpus Christi, TX?
78406 has the Highest Percentage of Population Employed in Accommodation & Food Services in Corpus Christi, TX with 17.5%.
What is the Percentage of Population Employed in Accommodation & Food Services in Corpus Christi, TX?
Percentage of Population Employed in Accommodation & Food Services in Corpus Christi is 9.5%.
What is the Percentage of Population Employed in Accommodation & Food Services in Texas?
Percentage of Population Employed in Accommodation & Food Services in Texas is 7.2%.
What is the Percentage of Population Employed in Accommodation & Food Services in the United States?
Percentage of Population Employed in Accommodation & Food Services in the United States is 6.9%.