Zip Codes with the Highest Percentage of Population Employed in Accommodation & Food Services in Beaumont, TX
RELATED REPORTS & OPTIONS
Accommodation & Food Services
Beaumont
Compare Zip Codes
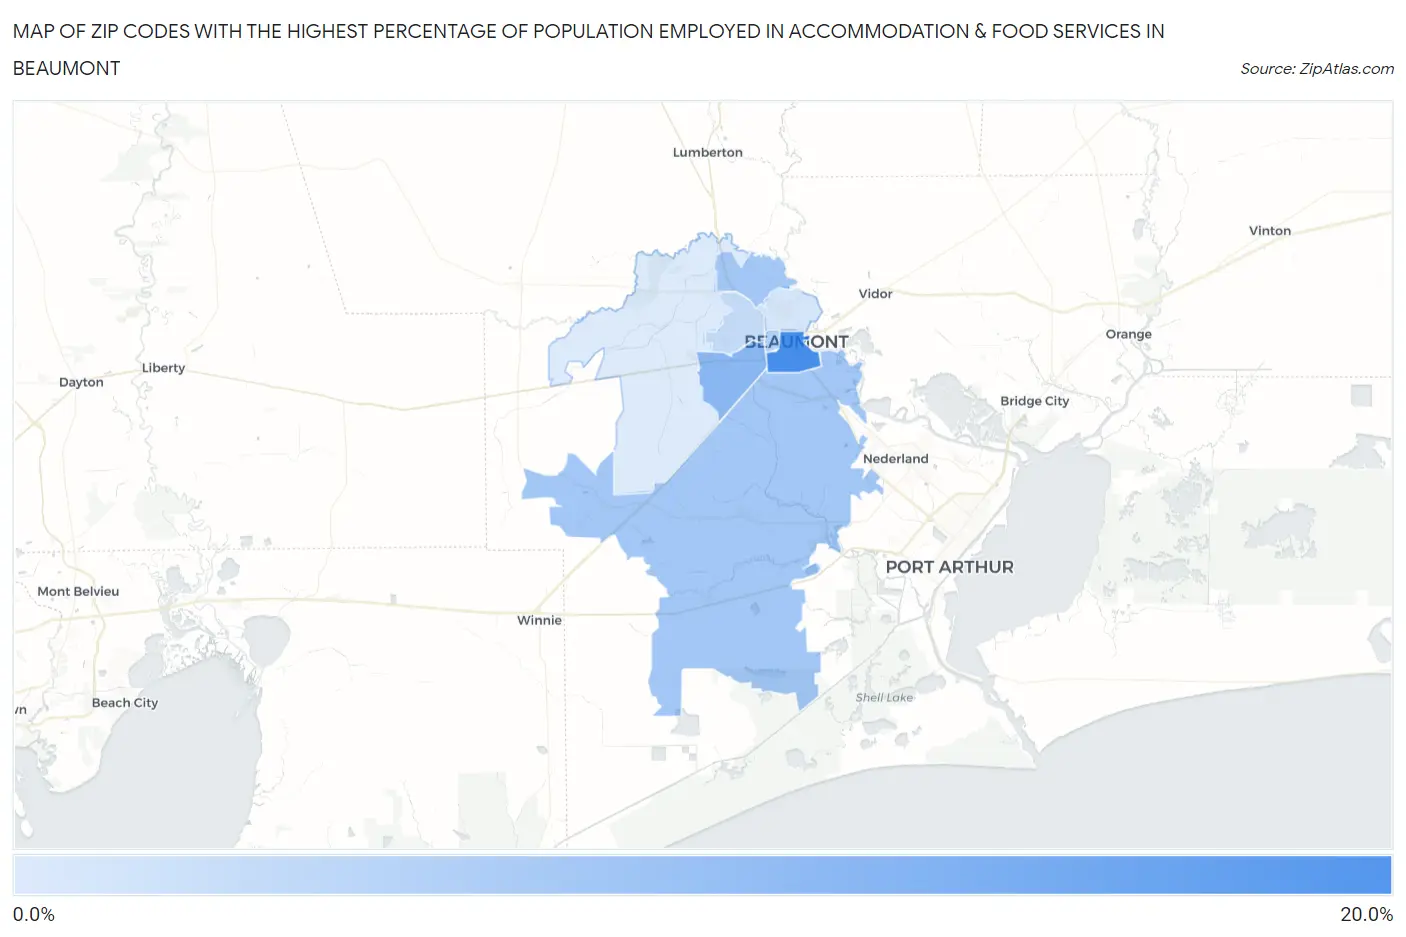
Map of Zip Codes with the Highest Percentage of Population Employed in Accommodation & Food Services in Beaumont
0.0%
20.0%
Zip Codes with the Highest Percentage of Population Employed in Accommodation & Food Services in Beaumont, TX
| Zip Code | % Employed | vs State | vs National | |
| 1. | 77701 | 16.0% | 7.2%(+8.79)#73 | 6.9%(+9.12)#1,456 |
| 2. | 77707 | 10.8% | 7.2%(+3.61)#225 | 6.9%(+3.94)#3,707 |
| 3. | 77708 | 9.0% | 7.2%(+1.76)#409 | 6.9%(+2.08)#6,015 |
| 4. | 77705 | 8.9% | 7.2%(+1.67)#419 | 6.9%(+2.00)#6,150 |
| 5. | 77702 | 7.7% | 7.2%(+0.522)#595 | 6.9%(+0.847)#8,420 |
| 6. | 77706 | 6.5% | 7.2%(-0.746)#826 | 6.9%(-0.421)#11,969 |
| 7. | 77703 | 5.2% | 7.2%(-2.01)#1,048 | 6.9%(-1.69)#16,131 |
| 8. | 77713 | 4.7% | 7.2%(-2.52)#1,155 | 6.9%(-2.19)#17,849 |
1
Common Questions
What are the Top 5 Zip Codes with the Highest Percentage of Population Employed in Accommodation & Food Services in Beaumont, TX?
Top 5 Zip Codes with the Highest Percentage of Population Employed in Accommodation & Food Services in Beaumont, TX are:
What zip code has the Highest Percentage of Population Employed in Accommodation & Food Services in Beaumont, TX?
77701 has the Highest Percentage of Population Employed in Accommodation & Food Services in Beaumont, TX with 16.0%.
What is the Percentage of Population Employed in Accommodation & Food Services in Beaumont, TX?
Percentage of Population Employed in Accommodation & Food Services in Beaumont is 9.4%.
What is the Percentage of Population Employed in Accommodation & Food Services in Texas?
Percentage of Population Employed in Accommodation & Food Services in Texas is 7.2%.
What is the Percentage of Population Employed in Accommodation & Food Services in the United States?
Percentage of Population Employed in Accommodation & Food Services in the United States is 6.9%.