Zip Codes with the Highest Percentage of Population Employed in Accommodation & Food Services in Orange, TX
RELATED REPORTS & OPTIONS
Accommodation & Food Services
Orange
Compare Zip Codes
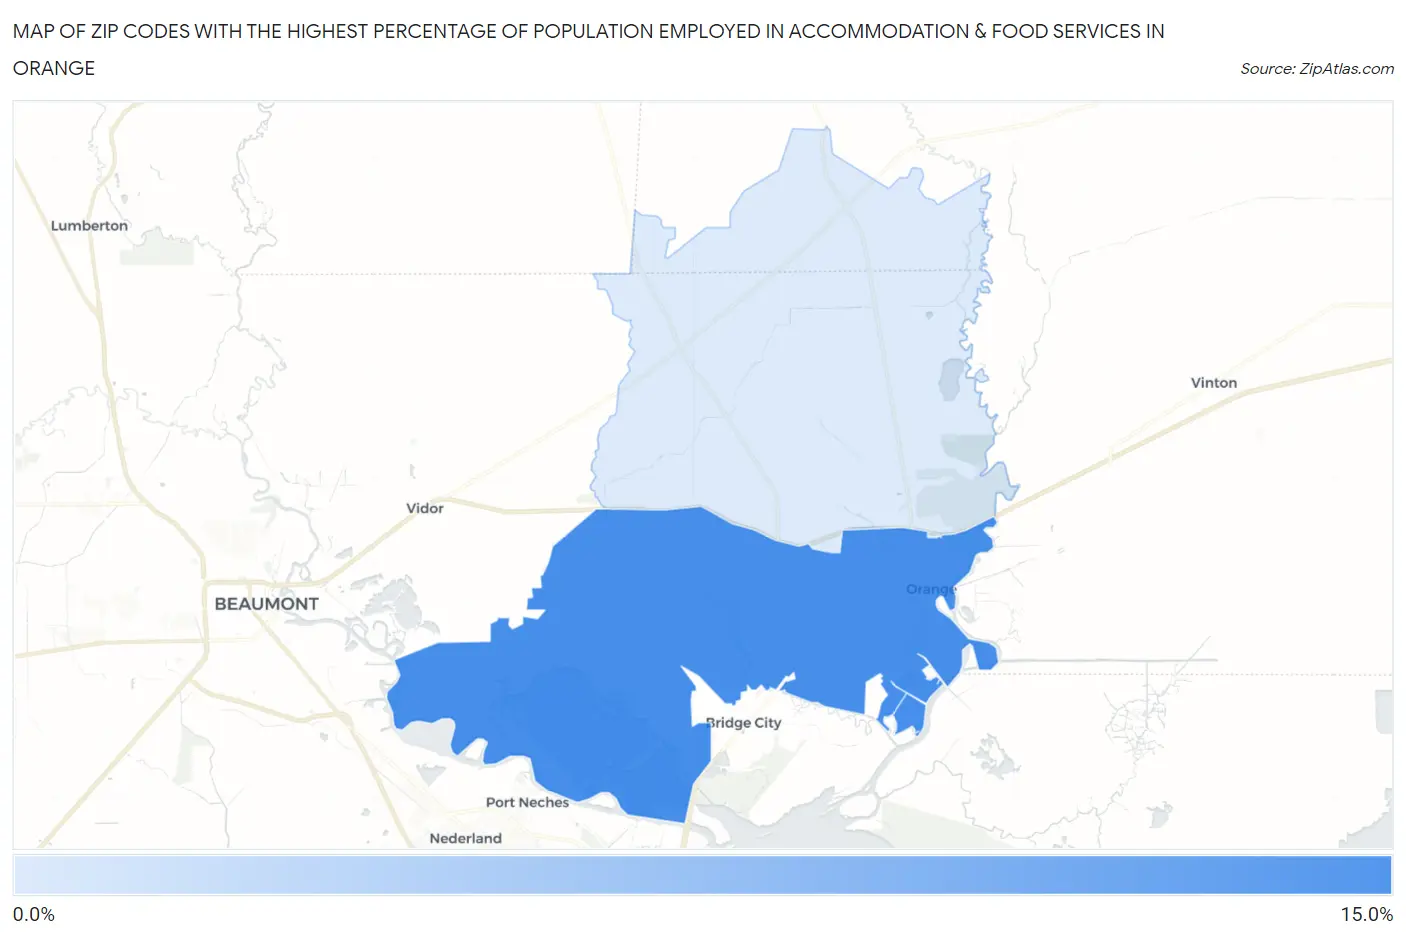
Map of Zip Codes with the Highest Percentage of Population Employed in Accommodation & Food Services in Orange
0.0%
15.0%
Zip Codes with the Highest Percentage of Population Employed in Accommodation & Food Services in Orange, TX
| Zip Code | % Employed | vs State | vs National | |
| 1. | 77630 | 10.2% | 7.2%(+3.03)#265 | 6.9%(+3.35)#4,260 |
| 2. | 77632 | 3.8% | 7.2%(-3.37)#1,295 | 6.9%(-3.04)#20,668 |
1
Common Questions
What are the Top Zip Codes with the Highest Percentage of Population Employed in Accommodation & Food Services in Orange, TX?
Top Zip Codes with the Highest Percentage of Population Employed in Accommodation & Food Services in Orange, TX are:
What zip code has the Highest Percentage of Population Employed in Accommodation & Food Services in Orange, TX?
77630 has the Highest Percentage of Population Employed in Accommodation & Food Services in Orange, TX with 10.2%.
What is the Percentage of Population Employed in Accommodation & Food Services in Orange, TX?
Percentage of Population Employed in Accommodation & Food Services in Orange is 10.0%.
What is the Percentage of Population Employed in Accommodation & Food Services in Texas?
Percentage of Population Employed in Accommodation & Food Services in Texas is 7.2%.
What is the Percentage of Population Employed in Accommodation & Food Services in the United States?
Percentage of Population Employed in Accommodation & Food Services in the United States is 6.9%.