Zip Codes with the Highest Percentage of Population Employed in Accommodation & Food Services in Terrell, TX
RELATED REPORTS & OPTIONS
Accommodation & Food Services
Terrell
Compare Zip Codes
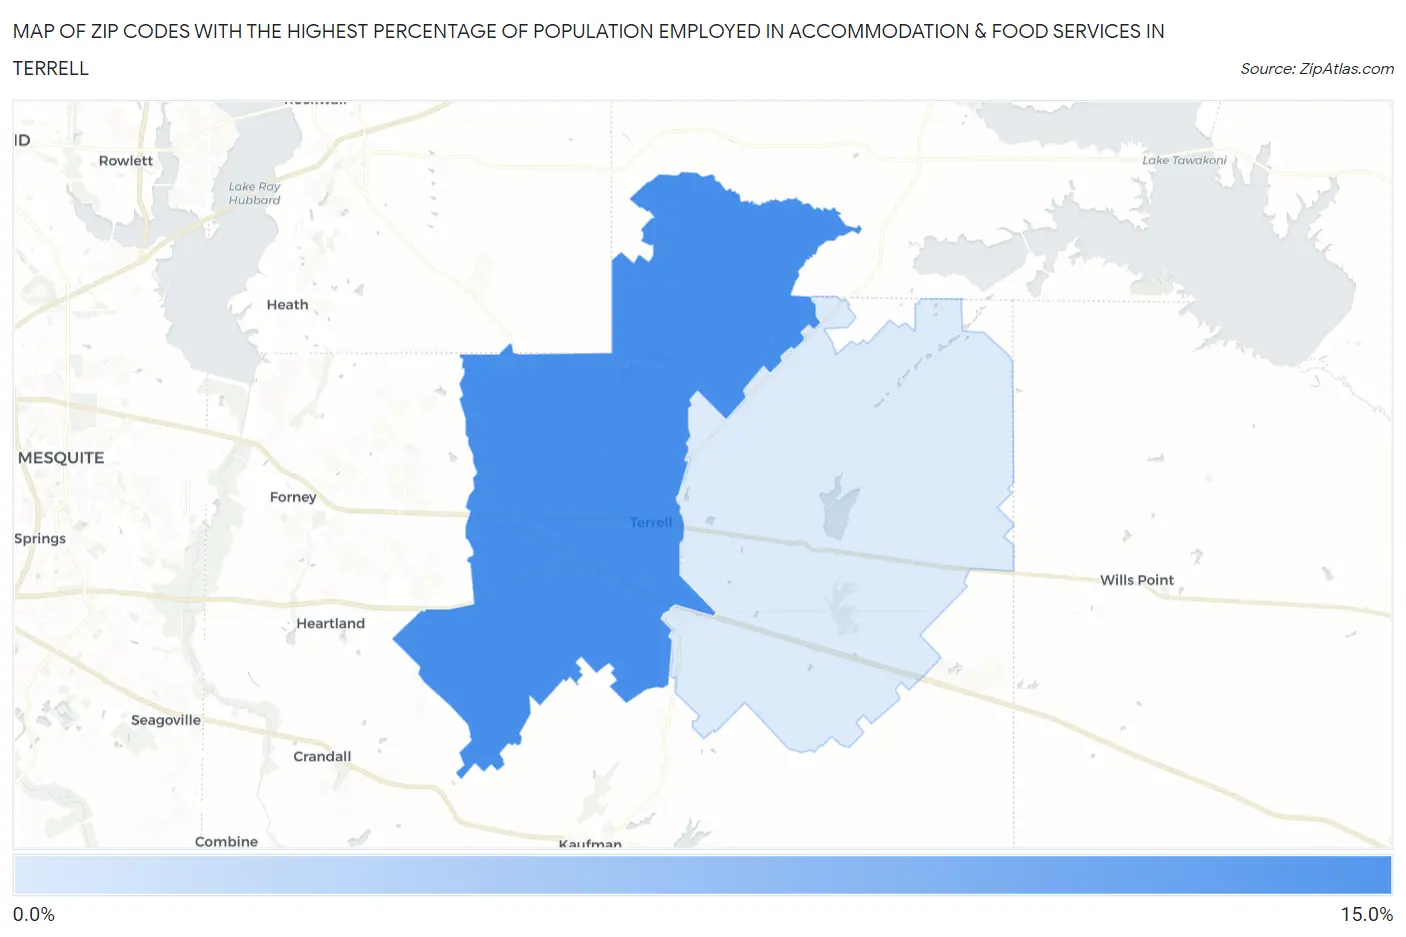
Map of Zip Codes with the Highest Percentage of Population Employed in Accommodation & Food Services in Terrell
0.0%
15.0%
Zip Codes with the Highest Percentage of Population Employed in Accommodation & Food Services in Terrell, TX
| Zip Code | % Employed | vs State | vs National | |
| 1. | 75160 | 10.5% | 7.2%(+3.28)#243 | 6.9%(+3.60)#4,006 |
| 2. | 75161 | 3.2% | 7.2%(-3.98)#1,405 | 6.9%(-3.65)#22,616 |
1
Common Questions
What are the Top Zip Codes with the Highest Percentage of Population Employed in Accommodation & Food Services in Terrell, TX?
Top Zip Codes with the Highest Percentage of Population Employed in Accommodation & Food Services in Terrell, TX are:
What zip code has the Highest Percentage of Population Employed in Accommodation & Food Services in Terrell, TX?
75160 has the Highest Percentage of Population Employed in Accommodation & Food Services in Terrell, TX with 10.5%.
What is the Percentage of Population Employed in Accommodation & Food Services in Terrell, TX?
Percentage of Population Employed in Accommodation & Food Services in Terrell is 13.3%.
What is the Percentage of Population Employed in Accommodation & Food Services in Texas?
Percentage of Population Employed in Accommodation & Food Services in Texas is 7.2%.
What is the Percentage of Population Employed in Accommodation & Food Services in the United States?
Percentage of Population Employed in Accommodation & Food Services in the United States is 6.9%.