Zip Codes with the Highest Percentage of Population Employed in Accommodation & Food Services in Dallas, TX
RELATED REPORTS & OPTIONS
Accommodation & Food Services
Dallas
Compare Zip Codes
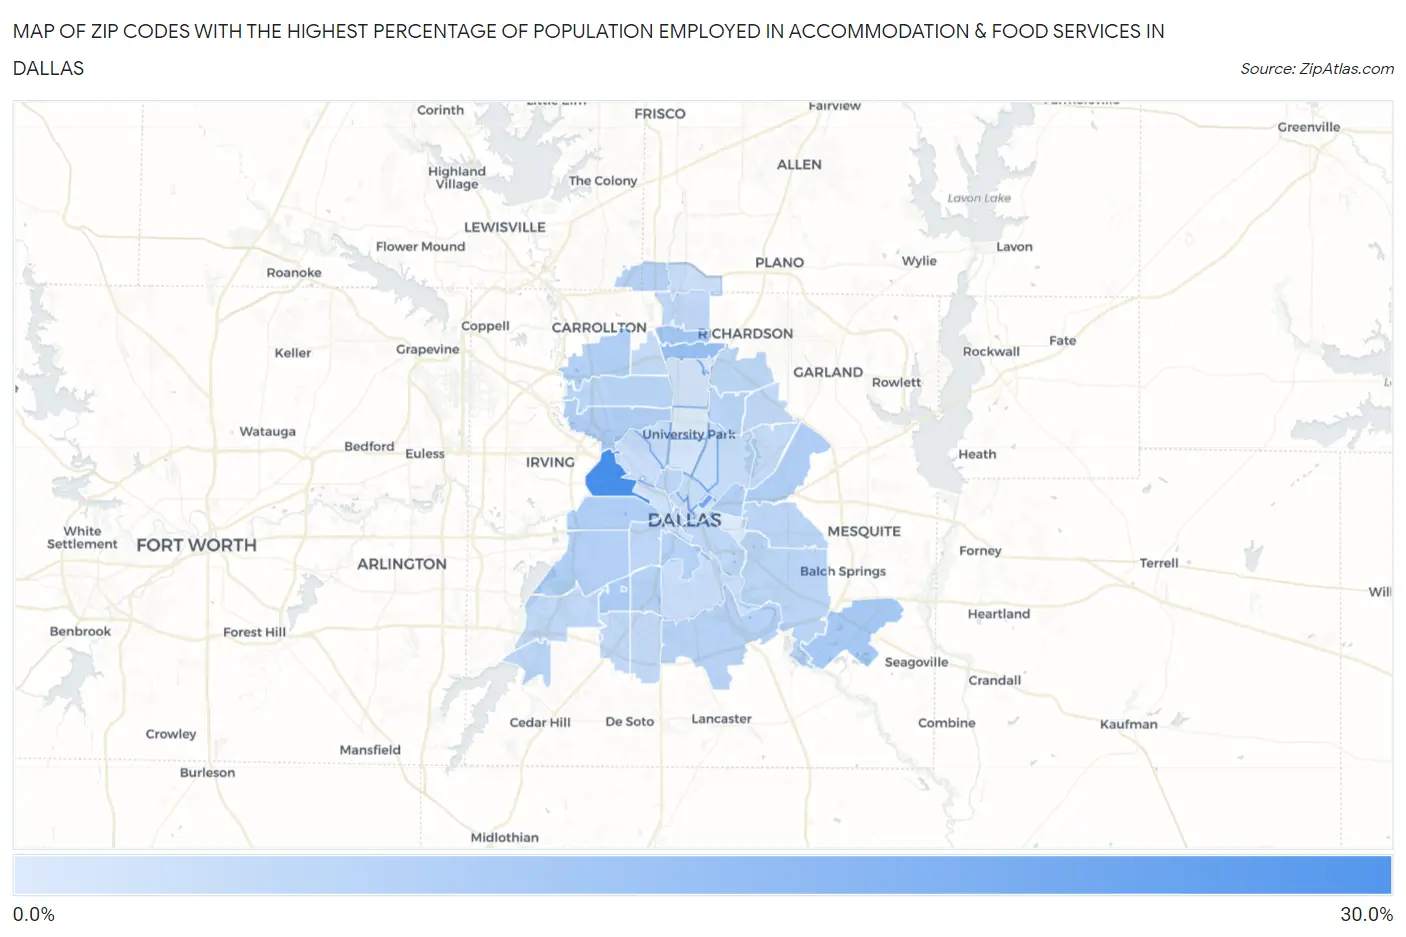
Map of Zip Codes with the Highest Percentage of Population Employed in Accommodation & Food Services in Dallas
0.0%
30.0%
Zip Codes with the Highest Percentage of Population Employed in Accommodation & Food Services in Dallas, TX
| Zip Code | % Employed | vs State | vs National | |
| 1. | 75247 | 29.8% | 7.2%(+22.5)#19 | 6.9%(+22.9)#338 |
| 2. | 75246 | 21.8% | 7.2%(+14.6)#35 | 6.9%(+14.9)#687 |
| 3. | 75240 | 14.0% | 7.2%(+6.84)#102 | 6.9%(+7.17)#1,957 |
| 4. | 75254 | 12.1% | 7.2%(+4.85)#160 | 6.9%(+5.18)#2,795 |
| 5. | 75253 | 11.1% | 7.2%(+3.87)#208 | 6.9%(+4.20)#3,492 |
| 6. | 75233 | 10.4% | 7.2%(+3.16)#252 | 6.9%(+3.48)#4,132 |
| 7. | 75220 | 9.6% | 7.2%(+2.43)#322 | 6.9%(+2.75)#5,014 |
| 8. | 75228 | 9.4% | 7.2%(+2.22)#344 | 6.9%(+2.55)#5,305 |
| 9. | 75212 | 9.3% | 7.2%(+2.14)#358 | 6.9%(+2.46)#5,438 |
| 10. | 75211 | 9.0% | 7.2%(+1.82)#402 | 6.9%(+2.15)#5,914 |
| 11. | 75223 | 9.0% | 7.2%(+1.78)#407 | 6.9%(+2.11)#5,970 |
| 12. | 75234 | 8.8% | 7.2%(+1.63)#425 | 6.9%(+1.95)#6,221 |
| 13. | 75224 | 8.7% | 7.2%(+1.51)#439 | 6.9%(+1.83)#6,442 |
| 14. | 75203 | 8.4% | 7.2%(+1.22)#483 | 6.9%(+1.55)#6,939 |
| 15. | 75287 | 8.2% | 7.2%(+1.000)#517 | 6.9%(+1.32)#7,401 |
| 16. | 75241 | 8.2% | 7.2%(+0.952)#529 | 6.9%(+1.28)#7,517 |
| 17. | 75229 | 7.8% | 7.2%(+0.643)#579 | 6.9%(+0.968)#8,153 |
| 18. | 75231 | 7.8% | 7.2%(+0.552)#590 | 6.9%(+0.876)#8,346 |
| 19. | 75249 | 7.5% | 7.2%(+0.340)#629 | 6.9%(+0.665)#8,874 |
| 20. | 75243 | 7.4% | 7.2%(+0.229)#638 | 6.9%(+0.554)#9,152 |
| 21. | 75208 | 7.4% | 7.2%(+0.218)#643 | 6.9%(+0.543)#9,191 |
| 22. | 75217 | 7.4% | 7.2%(+0.158)#653 | 6.9%(+0.483)#9,340 |
| 23. | 75219 | 7.3% | 7.2%(+0.129)#659 | 6.9%(+0.453)#9,422 |
| 24. | 75227 | 7.3% | 7.2%(+0.082)#673 | 6.9%(+0.407)#9,570 |
| 25. | 75215 | 7.0% | 7.2%(-0.211)#720 | 6.9%(+0.114)#10,329 |
| 26. | 75232 | 6.7% | 7.2%(-0.476)#774 | 6.9%(-0.152)#11,113 |
| 27. | 75236 | 6.7% | 7.2%(-0.492)#777 | 6.9%(-0.167)#11,164 |
| 28. | 75237 | 6.7% | 7.2%(-0.534)#782 | 6.9%(-0.209)#11,279 |
| 29. | 75238 | 6.7% | 7.2%(-0.538)#783 | 6.9%(-0.213)#11,288 |
| 30. | 75248 | 6.5% | 7.2%(-0.724)#822 | 6.9%(-0.399)#11,903 |
| 31. | 75218 | 6.3% | 7.2%(-0.927)#869 | 6.9%(-0.602)#12,548 |
| 32. | 75244 | 6.2% | 7.2%(-1.04)#889 | 6.9%(-0.718)#12,925 |
| 33. | 75202 | 6.1% | 7.2%(-1.09)#898 | 6.9%(-0.767)#13,082 |
| 34. | 75204 | 5.8% | 7.2%(-1.38)#945 | 6.9%(-1.06)#14,018 |
| 35. | 75201 | 5.7% | 7.2%(-1.46)#953 | 6.9%(-1.14)#14,243 |
| 36. | 75214 | 5.6% | 7.2%(-1.59)#978 | 6.9%(-1.26)#14,624 |
| 37. | 75209 | 5.6% | 7.2%(-1.59)#984 | 6.9%(-1.27)#14,649 |
| 38. | 75216 | 5.5% | 7.2%(-1.67)#1,002 | 6.9%(-1.35)#14,945 |
| 39. | 75252 | 5.1% | 7.2%(-2.13)#1,071 | 6.9%(-1.80)#16,552 |
| 40. | 75235 | 4.9% | 7.2%(-2.31)#1,114 | 6.9%(-1.99)#17,188 |
| 41. | 75206 | 4.6% | 7.2%(-2.64)#1,173 | 6.9%(-2.32)#18,285 |
| 42. | 75207 | 4.3% | 7.2%(-2.86)#1,216 | 6.9%(-2.54)#19,027 |
| 43. | 75230 | 3.9% | 7.2%(-3.30)#1,284 | 6.9%(-2.98)#20,472 |
| 44. | 75205 | 3.3% | 7.2%(-3.90)#1,394 | 6.9%(-3.58)#22,376 |
| 45. | 75226 | 3.0% | 7.2%(-4.16)#1,425 | 6.9%(-3.83)#23,095 |
| 46. | 75251 | 2.6% | 7.2%(-4.61)#1,472 | 6.9%(-4.28)#24,252 |
| 47. | 75210 | 2.1% | 7.2%(-5.07)#1,515 | 6.9%(-4.74)#25,274 |
| 48. | 75225 | 2.0% | 7.2%(-5.24)#1,535 | 6.9%(-4.92)#25,622 |
1
Common Questions
What are the Top 10 Zip Codes with the Highest Percentage of Population Employed in Accommodation & Food Services in Dallas, TX?
Top 10 Zip Codes with the Highest Percentage of Population Employed in Accommodation & Food Services in Dallas, TX are:
What zip code has the Highest Percentage of Population Employed in Accommodation & Food Services in Dallas, TX?
75247 has the Highest Percentage of Population Employed in Accommodation & Food Services in Dallas, TX with 29.8%.
What is the Percentage of Population Employed in Accommodation & Food Services in Dallas, TX?
Percentage of Population Employed in Accommodation & Food Services in Dallas is 7.5%.
What is the Percentage of Population Employed in Accommodation & Food Services in Texas?
Percentage of Population Employed in Accommodation & Food Services in Texas is 7.2%.
What is the Percentage of Population Employed in Accommodation & Food Services in the United States?
Percentage of Population Employed in Accommodation & Food Services in the United States is 6.9%.