Zip Codes with the Highest Percentage of Population Employed in Accommodation & Food Services in Rockwall, TX
RELATED REPORTS & OPTIONS
Accommodation & Food Services
Rockwall
Compare Zip Codes
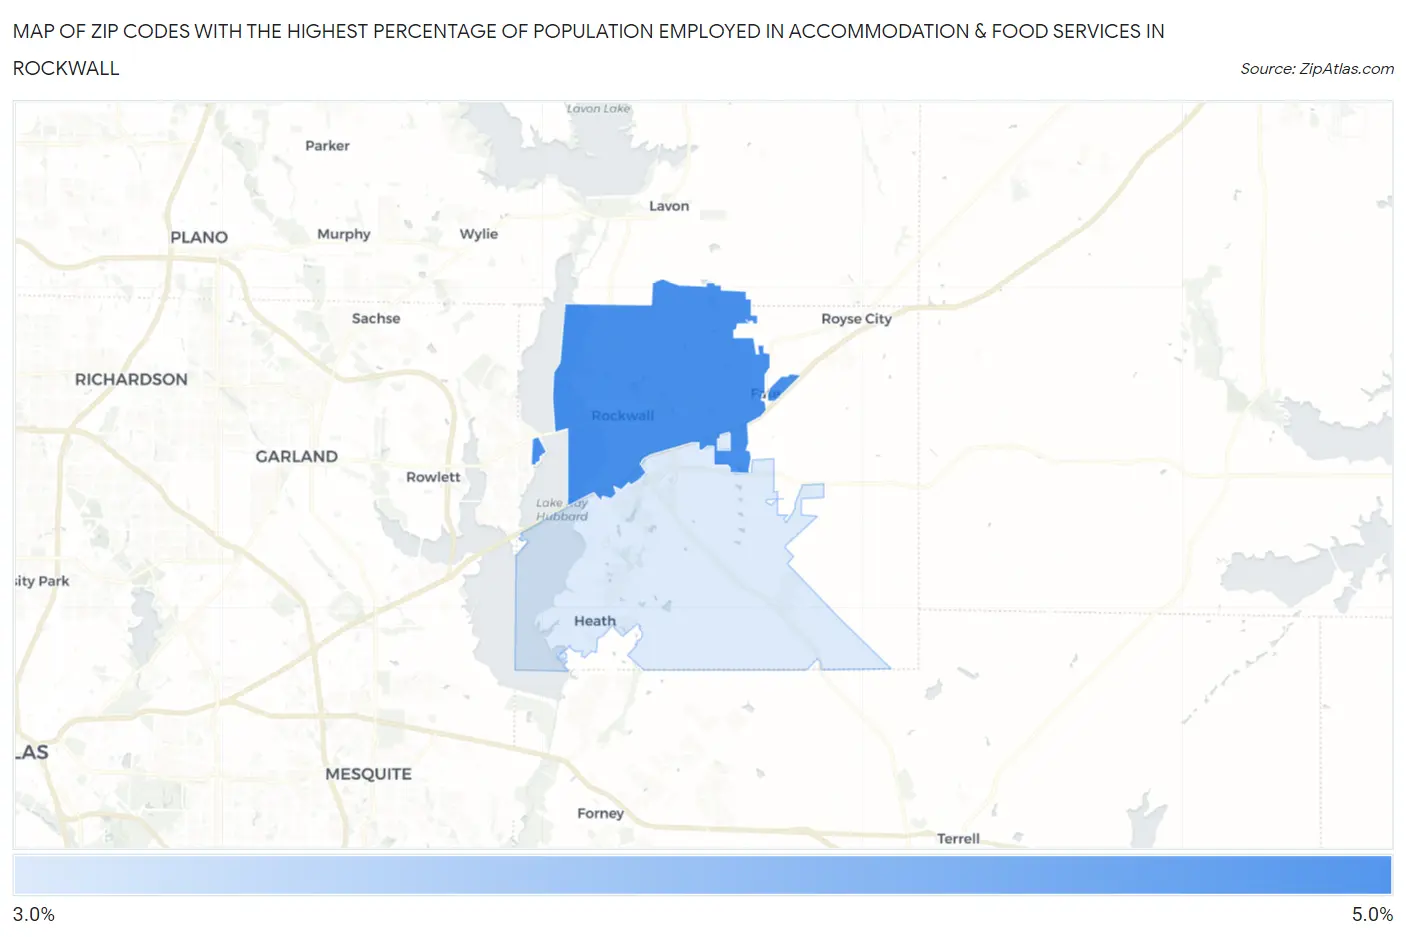
Map of Zip Codes with the Highest Percentage of Population Employed in Accommodation & Food Services in Rockwall
0.0%
5.0%
Zip Codes with the Highest Percentage of Population Employed in Accommodation & Food Services in Rockwall, TX
| Zip Code | % Employed | vs State | vs National | |
| 1. | 75087 | 4.9% | 7.2%(-2.31)#1,113 | 6.9%(-1.98)#17,177 |
| 2. | 75032 | 3.5% | 7.2%(-3.75)#1,367 | 6.9%(-3.42)#21,908 |
1
Common Questions
What are the Top Zip Codes with the Highest Percentage of Population Employed in Accommodation & Food Services in Rockwall, TX?
Top Zip Codes with the Highest Percentage of Population Employed in Accommodation & Food Services in Rockwall, TX are:
What zip code has the Highest Percentage of Population Employed in Accommodation & Food Services in Rockwall, TX?
75087 has the Highest Percentage of Population Employed in Accommodation & Food Services in Rockwall, TX with 4.9%.
What is the Percentage of Population Employed in Accommodation & Food Services in Rockwall, TX?
Percentage of Population Employed in Accommodation & Food Services in Rockwall is 3.4%.
What is the Percentage of Population Employed in Accommodation & Food Services in Texas?
Percentage of Population Employed in Accommodation & Food Services in Texas is 7.2%.
What is the Percentage of Population Employed in Accommodation & Food Services in the United States?
Percentage of Population Employed in Accommodation & Food Services in the United States is 6.9%.