Zip Codes with the Highest Percentage of Population Employed in Accommodation & Food Services in Denison, TX
RELATED REPORTS & OPTIONS
Accommodation & Food Services
Denison
Compare Zip Codes
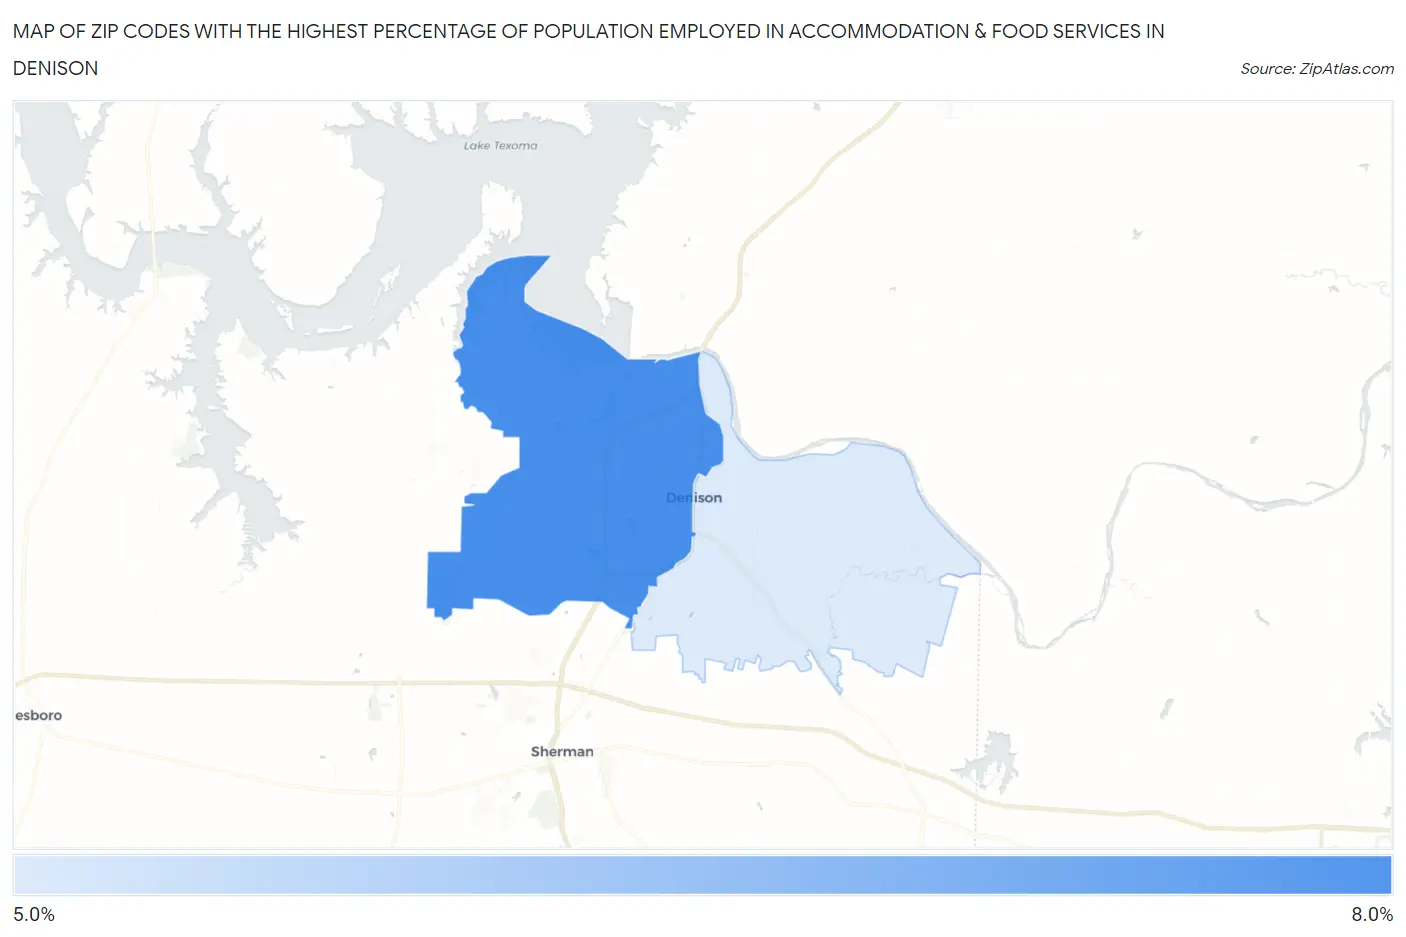
Map of Zip Codes with the Highest Percentage of Population Employed in Accommodation & Food Services in Denison
0.0%
8.0%
Zip Codes with the Highest Percentage of Population Employed in Accommodation & Food Services in Denison, TX
| Zip Code | % Employed | vs State | vs National | |
| 1. | 75020 | 7.9% | 7.2%(+0.707)#567 | 6.9%(+1.03)#8,000 |
| 2. | 75021 | 5.1% | 7.2%(-2.11)#1,067 | 6.9%(-1.78)#16,475 |
1
Common Questions
What are the Top Zip Codes with the Highest Percentage of Population Employed in Accommodation & Food Services in Denison, TX?
Top Zip Codes with the Highest Percentage of Population Employed in Accommodation & Food Services in Denison, TX are:
What zip code has the Highest Percentage of Population Employed in Accommodation & Food Services in Denison, TX?
75020 has the Highest Percentage of Population Employed in Accommodation & Food Services in Denison, TX with 7.9%.
What is the Percentage of Population Employed in Accommodation & Food Services in Denison, TX?
Percentage of Population Employed in Accommodation & Food Services in Denison is 8.1%.
What is the Percentage of Population Employed in Accommodation & Food Services in Texas?
Percentage of Population Employed in Accommodation & Food Services in Texas is 7.2%.
What is the Percentage of Population Employed in Accommodation & Food Services in the United States?
Percentage of Population Employed in Accommodation & Food Services in the United States is 6.9%.