Zip Codes with the Highest Percentage of Population Employed in Accommodation & Food Services in Brownsville, TX
RELATED REPORTS & OPTIONS
Accommodation & Food Services
Brownsville
Compare Zip Codes
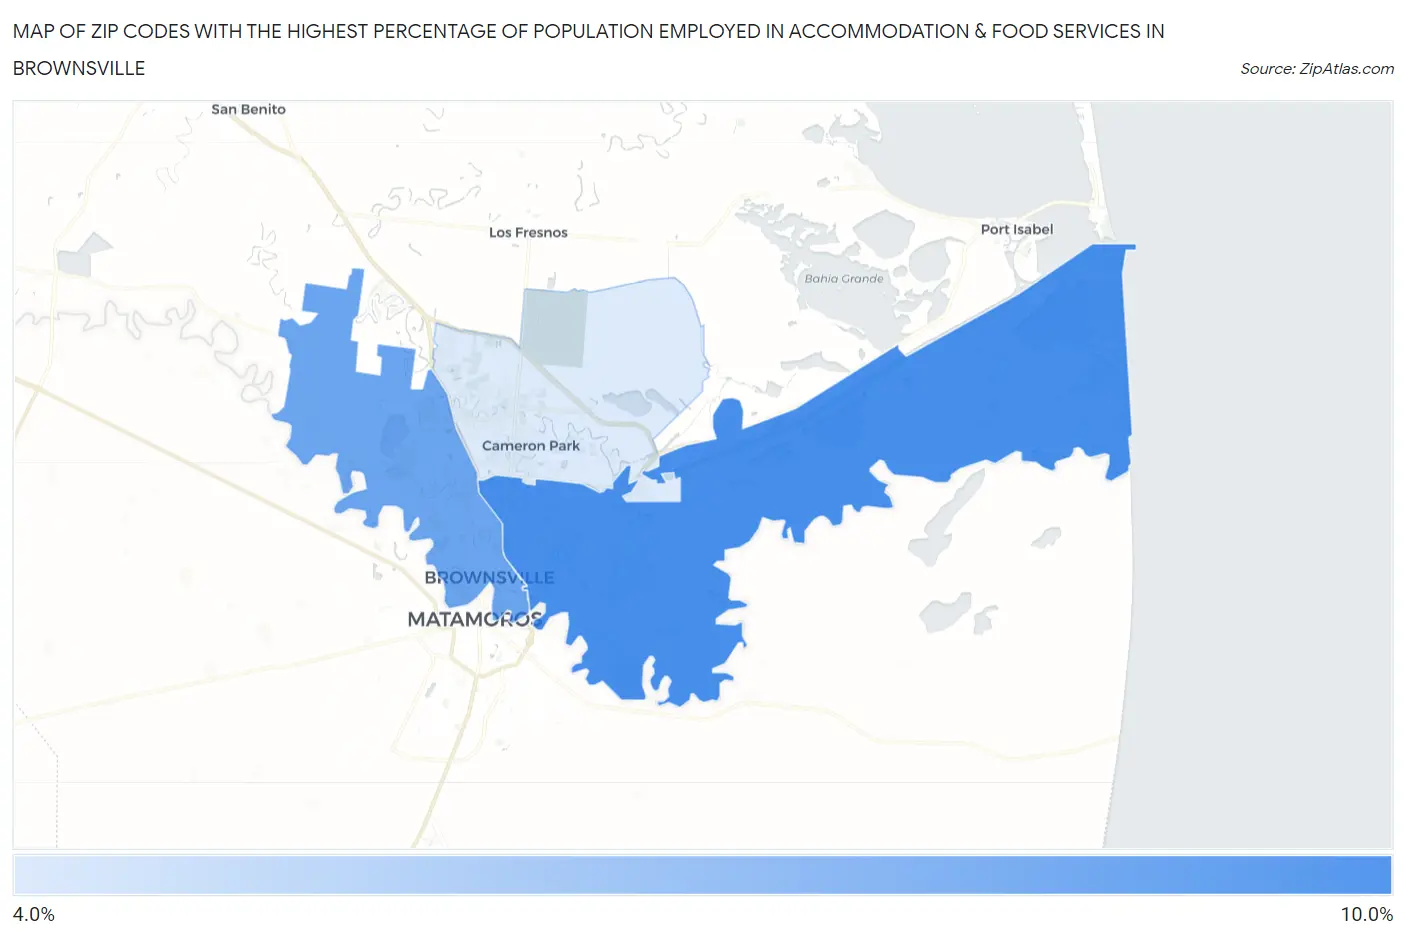
Map of Zip Codes with the Highest Percentage of Population Employed in Accommodation & Food Services in Brownsville
0.0%
10.0%
Zip Codes with the Highest Percentage of Population Employed in Accommodation & Food Services in Brownsville, TX
| Zip Code | % Employed | vs State | vs National | |
| 1. | 78521 | 8.7% | 7.2%(+1.47)#444 | 6.9%(+1.80)#6,506 |
| 2. | 78520 | 7.7% | 7.2%(+0.468)#603 | 6.9%(+0.793)#8,569 |
| 3. | 78526 | 4.7% | 7.2%(-2.47)#1,148 | 6.9%(-2.15)#17,707 |
1
Common Questions
What are the Top Zip Codes with the Highest Percentage of Population Employed in Accommodation & Food Services in Brownsville, TX?
Top Zip Codes with the Highest Percentage of Population Employed in Accommodation & Food Services in Brownsville, TX are:
What zip code has the Highest Percentage of Population Employed in Accommodation & Food Services in Brownsville, TX?
78521 has the Highest Percentage of Population Employed in Accommodation & Food Services in Brownsville, TX with 8.7%.
What is the Percentage of Population Employed in Accommodation & Food Services in Brownsville, TX?
Percentage of Population Employed in Accommodation & Food Services in Brownsville is 7.2%.
What is the Percentage of Population Employed in Accommodation & Food Services in Texas?
Percentage of Population Employed in Accommodation & Food Services in Texas is 7.2%.
What is the Percentage of Population Employed in Accommodation & Food Services in the United States?
Percentage of Population Employed in Accommodation & Food Services in the United States is 6.9%.