South Point, TX
South Point Map
South Point Overview
670
TOTAL POPULATION
373
MALE POPULATION
297
FEMALE POPULATION
125.59
MALES / 100 FEMALES
79.62
FEMALES / 100 MALES
52.7
MEDIAN AGE
2.7
AVG FAMILY SIZE
2.5
AVG HOUSEHOLD SIZE
$23,898
PER CAPITA INCOME
$35,357
AVG FAMILY INCOME
$40,703
AVG HOUSEHOLD INCOME
57.9%
WAGE / INCOME GAP [ % ]
42.1¢/ $1
WAGE / INCOME GAP [ $ ]
0.43
INEQUALITY / GINI INDEX
317
LABOR FORCE [ PEOPLE ]
51.0%
PERCENT IN LABOR FORCE
2.8%
UNEMPLOYMENT RATE
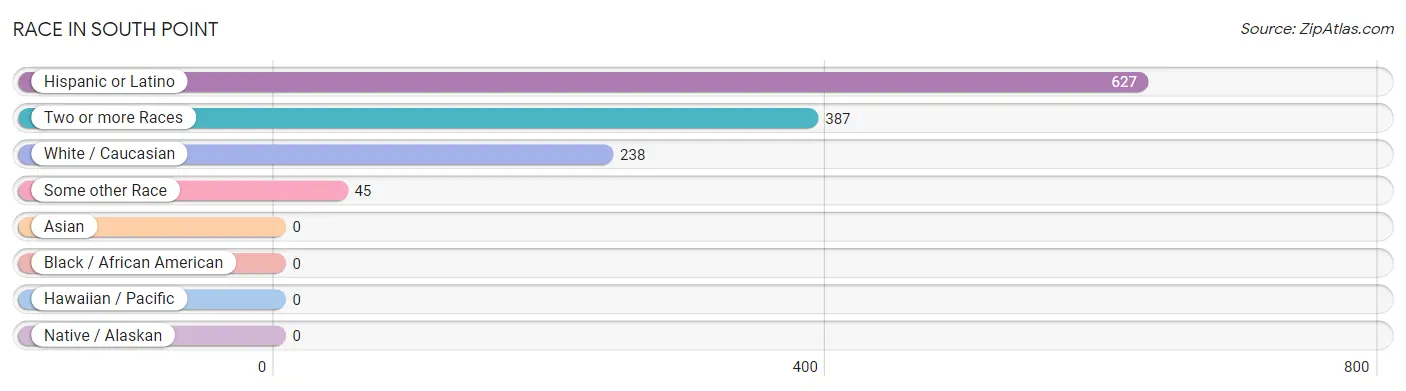
Race in South Point
The most populous races in South Point are Hispanic or Latino (627 | 93.6%), Two or more Races (387 | 57.8%), and White / Caucasian (238 | 35.5%).
| Race | # Population | % Population |
| Asian | 0 | 0.0% |
| Black / African American | 0 | 0.0% |
| Hawaiian / Pacific | 0 | 0.0% |
| Hispanic or Latino | 627 | 93.6% |
| Native / Alaskan | 0 | 0.0% |
| White / Caucasian | 238 | 35.5% |
| Two or more Races | 387 | 57.8% |
| Some other Race | 45 | 6.7% |
| Total | 670 | 100.0% |
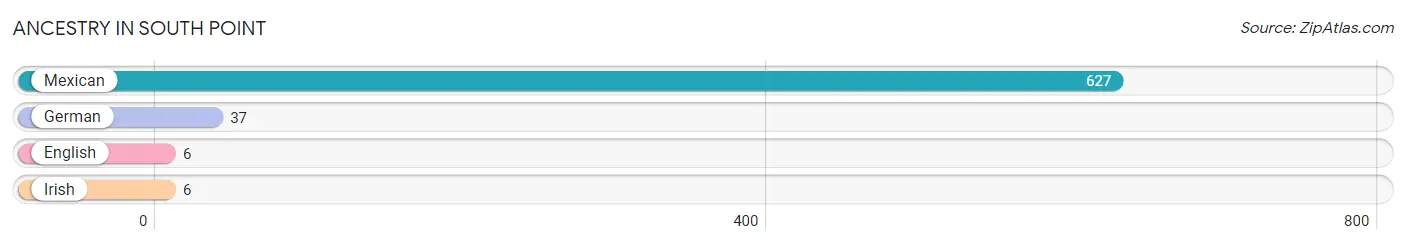
Ancestry in South Point
The most populous ancestries reported in South Point are Mexican (627 | 93.6%), German (37 | 5.5%), English (6 | 0.9%), and Irish (6 | 0.9%), together accounting for 100.9% of all South Point residents.
| Ancestry | # Population | % Population |
| English | 6 | 0.9% |
| German | 37 | 5.5% |
| Irish | 6 | 0.9% |
| Mexican | 627 | 93.6% | View All 4 Rows |
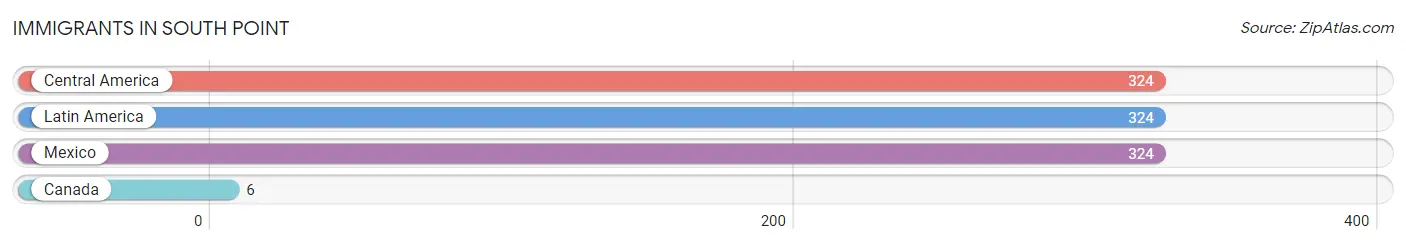
Immigrants in South Point
The most numerous immigrant groups reported in South Point came from Central America (324 | 48.4%), Latin America (324 | 48.4%), Mexico (324 | 48.4%), and Canada (6 | 0.9%), together accounting for 146.0% of all South Point residents.
| Immigration Origin | # Population | % Population |
| Canada | 6 | 0.9% |
| Central America | 324 | 48.4% |
| Latin America | 324 | 48.4% |
| Mexico | 324 | 48.4% | View All 4 Rows |
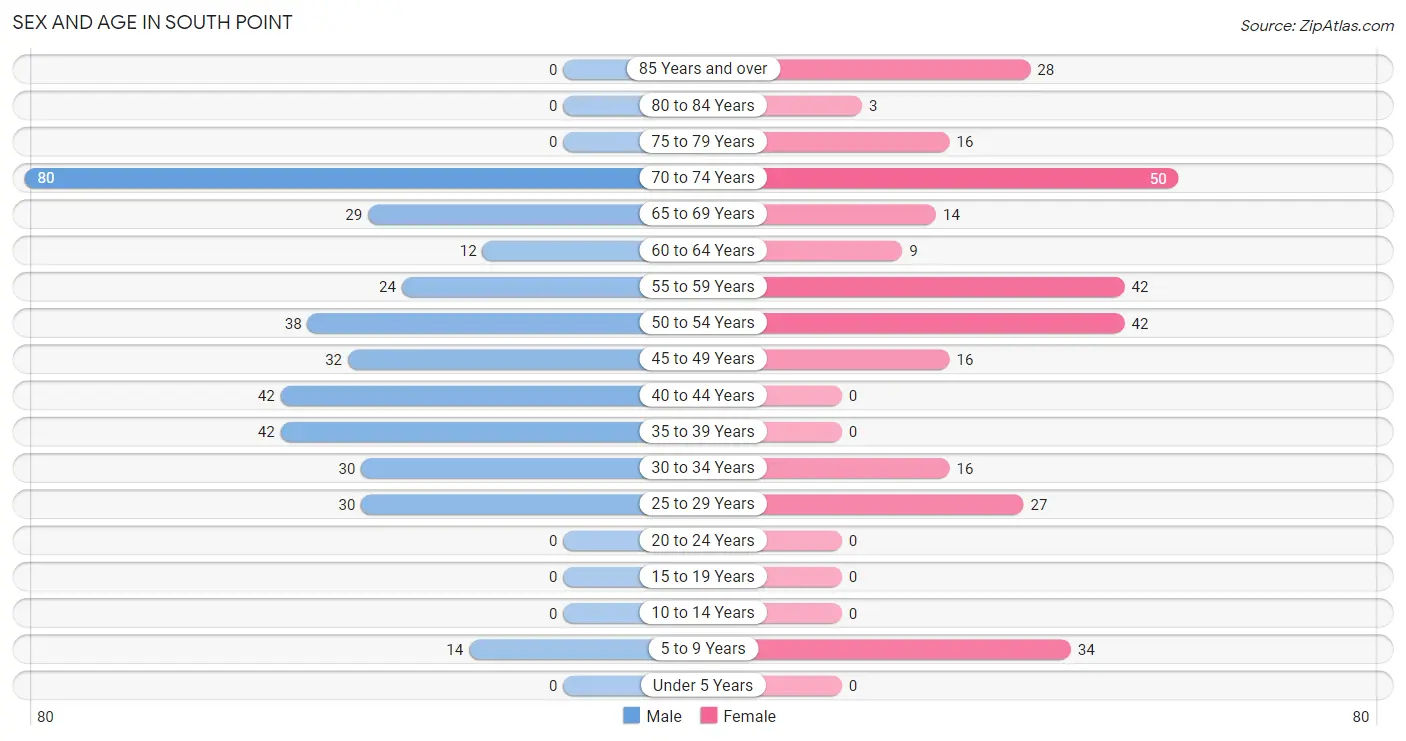
Sex and Age in South Point
Sex and Age in South Point
The most populous age groups in South Point are 70 to 74 Years (80 | 21.4%) for men and 70 to 74 Years (50 | 16.8%) for women.
| Age Bracket | Male | Female |
| Under 5 Years | 0 (0.0%) | 0 (0.0%) |
| 5 to 9 Years | 14 (3.7%) | 34 (11.5%) |
| 10 to 14 Years | 0 (0.0%) | 0 (0.0%) |
| 15 to 19 Years | 0 (0.0%) | 0 (0.0%) |
| 20 to 24 Years | 0 (0.0%) | 0 (0.0%) |
| 25 to 29 Years | 30 (8.0%) | 27 (9.1%) |
| 30 to 34 Years | 30 (8.0%) | 16 (5.4%) |
| 35 to 39 Years | 42 (11.3%) | 0 (0.0%) |
| 40 to 44 Years | 42 (11.3%) | 0 (0.0%) |
| 45 to 49 Years | 32 (8.6%) | 16 (5.4%) |
| 50 to 54 Years | 38 (10.2%) | 42 (14.1%) |
| 55 to 59 Years | 24 (6.4%) | 42 (14.1%) |
| 60 to 64 Years | 12 (3.2%) | 9 (3.0%) |
| 65 to 69 Years | 29 (7.8%) | 14 (4.7%) |
| 70 to 74 Years | 80 (21.4%) | 50 (16.8%) |
| 75 to 79 Years | 0 (0.0%) | 16 (5.4%) |
| 80 to 84 Years | 0 (0.0%) | 3 (1.0%) |
| 85 Years and over | 0 (0.0%) | 28 (9.4%) |
| Total | 373 (100.0%) | 297 (100.0%) |
Families and Households in South Point
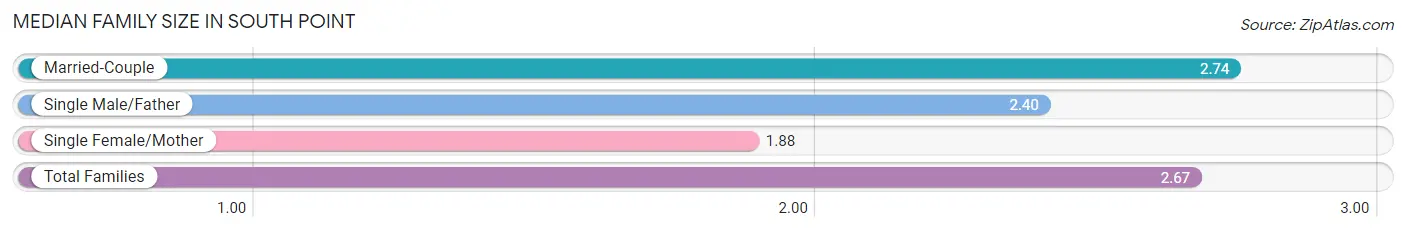
Median Family Size in South Point
The median family size in South Point is 2.67 persons per family, with married-couple families (197 | 90.4%) accounting for the largest median family size of 2.74 persons per family. On the other hand, single female/mother families (16 | 7.3%) represent the smallest median family size with 1.88 persons per family.
| Family Type | # Families | Family Size |
| Married-Couple | 197 (90.4%) | 2.74 |
| Single Male/Father | 5 (2.3%) | 2.40 |
| Single Female/Mother | 16 (7.3%) | 1.88 |
| Total Families | 218 (100.0%) | 2.67 |
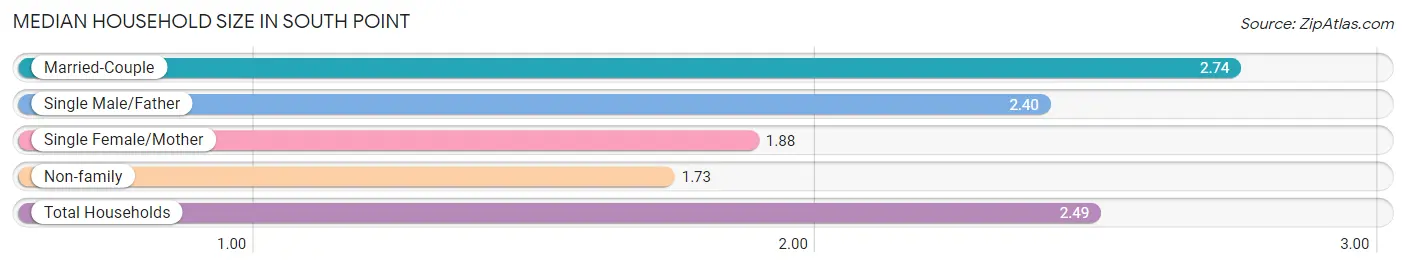
Median Household Size in South Point
The median household size in South Point is 2.49 persons per household, with married-couple households (197 | 73.2%) accounting for the largest median household size of 2.74 persons per household. non-family households (51 | 19.0%) represent the smallest median household size with 1.73 persons per household.
| Household Type | # Households | Household Size |
| Married-Couple | 197 (73.2%) | 2.74 |
| Single Male/Father | 5 (1.9%) | 2.40 |
| Single Female/Mother | 16 (5.9%) | 1.88 |
| Non-family | 51 (19.0%) | 1.73 |
| Total Households | 269 (100.0%) | 2.49 |
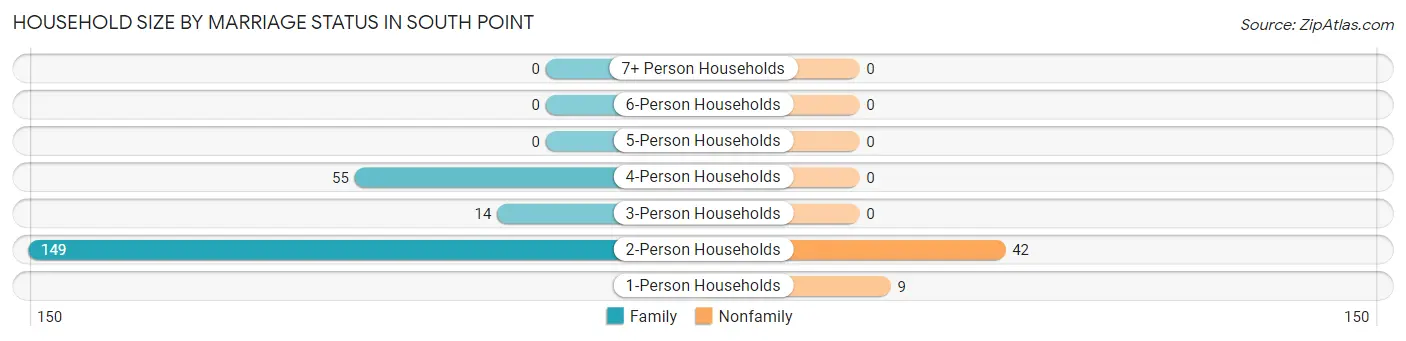
Household Size by Marriage Status in South Point
Out of a total of 269 households in South Point, 218 (81.0%) are family households, while 51 (19.0%) are nonfamily households. The most numerous type of family households are 2-person households, comprising 149, and the most common type of nonfamily households are 2-person households, comprising 42.
| Household Size | Family Households | Nonfamily Households |
| 1-Person Households | - | 9 (3.4%) |
| 2-Person Households | 149 (55.4%) | 42 (15.6%) |
| 3-Person Households | 14 (5.2%) | 0 (0.0%) |
| 4-Person Households | 55 (20.4%) | 0 (0.0%) |
| 5-Person Households | 0 (0.0%) | 0 (0.0%) |
| 6-Person Households | 0 (0.0%) | 0 (0.0%) |
| 7+ Person Households | 0 (0.0%) | 0 (0.0%) |
| Total | 218 (81.0%) | 51 (19.0%) |
Female Fertility in South Point
Fertility by Age in South Point
| Age Bracket | Women with Births | Births / 1,000 Women |
| 15 to 19 years | 0 (0.0%) | 0.0 |
| 20 to 34 years | 0 (0.0%) | 0.0 |
| 35 to 50 years | 0 (0.0%) | 0.0 |
| Total | 0 (0.0%) | 0.0 |
Fertility by Age by Marriage Status in South Point
| Age Bracket | Married | Unmarried |
| 15 to 19 years | 0 (0.0%) | 0 (0.0%) |
| 20 to 34 years | 0 (0.0%) | 0 (0.0%) |
| 35 to 50 years | 0 (0.0%) | 0 (0.0%) |
| Total | 0 (0.0%) | 0 (0.0%) |
Fertility by Education in South Point
| Educational Attainment | Women with Births | Births / 1,000 Women |
| Less than High School | 0 (0.0%) | 0.0 |
| High School Diploma | 0 (0.0%) | 0.0 |
| College or Associate's Degree | 0 (0.0%) | 0.0 |
| Bachelor's Degree | 0 (0.0%) | 0.0 |
| Graduate Degree | 0 (0.0%) | 0.0 |
| Total | 0 (0.0%) | 0.0 |
Fertility by Education by Marriage Status in South Point
| Educational Attainment | Married | Unmarried |
| Less than High School | 0 (0.0%) | 0 (0.0%) |
| High School Diploma | 0 (0.0%) | 0 (0.0%) |
| College or Associate's Degree | 0 (0.0%) | 0 (0.0%) |
| Bachelor's Degree | 0 (0.0%) | 0 (0.0%) |
| Graduate Degree | 0 (0.0%) | 0 (0.0%) |
| Total | 0 (0.0%) | 0 (0.0%) |
Income in South Point
Income Overview in South Point
Per Capita Income in South Point is $23,898, while median incomes of families and households are $35,357 and $40,703 respectively.
| Characteristic | Number | Measure |
| Per Capita Income | 670 | $23,898 |
| Median Family Income | 218 | $35,357 |
| Mean Family Income | 218 | $42,833 |
| Median Household Income | 269 | $40,703 |
| Mean Household Income | 269 | $59,128 |
| Income Deficit | 218 | $0 |
| Wage / Income Gap (%) | 670 | 57.89% |
| Wage / Income Gap ($) | 670 | 42.11¢ per $1 |
| Gini / Inequality Index | 670 | 0.43 |
Earnings by Sex in South Point
Average Earnings in South Point are $37,333, $39,884 for men and $16,795 for women, a difference of 57.9%.
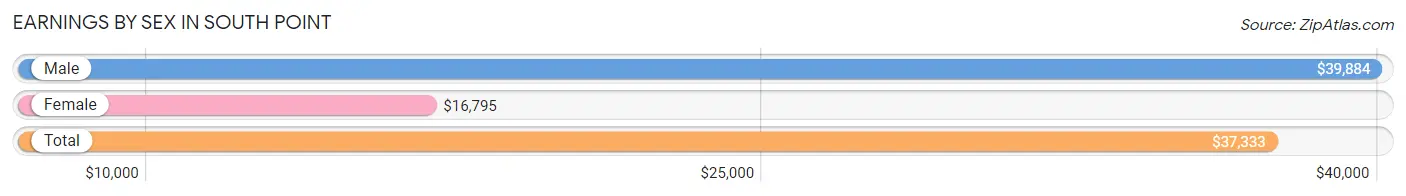
| Sex | Number | Average Earnings |
| Male | 206 (64.8%) | $39,884 |
| Female | 112 (35.2%) | $16,795 |
| Total | 318 (100.0%) | $37,333 |
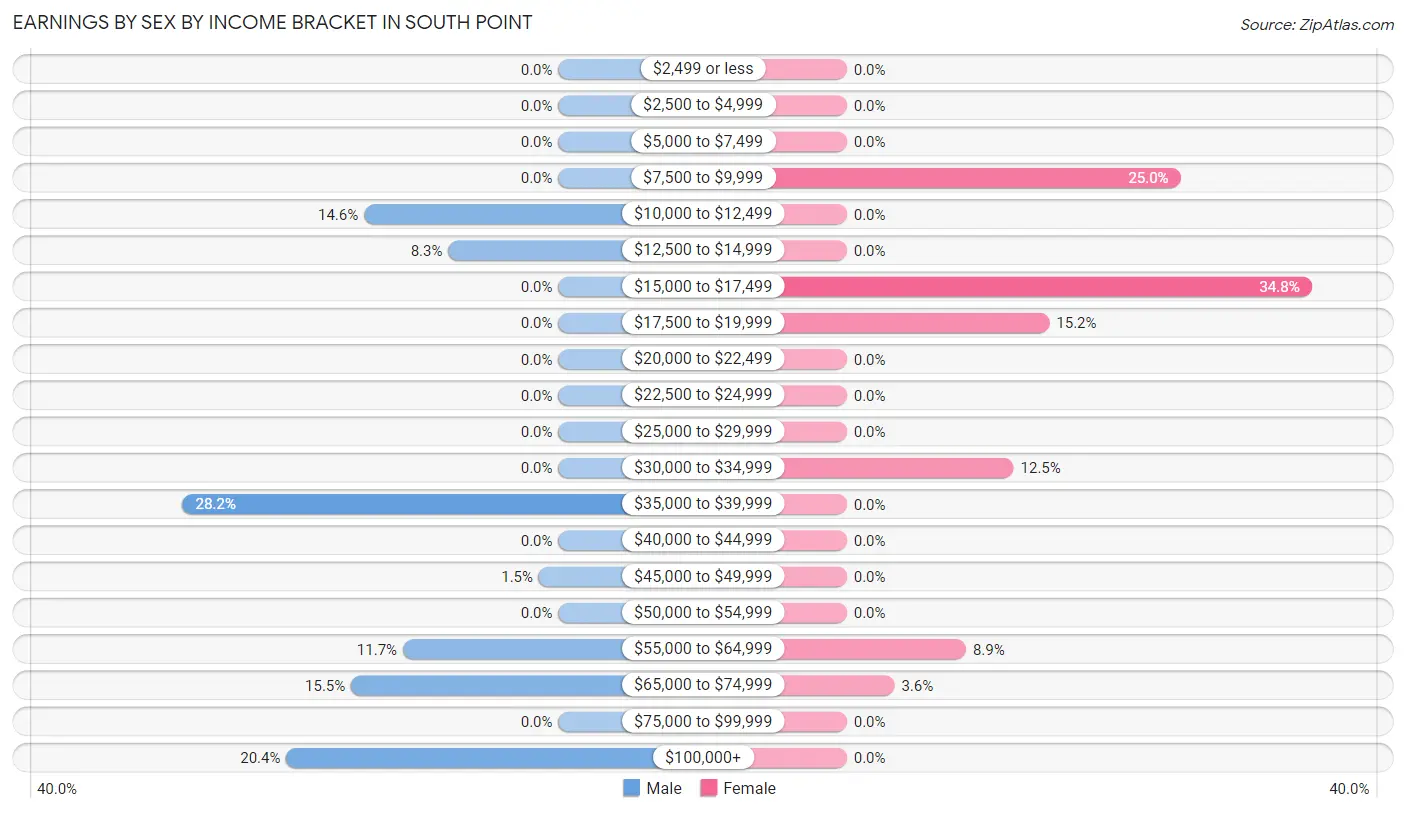
Earnings by Sex by Income Bracket in South Point
The most common earnings brackets in South Point are $35,000 to $39,999 for men (58 | 28.2%) and $15,000 to $17,499 for women (39 | 34.8%).
| Income | Male | Female |
| $2,499 or less | 0 (0.0%) | 0 (0.0%) |
| $2,500 to $4,999 | 0 (0.0%) | 0 (0.0%) |
| $5,000 to $7,499 | 0 (0.0%) | 0 (0.0%) |
| $7,500 to $9,999 | 0 (0.0%) | 28 (25.0%) |
| $10,000 to $12,499 | 30 (14.6%) | 0 (0.0%) |
| $12,500 to $14,999 | 17 (8.3%) | 0 (0.0%) |
| $15,000 to $17,499 | 0 (0.0%) | 39 (34.8%) |
| $17,500 to $19,999 | 0 (0.0%) | 17 (15.2%) |
| $20,000 to $22,499 | 0 (0.0%) | 0 (0.0%) |
| $22,500 to $24,999 | 0 (0.0%) | 0 (0.0%) |
| $25,000 to $29,999 | 0 (0.0%) | 0 (0.0%) |
| $30,000 to $34,999 | 0 (0.0%) | 14 (12.5%) |
| $35,000 to $39,999 | 58 (28.2%) | 0 (0.0%) |
| $40,000 to $44,999 | 0 (0.0%) | 0 (0.0%) |
| $45,000 to $49,999 | 3 (1.5%) | 0 (0.0%) |
| $50,000 to $54,999 | 0 (0.0%) | 0 (0.0%) |
| $55,000 to $64,999 | 24 (11.7%) | 10 (8.9%) |
| $65,000 to $74,999 | 32 (15.5%) | 4 (3.6%) |
| $75,000 to $99,999 | 0 (0.0%) | 0 (0.0%) |
| $100,000+ | 42 (20.4%) | 0 (0.0%) |
| Total | 206 (100.0%) | 112 (100.0%) |
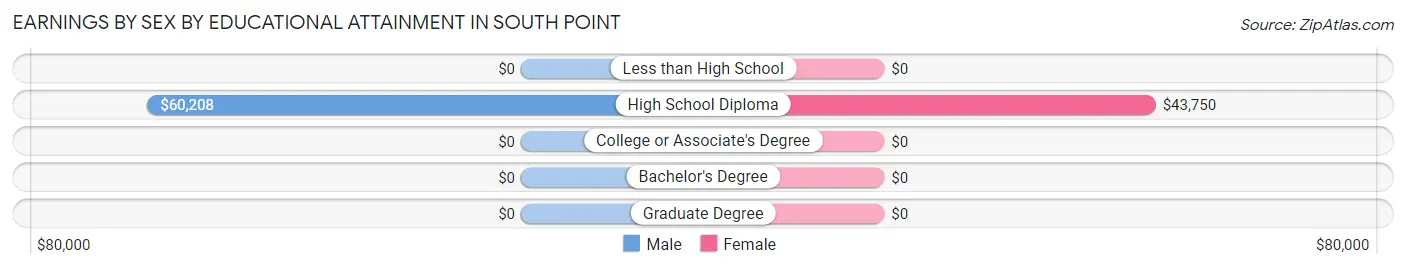
Earnings by Sex by Educational Attainment in South Point
Average earnings in South Point are $39,884 for men and $16,795 for women, a difference of 57.9%. Men with an educational attainment of high school diploma enjoy the highest average annual earnings of $60,208, while those with high school diploma education earn the least with $60,208. Women with an educational attainment of high school diploma earn the most with the average annual earnings of $43,750, while those with high school diploma education have the smallest earnings of $43,750.
| Educational Attainment | Male Income | Female Income |
| Less than High School | - | - |
| High School Diploma | $60,208 | $43,750 |
| College or Associate's Degree | - | - |
| Bachelor's Degree | - | - |
| Graduate Degree | - | - |
| Total | $39,884 | $16,795 |
Family Income in South Point
Family Income Brackets in South Point
According to the South Point family income data, there are 51 families falling into the $75,000 to $99,999 income range, which is the most common income bracket and makes up 23.4% of all families.

| Income Bracket | # Families | % Families |
| Less than $10,000 | 0 | 0.0% |
| $10,000 to $14,999 | 50 | 22.9% |
| $15,000 to $24,999 | 41 | 18.8% |
| $25,000 to $34,999 | 16 | 7.3% |
| $35,000 to $49,999 | 30 | 13.8% |
| $50,000 to $74,999 | 25 | 11.5% |
| $75,000 to $99,999 | 51 | 23.4% |
| $100,000 to $149,999 | 5 | 2.3% |
| $150,000 to $199,999 | 0 | 0.0% |
| $200,000+ | 0 | 0.0% |
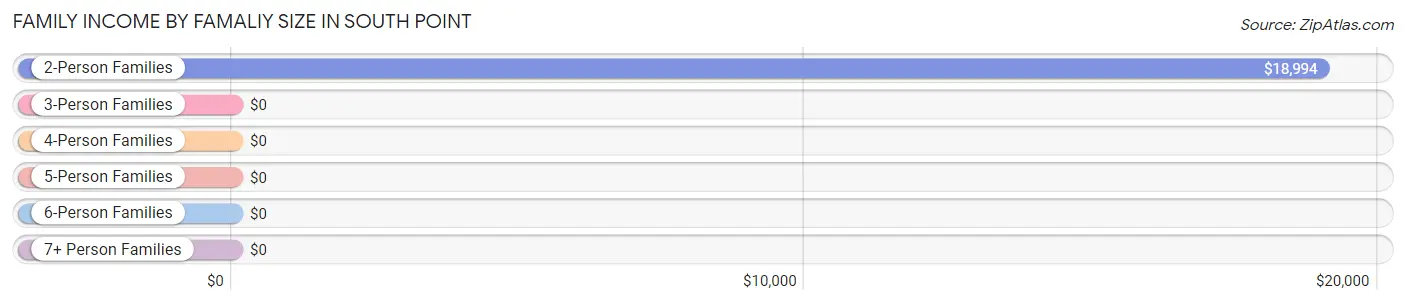
Family Income by Famaliy Size in South Point
2-person families (149 | 68.3%) account for the highest median family income in South Point with $18,994 per family, while 2-person families (149 | 68.3%) have the highest median income of $9,497 per family member.
| Income Bracket | # Families | Median Income |
| 2-Person Families | 149 (68.3%) | $18,994 |
| 3-Person Families | 14 (6.4%) | $0 |
| 4-Person Families | 55 (25.2%) | $0 |
| 5-Person Families | 0 (0.0%) | $0 |
| 6-Person Families | 0 (0.0%) | $0 |
| 7+ Person Families | 0 (0.0%) | $0 |
| Total | 218 (100.0%) | $35,357 |
Family Income by Number of Earners in South Point
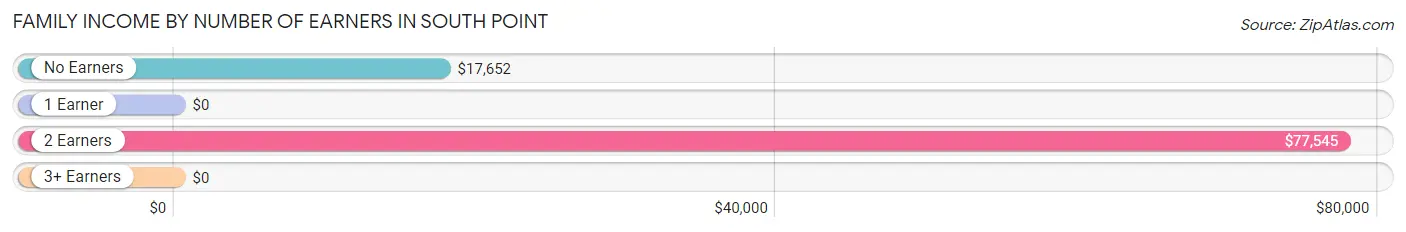
| Number of Earners | # Families | Median Income |
| No Earners | 105 (48.2%) | $17,652 |
| 1 Earner | 25 (11.5%) | $0 |
| 2 Earners | 65 (29.8%) | $77,545 |
| 3+ Earners | 23 (10.5%) | $0 |
| Total | 218 (100.0%) | $35,357 |
Household Income in South Point
Household Income Brackets in South Point
With 51 households falling in the category, the $75,000 to $99,999 income range is the most frequent in South Point, accounting for 19.0% of all households.
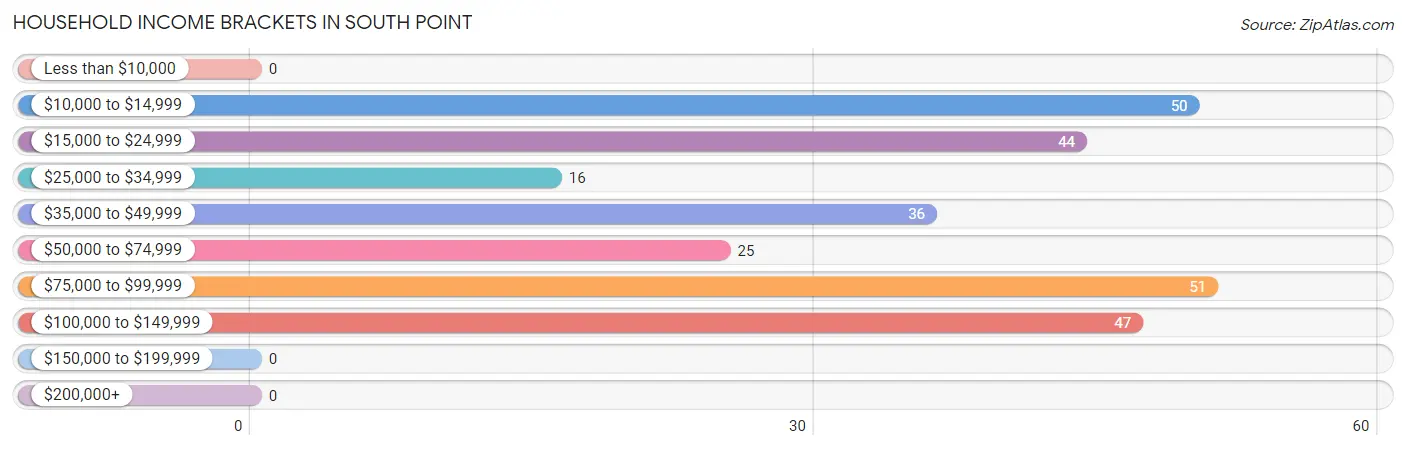
| Income Bracket | # Households | % Households |
| Less than $10,000 | 0 | 0.0% |
| $10,000 to $14,999 | 50 | 18.6% |
| $15,000 to $24,999 | 44 | 16.4% |
| $25,000 to $34,999 | 16 | 5.9% |
| $35,000 to $49,999 | 36 | 13.4% |
| $50,000 to $74,999 | 25 | 9.3% |
| $75,000 to $99,999 | 51 | 19.0% |
| $100,000 to $149,999 | 47 | 17.5% |
| $150,000 to $199,999 | 0 | 0.0% |
| $200,000+ | 0 | 0.0% |
Household Income by Householder Age in South Point
The median household income in South Point is $40,703, with the highest median household income of $148,125 found in the 25 to 44 years age bracket for the primary householder. A total of 63 households (23.4%) fall into this category.
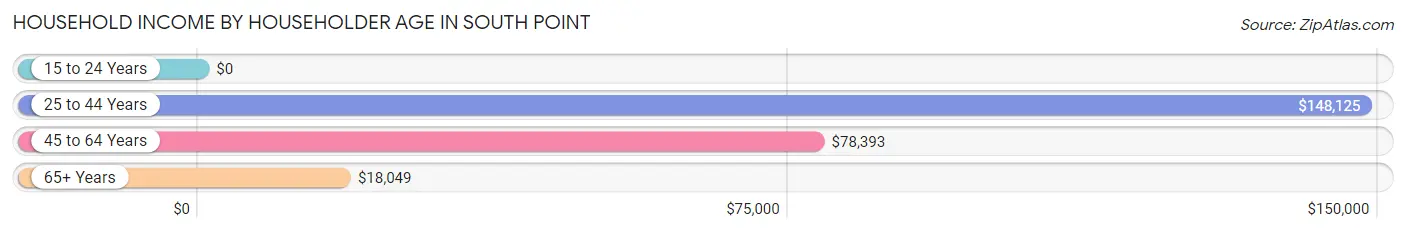
| Income Bracket | # Households | Median Income |
| 15 to 24 Years | 0 (0.0%) | $0 |
| 25 to 44 Years | 63 (23.4%) | $148,125 |
| 45 to 64 Years | 82 (30.5%) | $78,393 |
| 65+ Years | 124 (46.1%) | $18,049 |
| Total | 269 (100.0%) | $40,703 |
Poverty in South Point
Income Below Poverty by Sex and Age in South Point
With 14.5% poverty level for males and 16.8% for females among the residents of South Point, 65 to 74 year old males and 65 to 74 year old females are the most vulnerable to poverty, with 54 males (49.5%) and 50 females (78.1%) in their respective age groups living below the poverty level.
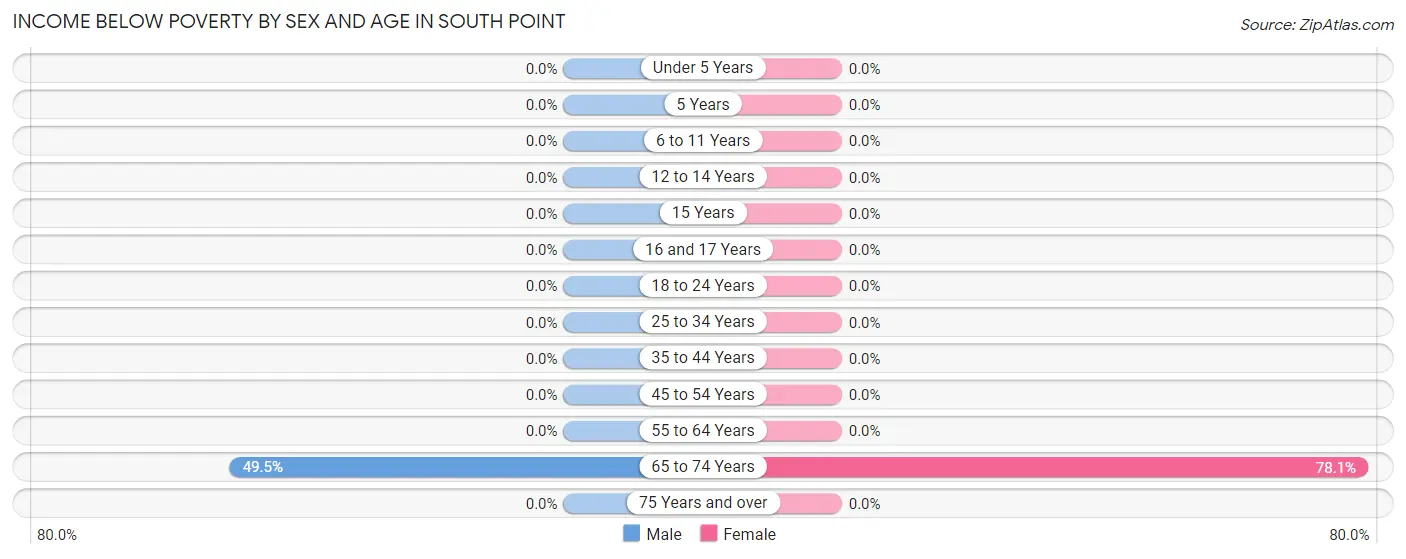
| Age Bracket | Male | Female |
| Under 5 Years | 0 (0.0%) | 0 (0.0%) |
| 5 Years | 0 (0.0%) | 0 (0.0%) |
| 6 to 11 Years | 0 (0.0%) | 0 (0.0%) |
| 12 to 14 Years | 0 (0.0%) | 0 (0.0%) |
| 15 Years | 0 (0.0%) | 0 (0.0%) |
| 16 and 17 Years | 0 (0.0%) | 0 (0.0%) |
| 18 to 24 Years | 0 (0.0%) | 0 (0.0%) |
| 25 to 34 Years | 0 (0.0%) | 0 (0.0%) |
| 35 to 44 Years | 0 (0.0%) | 0 (0.0%) |
| 45 to 54 Years | 0 (0.0%) | 0 (0.0%) |
| 55 to 64 Years | 0 (0.0%) | 0 (0.0%) |
| 65 to 74 Years | 54 (49.5%) | 50 (78.1%) |
| 75 Years and over | 0 (0.0%) | 0 (0.0%) |
| Total | 54 (14.5%) | 50 (16.8%) |
Income Above Poverty by Sex and Age in South Point
According to the poverty statistics in South Point, males aged 5 years and females aged 5 years are the age groups that are most secure financially, with 100.0% of males and 100.0% of females in these age groups living above the poverty line.
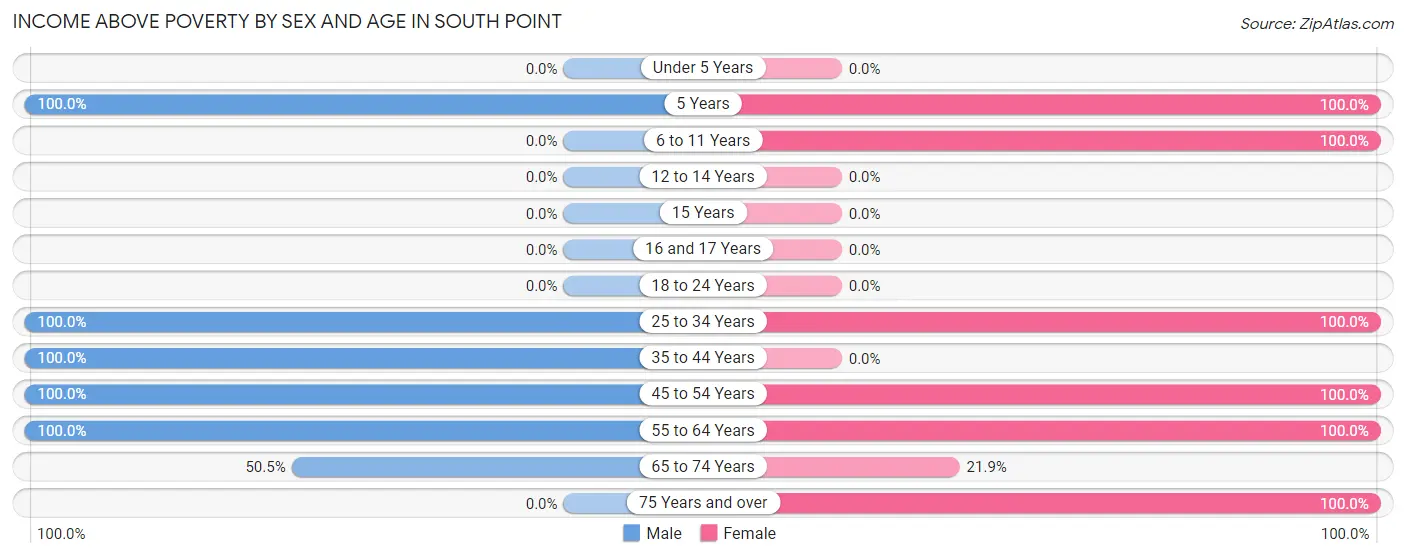
| Age Bracket | Male | Female |
| Under 5 Years | 0 (0.0%) | 0 (0.0%) |
| 5 Years | 14 (100.0%) | 18 (100.0%) |
| 6 to 11 Years | 0 (0.0%) | 16 (100.0%) |
| 12 to 14 Years | 0 (0.0%) | 0 (0.0%) |
| 15 Years | 0 (0.0%) | 0 (0.0%) |
| 16 and 17 Years | 0 (0.0%) | 0 (0.0%) |
| 18 to 24 Years | 0 (0.0%) | 0 (0.0%) |
| 25 to 34 Years | 60 (100.0%) | 43 (100.0%) |
| 35 to 44 Years | 84 (100.0%) | 0 (0.0%) |
| 45 to 54 Years | 70 (100.0%) | 58 (100.0%) |
| 55 to 64 Years | 36 (100.0%) | 51 (100.0%) |
| 65 to 74 Years | 55 (50.5%) | 14 (21.9%) |
| 75 Years and over | 0 (0.0%) | 47 (100.0%) |
| Total | 319 (85.5%) | 247 (83.2%) |
Income Below Poverty Among Married-Couple Families in South Point
The poverty statistics for married-couple families in South Point show that 25.4% or 50 of the total 197 families live below the poverty line. Families with no children have the highest poverty rate of 30.3%, comprising of 50 families. On the other hand, families with 1 or 2 children have the lowest poverty rate of 0.0%, which includes 0 families.
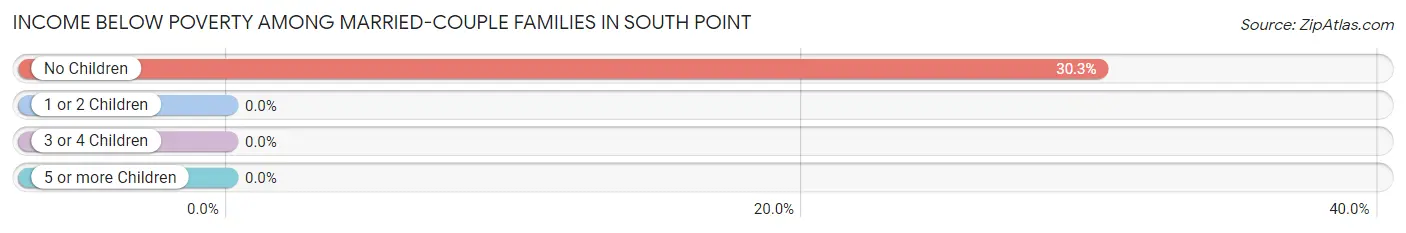
| Children | Above Poverty | Below Poverty |
| No Children | 115 (69.7%) | 50 (30.3%) |
| 1 or 2 Children | 32 (100.0%) | 0 (0.0%) |
| 3 or 4 Children | 0 (0.0%) | 0 (0.0%) |
| 5 or more Children | 0 (0.0%) | 0 (0.0%) |
| Total | 147 (74.6%) | 50 (25.4%) |
Income Below Poverty Among Single-Parent Households in South Point
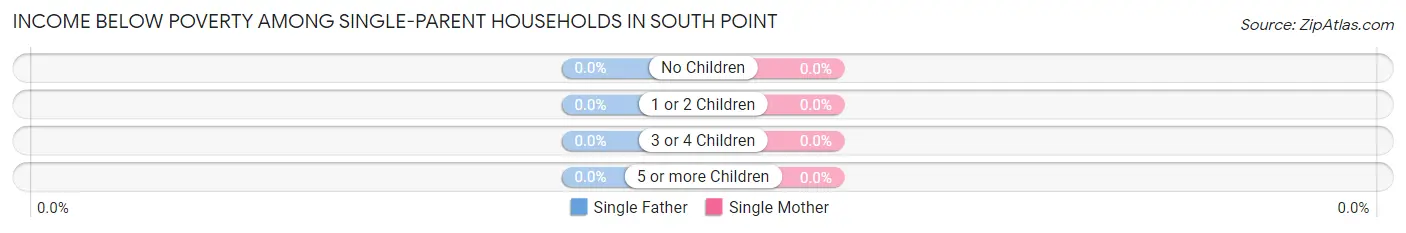
| Children | Single Father | Single Mother |
| No Children | 0 (0.0%) | 0 (0.0%) |
| 1 or 2 Children | 0 (0.0%) | 0 (0.0%) |
| 3 or 4 Children | 0 (0.0%) | 0 (0.0%) |
| 5 or more Children | 0 (0.0%) | 0 (0.0%) |
| Total | 0 (0.0%) | 0 (0.0%) |
Income Below Poverty Among Married-Couple vs Single-Parent Households in South Point
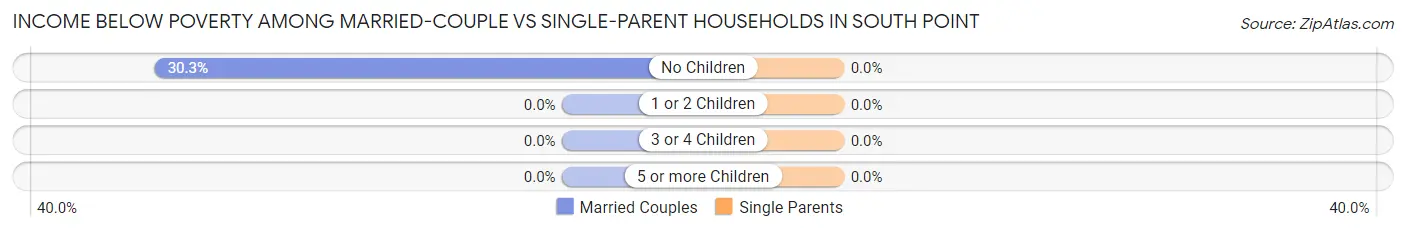
| Children | Married-Couple Families | Single-Parent Households |
| No Children | 50 (30.3%) | 0 (0.0%) |
| 1 or 2 Children | 0 (0.0%) | 0 (0.0%) |
| 3 or 4 Children | 0 (0.0%) | 0 (0.0%) |
| 5 or more Children | 0 (0.0%) | 0 (0.0%) |
| Total | 50 (25.4%) | 0 (0.0%) |
Employment Characteristics in South Point
Employment by Class of Employer in South Point
Among the 291 employed individuals in South Point, private company employees (285 | 97.9%), and self-employed (not incorporated) (6 | 2.1%) make up the most common classes of employment.
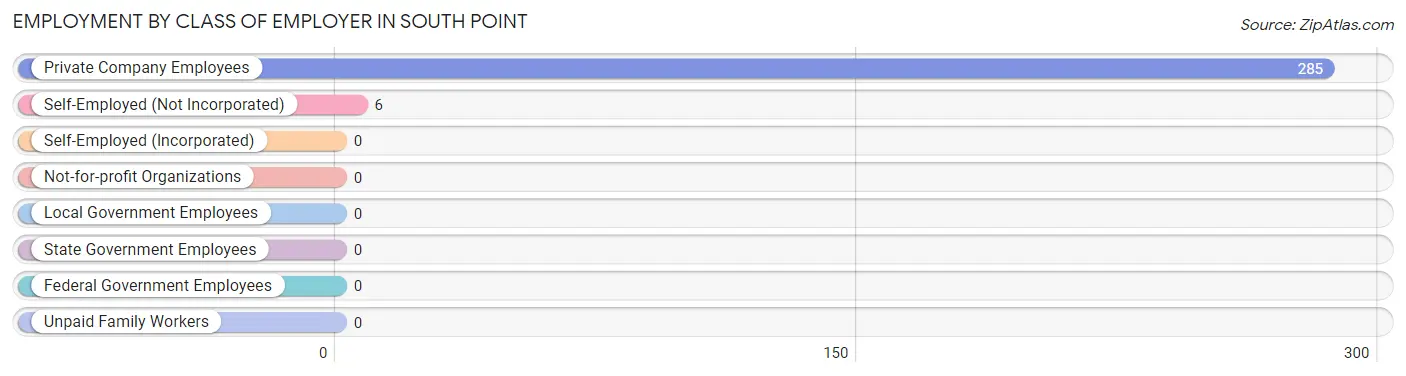
| Employer Class | # Employees | % Employees |
| Private Company Employees | 285 | 97.9% |
| Self-Employed (Incorporated) | 0 | 0.0% |
| Self-Employed (Not Incorporated) | 6 | 2.1% |
| Not-for-profit Organizations | 0 | 0.0% |
| Local Government Employees | 0 | 0.0% |
| State Government Employees | 0 | 0.0% |
| Federal Government Employees | 0 | 0.0% |
| Unpaid Family Workers | 0 | 0.0% |
| Total | 291 | 100.0% |
Employment Status by Age in South Point
According to the labor force statistics for South Point, out of the total population over 16 years of age (622), 51.0% or 317 individuals are in the labor force, with 2.8% or 9 of them unemployed. The age group with the highest labor force participation rate is 30 to 34 years, with 100.0% or 46 individuals in the labor force. Within the labor force, the 60 to 64 years age range has the highest percentage of unemployed individuals, with 75.0% or 9 of them being unemployed.
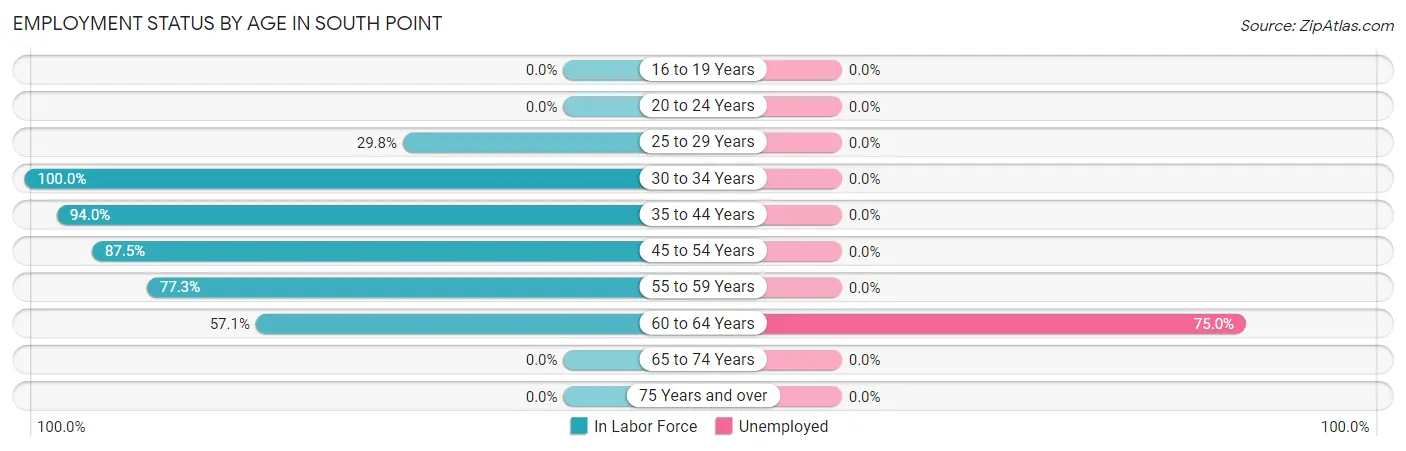
| Age Bracket | In Labor Force | Unemployed |
| 16 to 19 Years | 0 (0.0%) | 0 (0.0%) |
| 20 to 24 Years | 0 (0.0%) | 0 (0.0%) |
| 25 to 29 Years | 17 (29.8%) | 0 (0.0%) |
| 30 to 34 Years | 46 (100.0%) | 0 (0.0%) |
| 35 to 44 Years | 79 (94.0%) | 0 (0.0%) |
| 45 to 54 Years | 112 (87.5%) | 0 (0.0%) |
| 55 to 59 Years | 51 (77.3%) | 0 (0.0%) |
| 60 to 64 Years | 12 (57.1%) | 9 (75.0%) |
| 65 to 74 Years | 0 (0.0%) | 0 (0.0%) |
| 75 Years and over | 0 (0.0%) | 0 (0.0%) |
| Total | 317 (51.0%) | 9 (2.8%) |
Employment Status by Educational Attainment in South Point
According to labor force statistics for South Point, 78.9% of individuals (317) out of the total population between 25 and 64 years of age (402) are in the labor force, with 2.8% or 9 of them being unemployed. The group with the highest labor force participation rate are those with the educational attainment of bachelor's degree or higher, with 100.0% or 76 individuals in the labor force. Within the labor force, individuals with less than high school education have the highest percentage of unemployment, with 25.7% or 9 of them being unemployed.
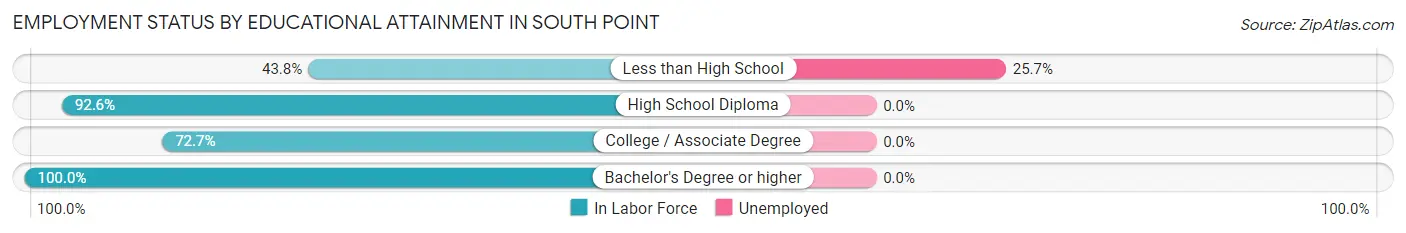
| Educational Attainment | In Labor Force | Unemployed |
| Less than High School | 35 (43.8%) | 21 (25.7%) |
| High School Diploma | 126 (92.6%) | 0 (0.0%) |
| College / Associate Degree | 80 (72.7%) | 0 (0.0%) |
| Bachelor's Degree or higher | 76 (100.0%) | 0 (0.0%) |
| Total | 317 (78.9%) | 11 (2.8%) |
Employment Occupations by Sex in South Point
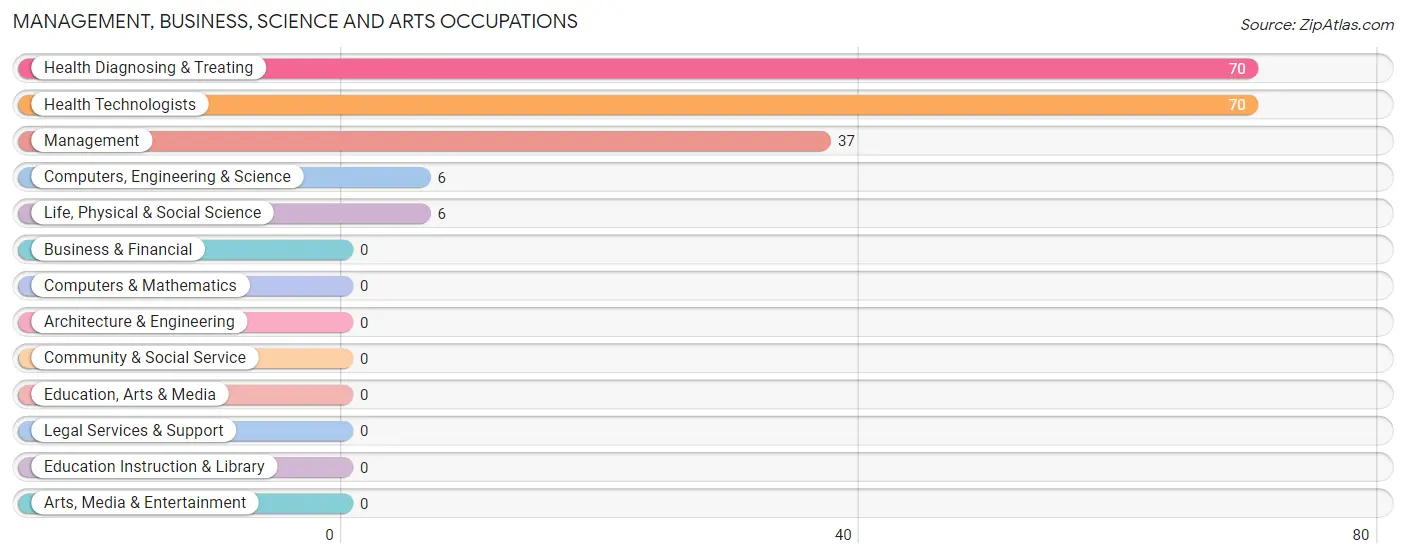
Management, Business, Science and Arts Occupations
The most common Management, Business, Science and Arts occupations in South Point are Health Diagnosing & Treating (70 | 22.7%), Health Technologists (70 | 22.7%), Management (37 | 12.0%), Computers, Engineering & Science (6 | 1.9%), and Life, Physical & Social Science (6 | 1.9%).
Management, Business, Science and Arts Occupations by Sex
Within the Management, Business, Science and Arts occupations in South Point, the most male-oriented occupations are Management (100.0%), Computers, Engineering & Science (100.0%), and Life, Physical & Social Science (100.0%), while the most female-oriented occupations are Health Diagnosing & Treating (40.0%), and Health Technologists (40.0%).
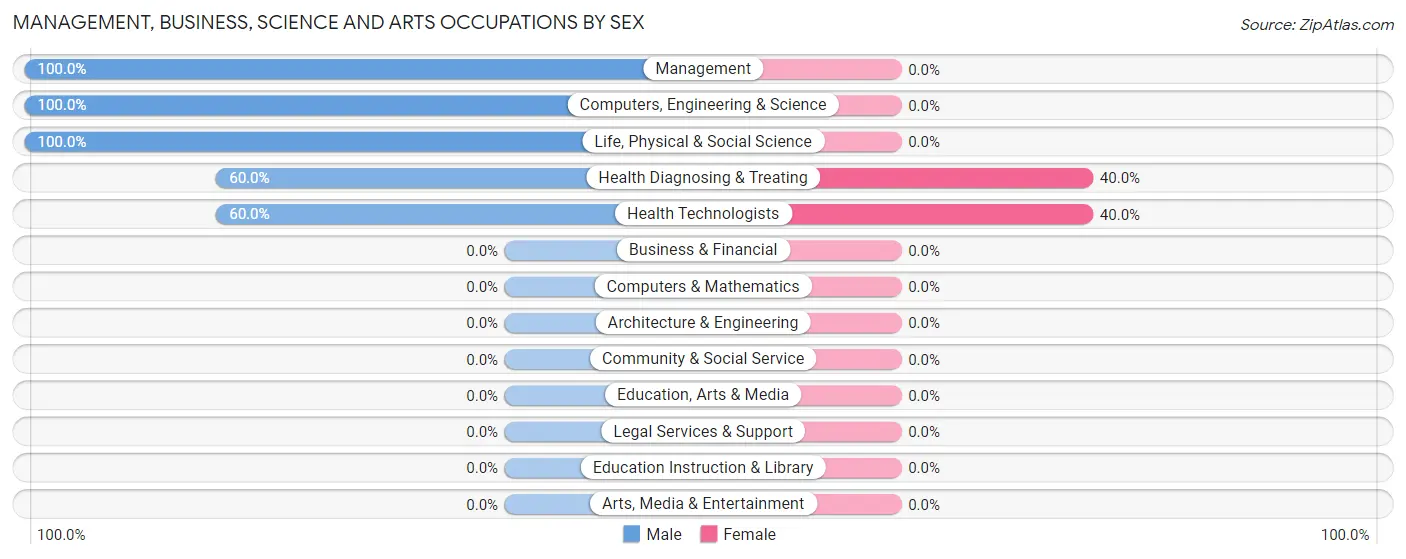
| Occupation | Male | Female |
| Management | 37 (100.0%) | 0 (0.0%) |
| Business & Financial | 0 (0.0%) | 0 (0.0%) |
| Computers, Engineering & Science | 6 (100.0%) | 0 (0.0%) |
| Computers & Mathematics | 0 (0.0%) | 0 (0.0%) |
| Architecture & Engineering | 0 (0.0%) | 0 (0.0%) |
| Life, Physical & Social Science | 6 (100.0%) | 0 (0.0%) |
| Community & Social Service | 0 (0.0%) | 0 (0.0%) |
| Education, Arts & Media | 0 (0.0%) | 0 (0.0%) |
| Legal Services & Support | 0 (0.0%) | 0 (0.0%) |
| Education Instruction & Library | 0 (0.0%) | 0 (0.0%) |
| Arts, Media & Entertainment | 0 (0.0%) | 0 (0.0%) |
| Health Diagnosing & Treating | 42 (60.0%) | 28 (40.0%) |
| Health Technologists | 42 (60.0%) | 28 (40.0%) |
| Total (Category) | 85 (75.2%) | 28 (24.8%) |
| Total (Overall) | 206 (66.9%) | 102 (33.1%) |
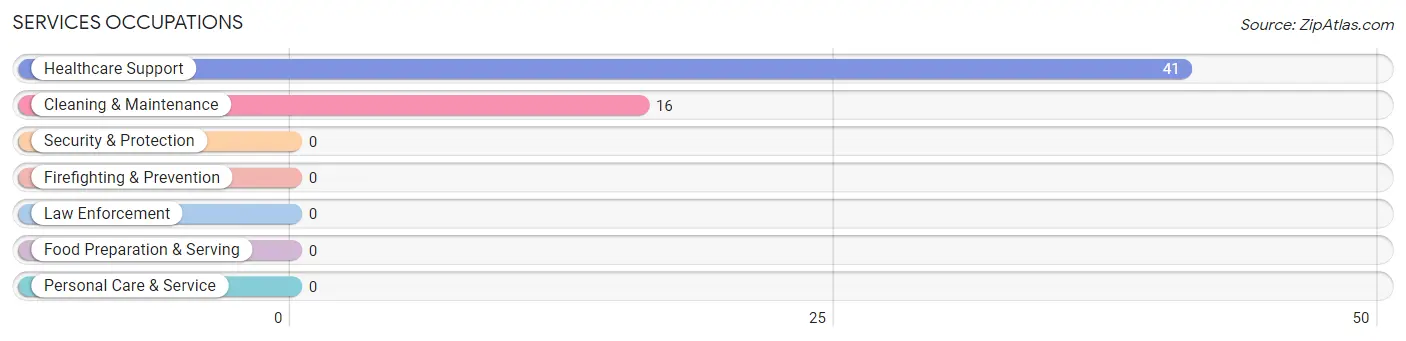
Services Occupations
The most common Services occupations in South Point are Healthcare Support (41 | 13.3%), and Cleaning & Maintenance (16 | 5.2%).
Services Occupations by Sex
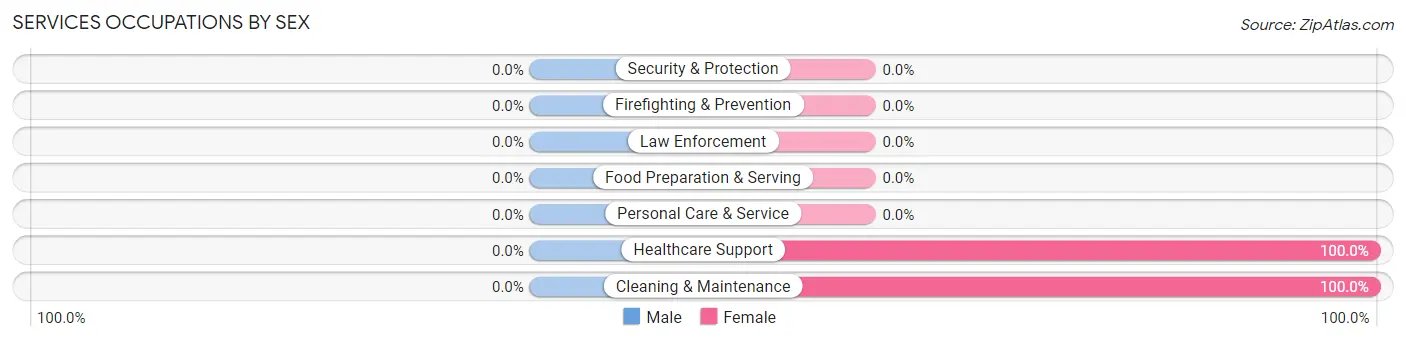
| Occupation | Male | Female |
| Healthcare Support | 0 (0.0%) | 41 (100.0%) |
| Security & Protection | 0 (0.0%) | 0 (0.0%) |
| Firefighting & Prevention | 0 (0.0%) | 0 (0.0%) |
| Law Enforcement | 0 (0.0%) | 0 (0.0%) |
| Food Preparation & Serving | 0 (0.0%) | 0 (0.0%) |
| Cleaning & Maintenance | 0 (0.0%) | 16 (100.0%) |
| Personal Care & Service | 0 (0.0%) | 0 (0.0%) |
| Total (Category) | 0 (0.0%) | 57 (100.0%) |
| Total (Overall) | 206 (66.9%) | 102 (33.1%) |
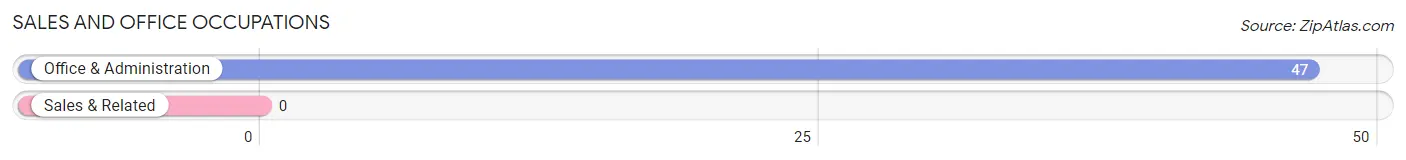
Sales and Office Occupations
The most common Sales and Office occupations in South Point are , and Office & Administration (47 | 15.3%).
Sales and Office Occupations by Sex
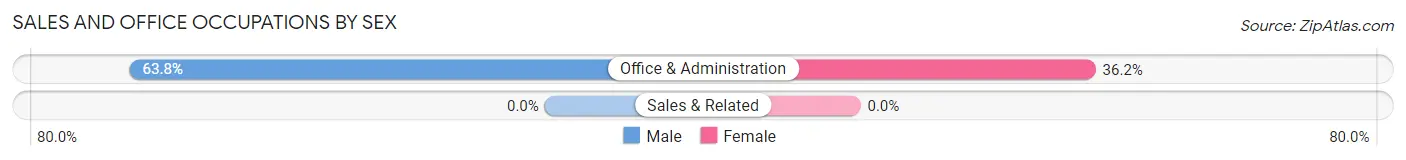
| Occupation | Male | Female |
| Sales & Related | 0 (0.0%) | 0 (0.0%) |
| Office & Administration | 30 (63.8%) | 17 (36.2%) |
| Total (Category) | 30 (63.8%) | 17 (36.2%) |
| Total (Overall) | 206 (66.9%) | 102 (33.1%) |
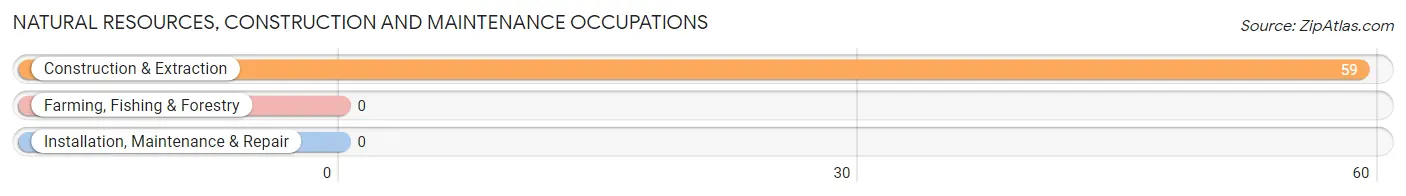
Natural Resources, Construction and Maintenance Occupations
The most common Natural Resources, Construction and Maintenance occupations in South Point are , and Construction & Extraction (59 | 19.2%).
Natural Resources, Construction and Maintenance Occupations by Sex
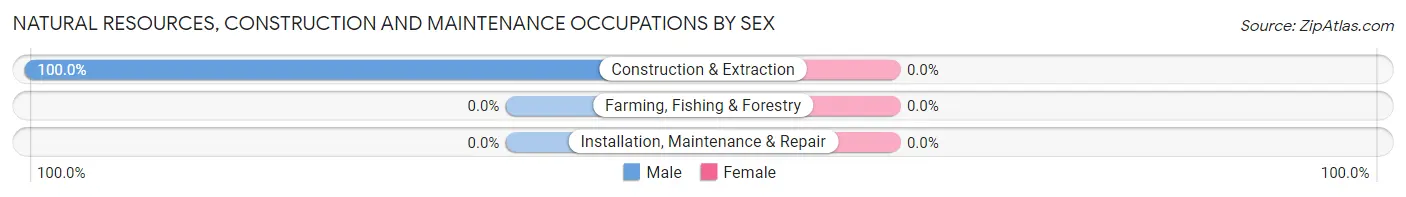
| Occupation | Male | Female |
| Farming, Fishing & Forestry | 0 (0.0%) | 0 (0.0%) |
| Construction & Extraction | 59 (100.0%) | 0 (0.0%) |
| Installation, Maintenance & Repair | 0 (0.0%) | 0 (0.0%) |
| Total (Category) | 59 (100.0%) | 0 (0.0%) |
| Total (Overall) | 206 (66.9%) | 102 (33.1%) |
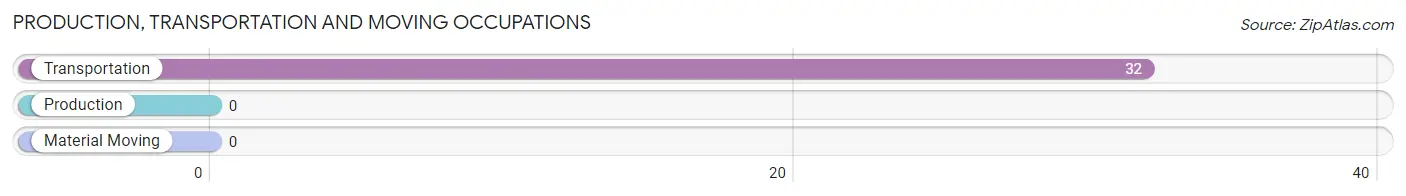
Production, Transportation and Moving Occupations
The most common Production, Transportation and Moving occupations in South Point are , and Transportation (32 | 10.4%).
Production, Transportation and Moving Occupations by Sex
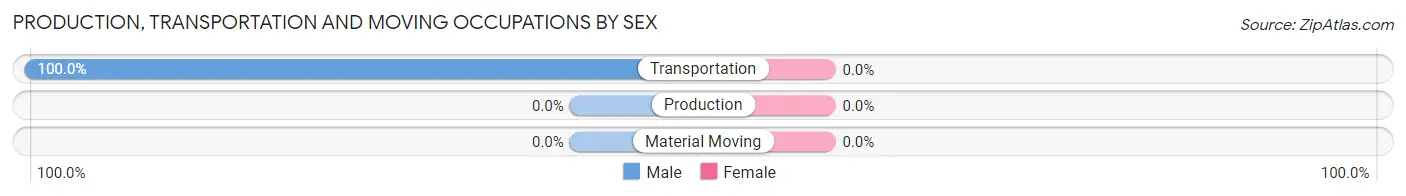
| Occupation | Male | Female |
| Production | 0 (0.0%) | 0 (0.0%) |
| Transportation | 32 (100.0%) | 0 (0.0%) |
| Material Moving | 0 (0.0%) | 0 (0.0%) |
| Total (Category) | 32 (100.0%) | 0 (0.0%) |
| Total (Overall) | 206 (66.9%) | 102 (33.1%) |
Employment Industries by Sex in South Point
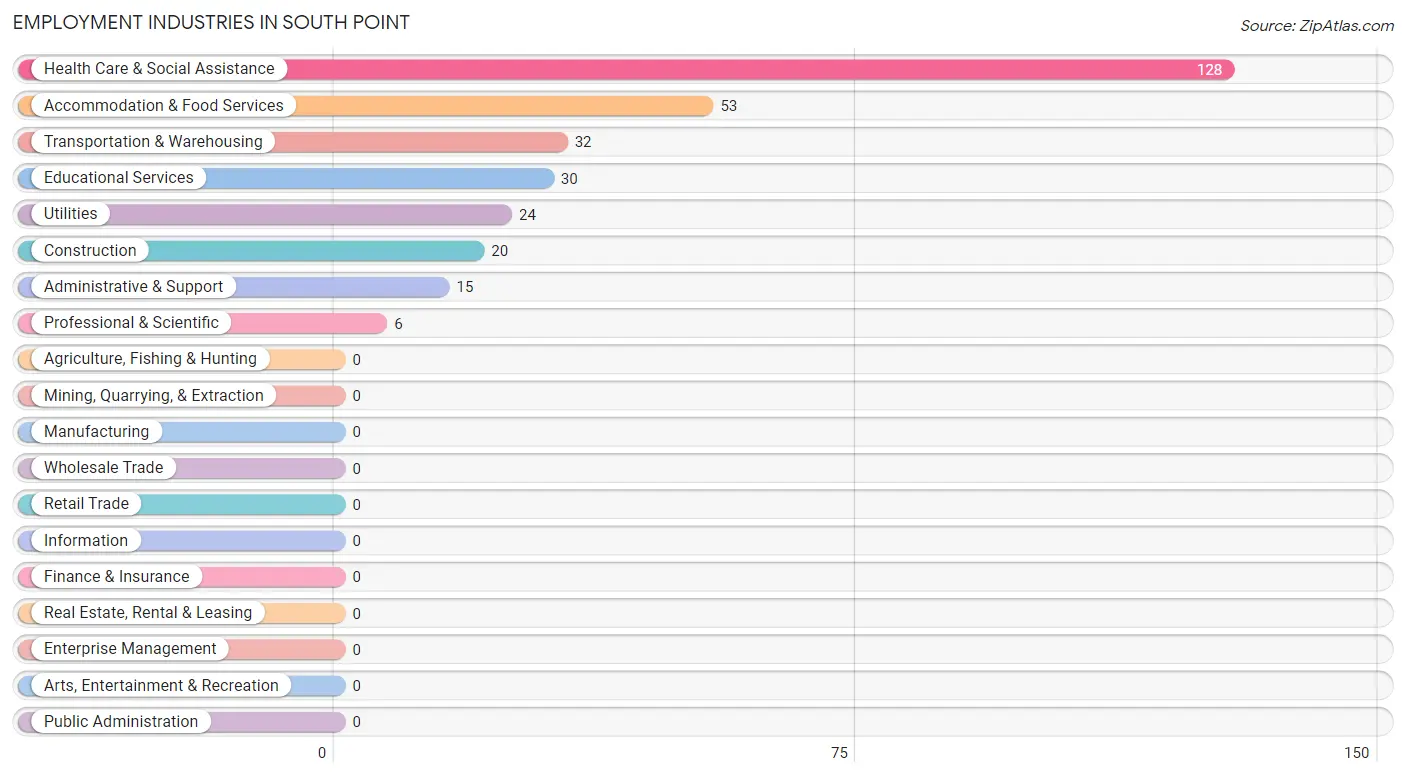
Employment Industries in South Point
The major employment industries in South Point include Health Care & Social Assistance (128 | 41.6%), Accommodation & Food Services (53 | 17.2%), Transportation & Warehousing (32 | 10.4%), Educational Services (30 | 9.7%), and Utilities (24 | 7.8%).
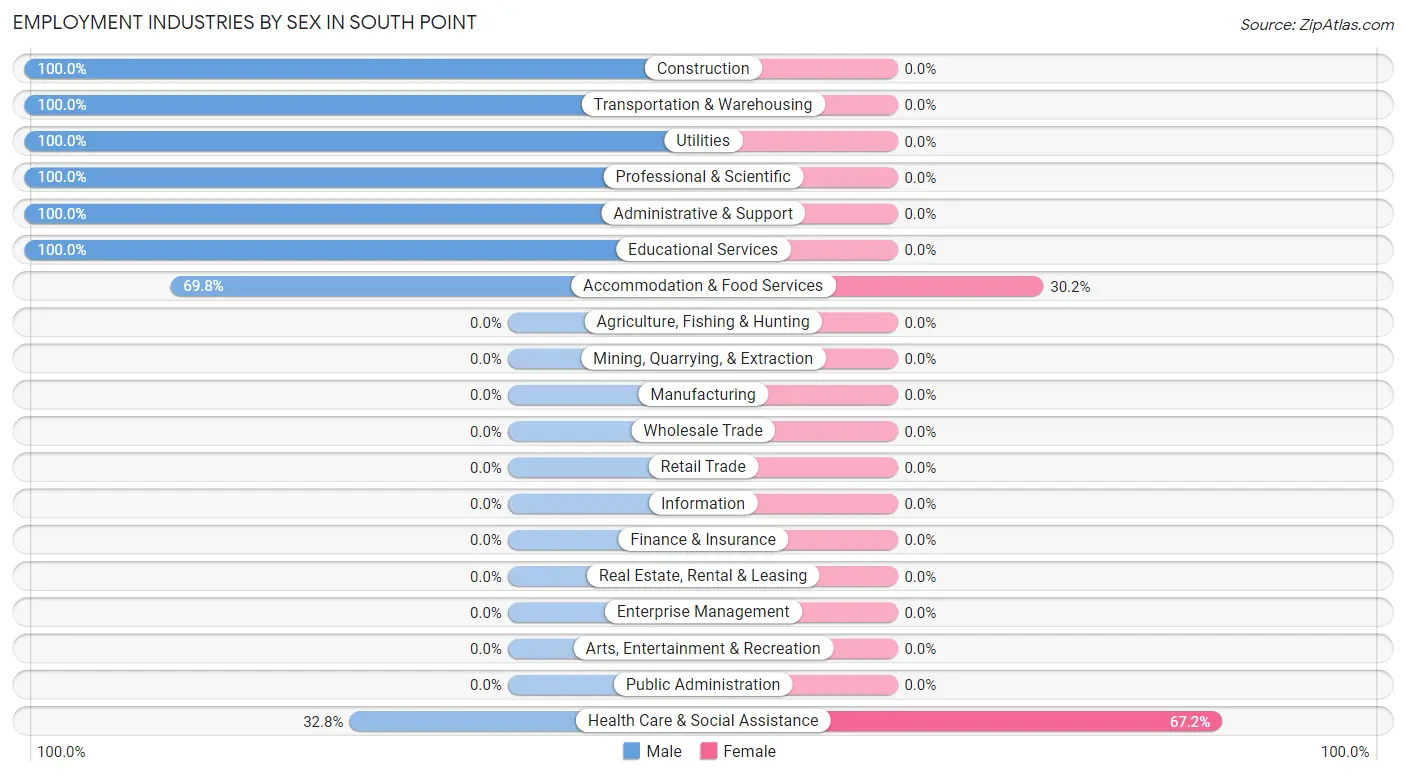
Employment Industries by Sex in South Point
The South Point industries that see more men than women are Construction (100.0%), Transportation & Warehousing (100.0%), and Utilities (100.0%), whereas the industries that tend to have a higher number of women are Health Care & Social Assistance (67.2%), and Accommodation & Food Services (30.2%).
| Industry | Male | Female |
| Agriculture, Fishing & Hunting | 0 (0.0%) | 0 (0.0%) |
| Mining, Quarrying, & Extraction | 0 (0.0%) | 0 (0.0%) |
| Construction | 20 (100.0%) | 0 (0.0%) |
| Manufacturing | 0 (0.0%) | 0 (0.0%) |
| Wholesale Trade | 0 (0.0%) | 0 (0.0%) |
| Retail Trade | 0 (0.0%) | 0 (0.0%) |
| Transportation & Warehousing | 32 (100.0%) | 0 (0.0%) |
| Utilities | 24 (100.0%) | 0 (0.0%) |
| Information | 0 (0.0%) | 0 (0.0%) |
| Finance & Insurance | 0 (0.0%) | 0 (0.0%) |
| Real Estate, Rental & Leasing | 0 (0.0%) | 0 (0.0%) |
| Professional & Scientific | 6 (100.0%) | 0 (0.0%) |
| Enterprise Management | 0 (0.0%) | 0 (0.0%) |
| Administrative & Support | 15 (100.0%) | 0 (0.0%) |
| Educational Services | 30 (100.0%) | 0 (0.0%) |
| Health Care & Social Assistance | 42 (32.8%) | 86 (67.2%) |
| Arts, Entertainment & Recreation | 0 (0.0%) | 0 (0.0%) |
| Accommodation & Food Services | 37 (69.8%) | 16 (30.2%) |
| Public Administration | 0 (0.0%) | 0 (0.0%) |
| Total | 206 (66.9%) | 102 (33.1%) |
Education in South Point
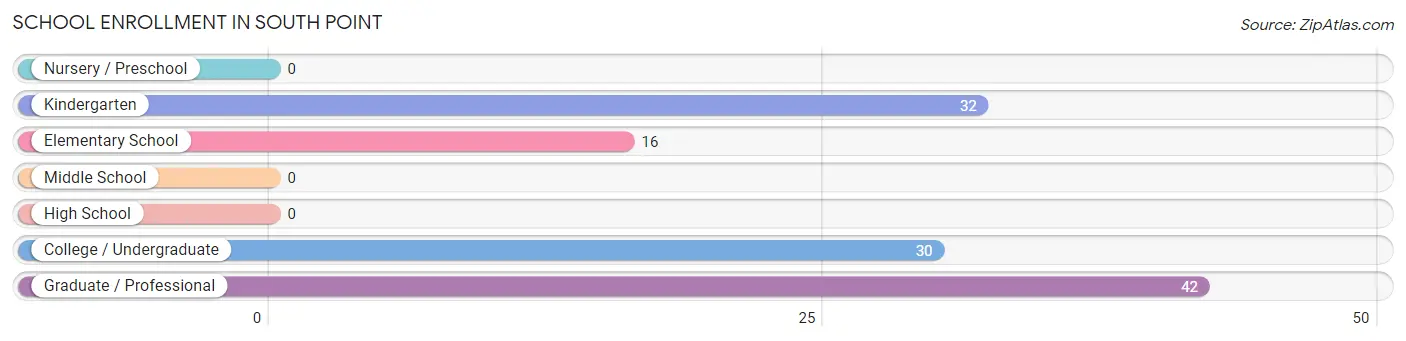
School Enrollment in South Point
The most common levels of schooling among the 120 students in South Point are graduate / professional (42 | 35.0%), kindergarten (32 | 26.7%), and college / undergraduate (30 | 25.0%).
| School Level | # Students | % Students |
| Nursery / Preschool | 0 | 0.0% |
| Kindergarten | 32 | 26.7% |
| Elementary School | 16 | 13.3% |
| Middle School | 0 | 0.0% |
| High School | 0 | 0.0% |
| College / Undergraduate | 30 | 25.0% |
| Graduate / Professional | 42 | 35.0% |
| Total | 120 | 100.0% |
School Enrollment by Age by Funding Source in South Point
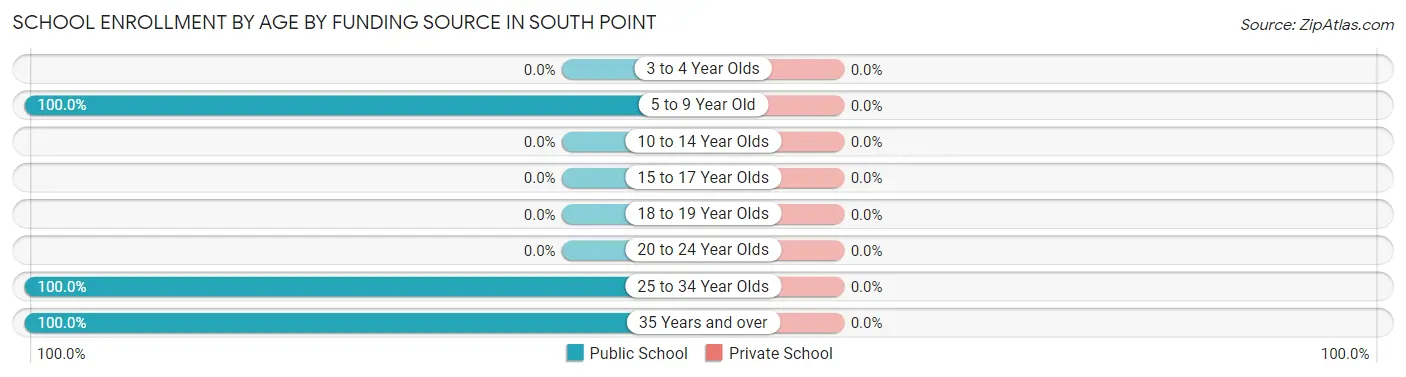
| Age Bracket | Public School | Private School |
| 3 to 4 Year Olds | 0 (0.0%) | 0 (0.0%) |
| 5 to 9 Year Old | 48 (100.0%) | 0 (0.0%) |
| 10 to 14 Year Olds | 0 (0.0%) | 0 (0.0%) |
| 15 to 17 Year Olds | 0 (0.0%) | 0 (0.0%) |
| 18 to 19 Year Olds | 0 (0.0%) | 0 (0.0%) |
| 20 to 24 Year Olds | 0 (0.0%) | 0 (0.0%) |
| 25 to 34 Year Olds | 30 (100.0%) | 0 (0.0%) |
| 35 Years and over | 42 (100.0%) | 0 (0.0%) |
| Total | 120 (100.0%) | 0 (0.0%) |
Educational Attainment by Field of Study in South Point
Science & technology (42 | 55.3%), communications (28 | 36.8%), and liberal arts & history (6 | 7.9%) are the most common fields of study among 76 individuals in South Point who have obtained a bachelor's degree or higher.
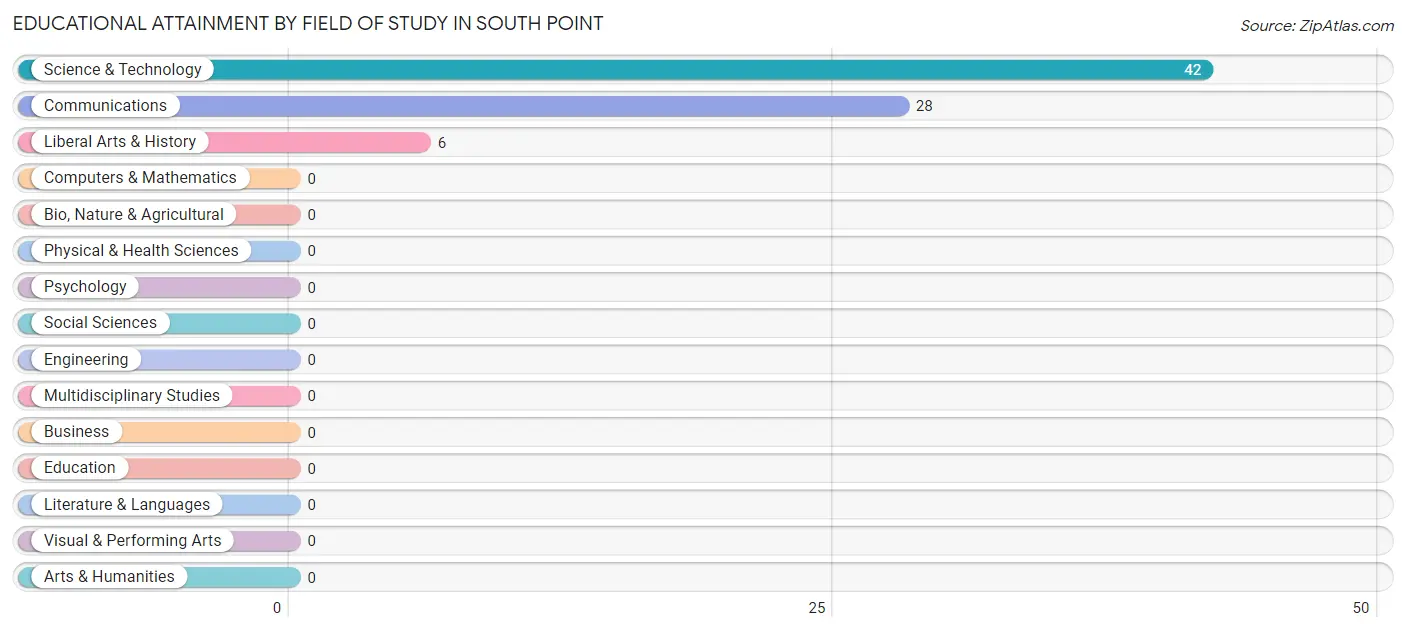
| Field of Study | # Graduates | % Graduates |
| Computers & Mathematics | 0 | 0.0% |
| Bio, Nature & Agricultural | 0 | 0.0% |
| Physical & Health Sciences | 0 | 0.0% |
| Psychology | 0 | 0.0% |
| Social Sciences | 0 | 0.0% |
| Engineering | 0 | 0.0% |
| Multidisciplinary Studies | 0 | 0.0% |
| Science & Technology | 42 | 55.3% |
| Business | 0 | 0.0% |
| Education | 0 | 0.0% |
| Literature & Languages | 0 | 0.0% |
| Liberal Arts & History | 6 | 7.9% |
| Visual & Performing Arts | 0 | 0.0% |
| Communications | 28 | 36.8% |
| Arts & Humanities | 0 | 0.0% |
| Total | 76 | 100.0% |
Transportation & Commute in South Point
Vehicle Availability by Sex in South Point
The most prevalent vehicle ownership categories in South Point are males with 2 vehicles (94, accounting for 49.7%) and females with 2 vehicles (33, making up 92.2%).
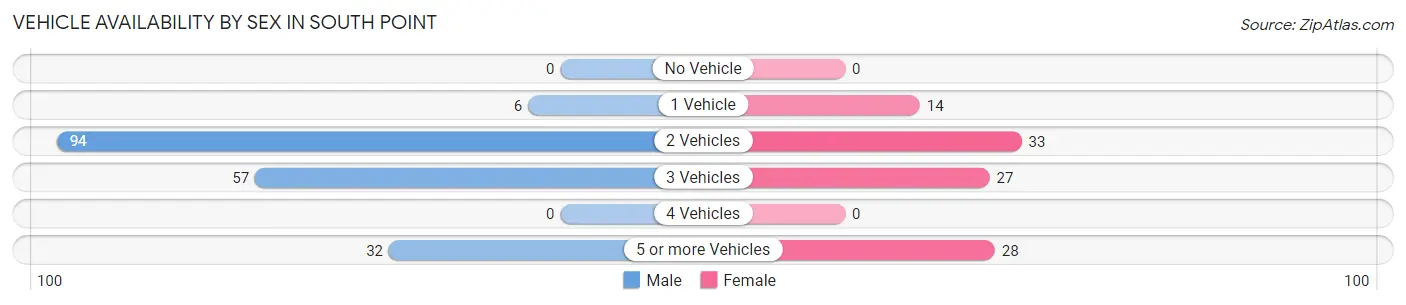
| Vehicles Available | Male | Female |
| No Vehicle | 0 (0.0%) | 0 (0.0%) |
| 1 Vehicle | 6 (3.2%) | 14 (13.7%) |
| 2 Vehicles | 94 (49.7%) | 33 (32.4%) |
| 3 Vehicles | 57 (30.2%) | 27 (26.5%) |
| 4 Vehicles | 0 (0.0%) | 0 (0.0%) |
| 5 or more Vehicles | 32 (16.9%) | 28 (27.5%) |
| Total | 189 (100.0%) | 102 (100.0%) |
Commute Time in South Point
The most frequently occuring commute durations in South Point are 30 to 34 minutes (69 commuters, 33.5%), 20 to 24 minutes (39 commuters, 18.9%), and 25 to 29 minutes (31 commuters, 15.0%).
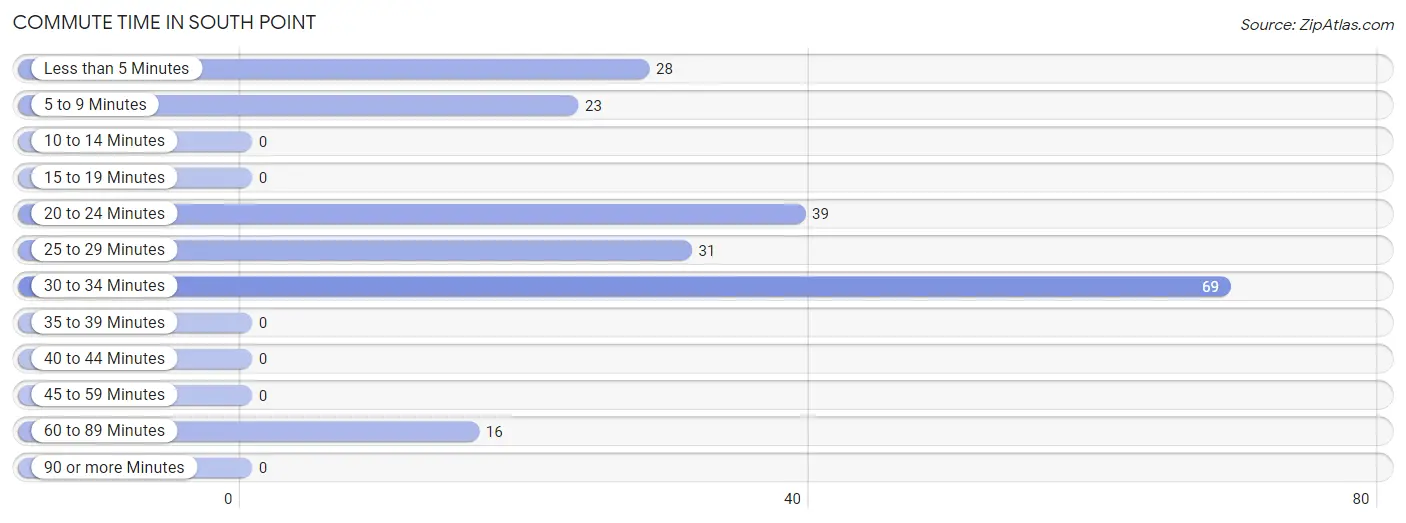
| Commute Time | # Commuters | % Commuters |
| Less than 5 Minutes | 28 | 13.6% |
| 5 to 9 Minutes | 23 | 11.2% |
| 10 to 14 Minutes | 0 | 0.0% |
| 15 to 19 Minutes | 0 | 0.0% |
| 20 to 24 Minutes | 39 | 18.9% |
| 25 to 29 Minutes | 31 | 15.0% |
| 30 to 34 Minutes | 69 | 33.5% |
| 35 to 39 Minutes | 0 | 0.0% |
| 40 to 44 Minutes | 0 | 0.0% |
| 45 to 59 Minutes | 0 | 0.0% |
| 60 to 89 Minutes | 16 | 7.8% |
| 90 or more Minutes | 0 | 0.0% |
Commute Time by Sex in South Point
The most common commute times in South Point are 30 to 34 minutes (69 commuters, 66.3%) for males and 25 to 29 minutes (31 commuters, 30.4%) for females.
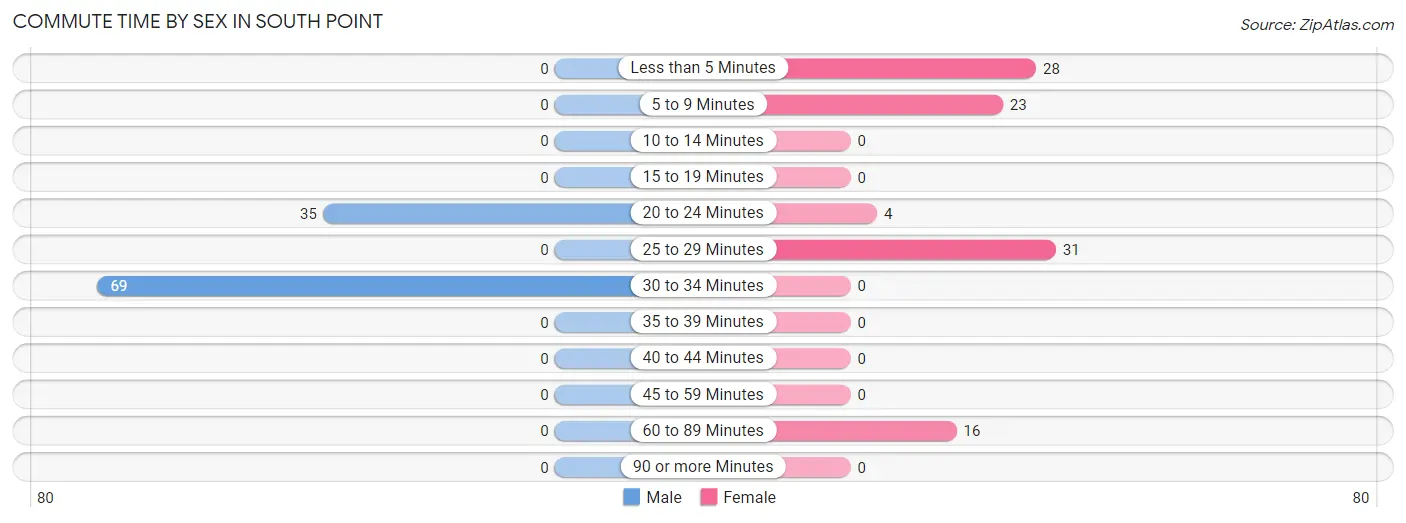
| Commute Time | Male | Female |
| Less than 5 Minutes | 0 (0.0%) | 28 (27.5%) |
| 5 to 9 Minutes | 0 (0.0%) | 23 (22.6%) |
| 10 to 14 Minutes | 0 (0.0%) | 0 (0.0%) |
| 15 to 19 Minutes | 0 (0.0%) | 0 (0.0%) |
| 20 to 24 Minutes | 35 (33.7%) | 4 (3.9%) |
| 25 to 29 Minutes | 0 (0.0%) | 31 (30.4%) |
| 30 to 34 Minutes | 69 (66.3%) | 0 (0.0%) |
| 35 to 39 Minutes | 0 (0.0%) | 0 (0.0%) |
| 40 to 44 Minutes | 0 (0.0%) | 0 (0.0%) |
| 45 to 59 Minutes | 0 (0.0%) | 0 (0.0%) |
| 60 to 89 Minutes | 0 (0.0%) | 16 (15.7%) |
| 90 or more Minutes | 0 (0.0%) | 0 (0.0%) |
Time of Departure to Work by Sex in South Point
The most frequent times of departure to work in South Point are 6:00 AM to 6:29 AM (39, 37.5%) for males and 7:00 AM to 7:29 AM (33, 32.4%) for females.
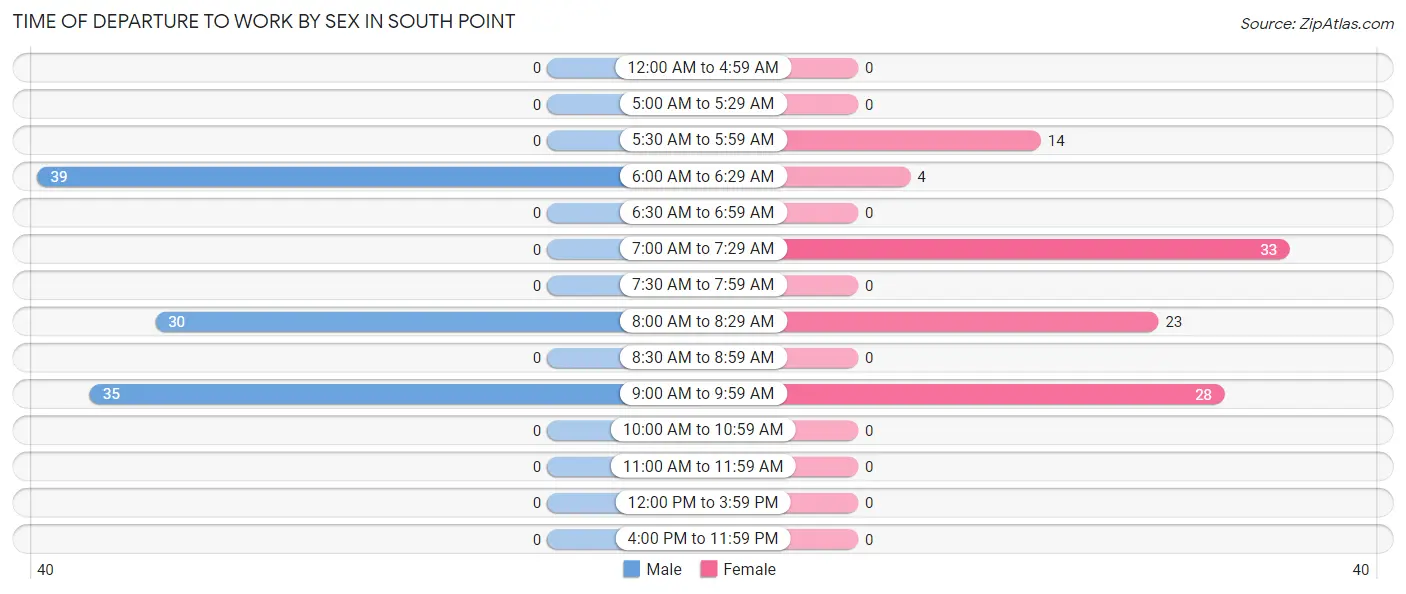
| Time of Departure | Male | Female |
| 12:00 AM to 4:59 AM | 0 (0.0%) | 0 (0.0%) |
| 5:00 AM to 5:29 AM | 0 (0.0%) | 0 (0.0%) |
| 5:30 AM to 5:59 AM | 0 (0.0%) | 14 (13.7%) |
| 6:00 AM to 6:29 AM | 39 (37.5%) | 4 (3.9%) |
| 6:30 AM to 6:59 AM | 0 (0.0%) | 0 (0.0%) |
| 7:00 AM to 7:29 AM | 0 (0.0%) | 33 (32.4%) |
| 7:30 AM to 7:59 AM | 0 (0.0%) | 0 (0.0%) |
| 8:00 AM to 8:29 AM | 30 (28.8%) | 23 (22.6%) |
| 8:30 AM to 8:59 AM | 0 (0.0%) | 0 (0.0%) |
| 9:00 AM to 9:59 AM | 35 (33.7%) | 28 (27.5%) |
| 10:00 AM to 10:59 AM | 0 (0.0%) | 0 (0.0%) |
| 11:00 AM to 11:59 AM | 0 (0.0%) | 0 (0.0%) |
| 12:00 PM to 3:59 PM | 0 (0.0%) | 0 (0.0%) |
| 4:00 PM to 11:59 PM | 0 (0.0%) | 0 (0.0%) |
| Total | 104 (100.0%) | 102 (100.0%) |
Housing Occupancy in South Point
Occupancy by Ownership in South Point
Of the total 269 dwellings in South Point, owner-occupied units account for 219 (81.4%), while renter-occupied units make up 50 (18.6%).
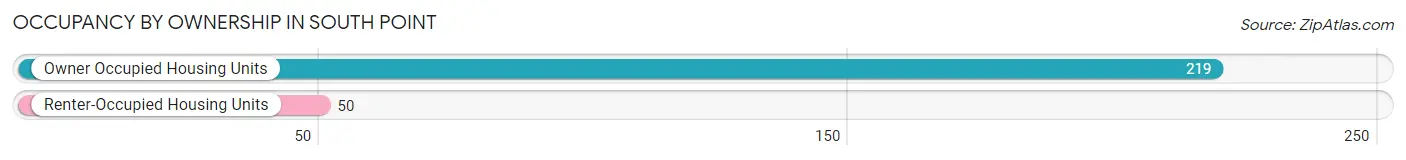
| Occupancy | # Housing Units | % Housing Units |
| Owner Occupied Housing Units | 219 | 81.4% |
| Renter-Occupied Housing Units | 50 | 18.6% |
| Total Occupied Housing Units | 269 | 100.0% |
Occupancy by Household Size in South Point
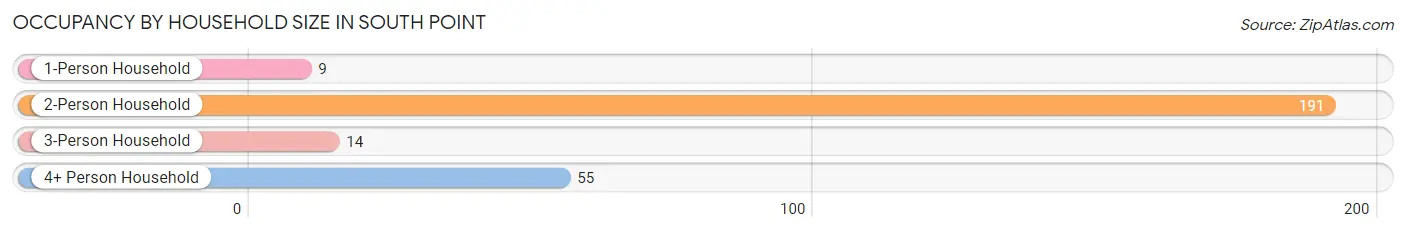
| Household Size | # Housing Units | % Housing Units |
| 1-Person Household | 9 | 3.4% |
| 2-Person Household | 191 | 71.0% |
| 3-Person Household | 14 | 5.2% |
| 4+ Person Household | 55 | 20.4% |
| Total Housing Units | 269 | 100.0% |
Occupancy by Ownership by Household Size in South Point
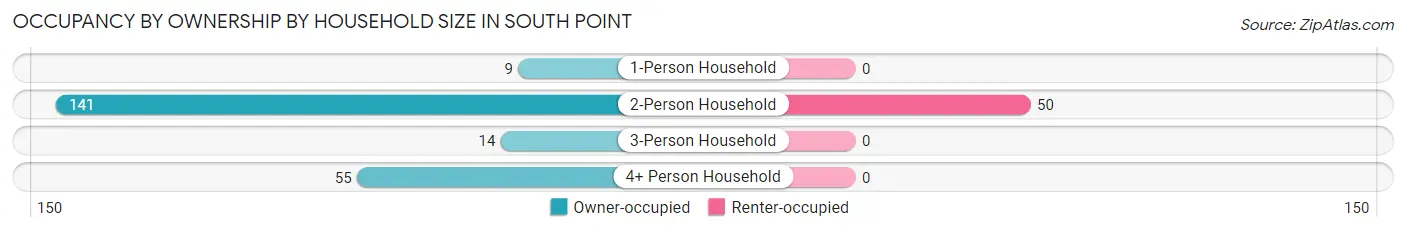
| Household Size | Owner-occupied | Renter-occupied |
| 1-Person Household | 9 (100.0%) | 0 (0.0%) |
| 2-Person Household | 141 (73.8%) | 50 (26.2%) |
| 3-Person Household | 14 (100.0%) | 0 (0.0%) |
| 4+ Person Household | 55 (100.0%) | 0 (0.0%) |
| Total Housing Units | 219 (81.4%) | 50 (18.6%) |
Occupancy by Educational Attainment in South Point
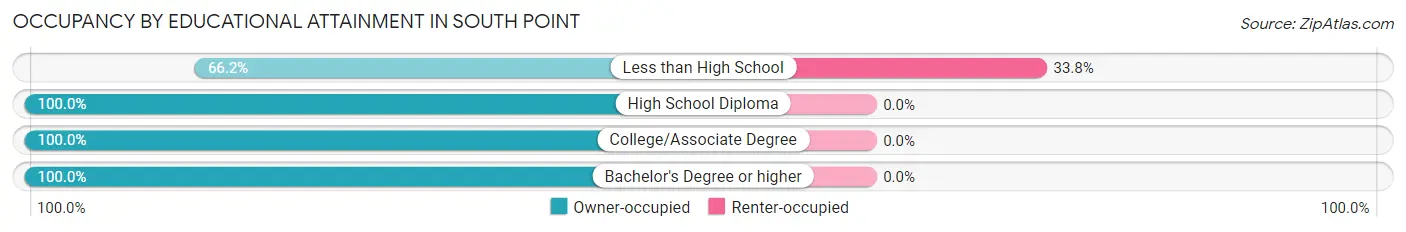
| Household Size | Owner-occupied | Renter-occupied |
| Less than High School | 98 (66.2%) | 50 (33.8%) |
| High School Diploma | 14 (100.0%) | 0 (0.0%) |
| College/Associate Degree | 31 (100.0%) | 0 (0.0%) |
| Bachelor's Degree or higher | 76 (100.0%) | 0 (0.0%) |
Occupancy by Age of Householder in South Point
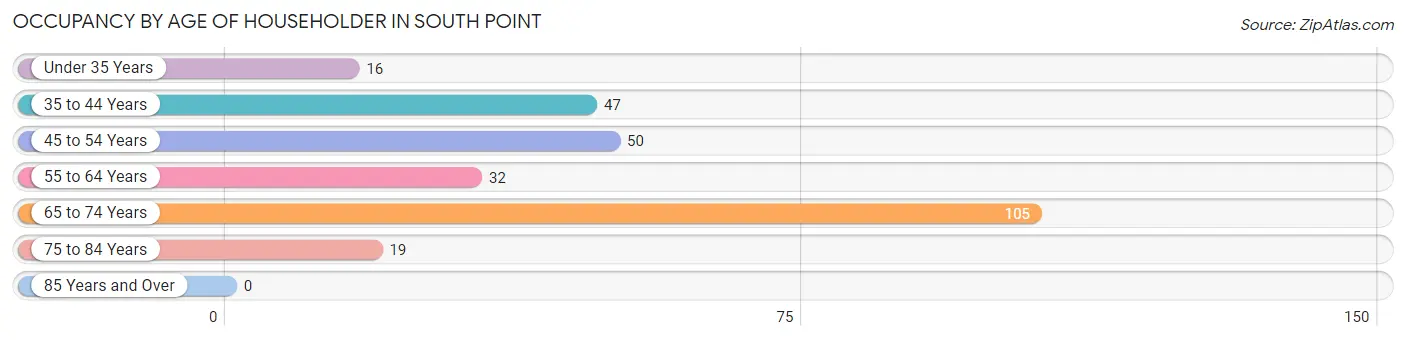
| Age Bracket | # Households | % Households |
| Under 35 Years | 16 | 5.9% |
| 35 to 44 Years | 47 | 17.5% |
| 45 to 54 Years | 50 | 18.6% |
| 55 to 64 Years | 32 | 11.9% |
| 65 to 74 Years | 105 | 39.0% |
| 75 to 84 Years | 19 | 7.1% |
| 85 Years and Over | 0 | 0.0% |
| Total | 269 | 100.0% |
Housing Finances in South Point
Median Income by Occupancy in South Point
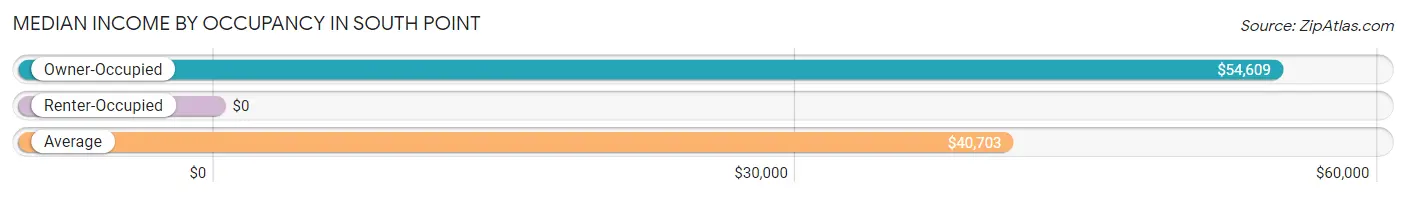
| Occupancy Type | # Households | Median Income |
| Owner-Occupied | 219 (81.4%) | $54,609 |
| Renter-Occupied | 50 (18.6%) | $0 |
| Average | 269 (100.0%) | $40,703 |
Occupancy by Householder Income Bracket in South Point
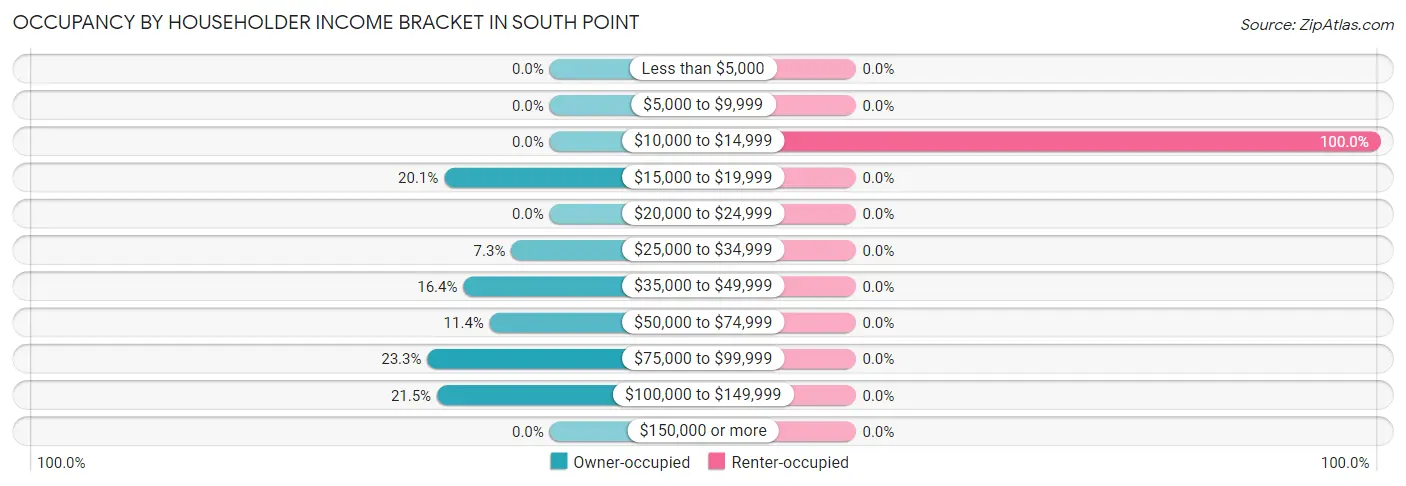
| Income Bracket | Owner-occupied | Renter-occupied |
| Less than $5,000 | 0 (0.0%) | 0 (0.0%) |
| $5,000 to $9,999 | 0 (0.0%) | 0 (0.0%) |
| $10,000 to $14,999 | 0 (0.0%) | 50 (100.0%) |
| $15,000 to $19,999 | 44 (20.1%) | 0 (0.0%) |
| $20,000 to $24,999 | 0 (0.0%) | 0 (0.0%) |
| $25,000 to $34,999 | 16 (7.3%) | 0 (0.0%) |
| $35,000 to $49,999 | 36 (16.4%) | 0 (0.0%) |
| $50,000 to $74,999 | 25 (11.4%) | 0 (0.0%) |
| $75,000 to $99,999 | 51 (23.3%) | 0 (0.0%) |
| $100,000 to $149,999 | 47 (21.5%) | 0 (0.0%) |
| $150,000 or more | 0 (0.0%) | 0 (0.0%) |
| Total | 219 (100.0%) | 50 (100.0%) |
Monthly Housing Cost Tiers in South Point
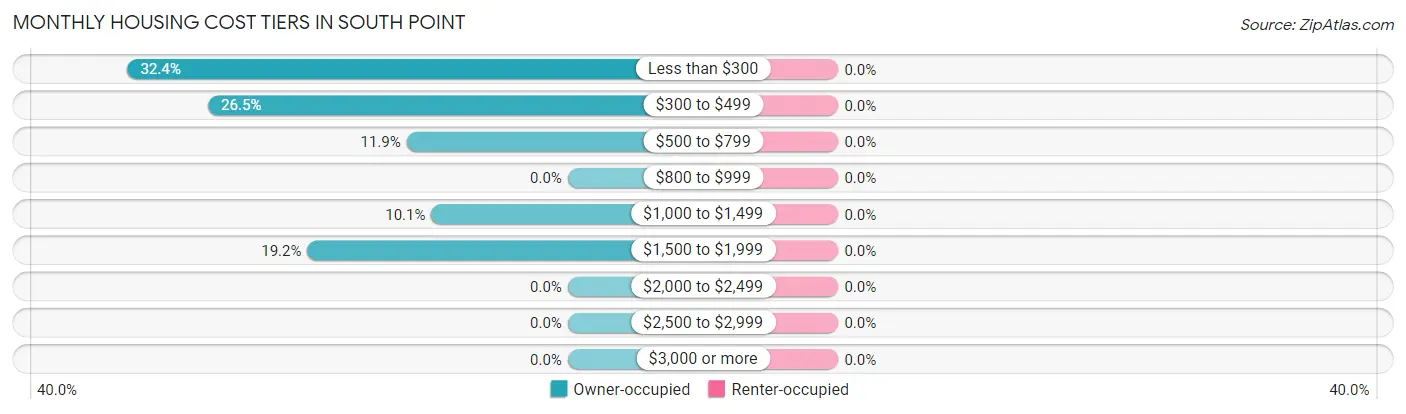
| Monthly Cost | Owner-occupied | Renter-occupied |
| Less than $300 | 71 (32.4%) | 0 (0.0%) |
| $300 to $499 | 58 (26.5%) | 0 (0.0%) |
| $500 to $799 | 26 (11.9%) | 0 (0.0%) |
| $800 to $999 | 0 (0.0%) | 0 (0.0%) |
| $1,000 to $1,499 | 22 (10.1%) | 0 (0.0%) |
| $1,500 to $1,999 | 42 (19.2%) | 0 (0.0%) |
| $2,000 to $2,499 | 0 (0.0%) | 0 (0.0%) |
| $2,500 to $2,999 | 0 (0.0%) | 0 (0.0%) |
| $3,000 or more | 0 (0.0%) | 0 (0.0%) |
| Total | 219 (100.0%) | 50 (100.0%) |
Physical Housing Characteristics in South Point
Housing Structures in South Point
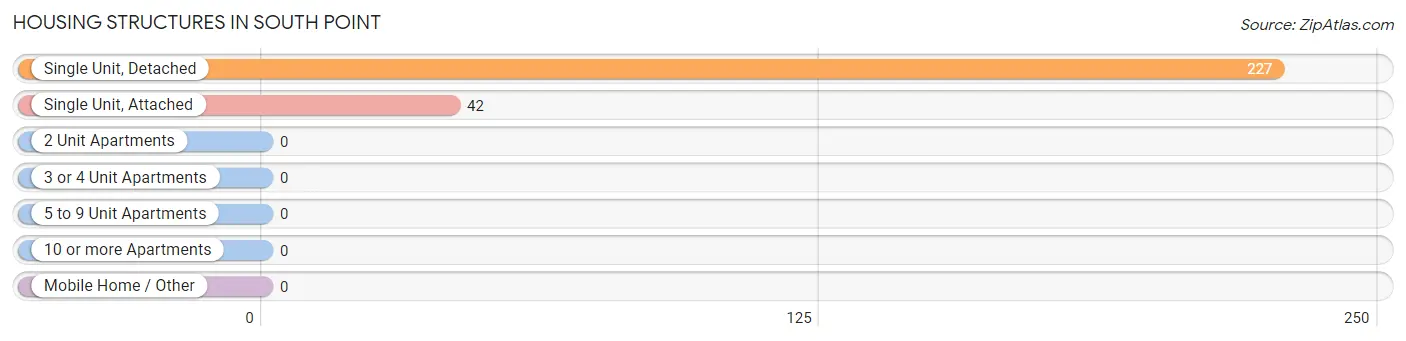
| Structure Type | # Housing Units | % Housing Units |
| Single Unit, Detached | 227 | 84.4% |
| Single Unit, Attached | 42 | 15.6% |
| 2 Unit Apartments | 0 | 0.0% |
| 3 or 4 Unit Apartments | 0 | 0.0% |
| 5 to 9 Unit Apartments | 0 | 0.0% |
| 10 or more Apartments | 0 | 0.0% |
| Mobile Home / Other | 0 | 0.0% |
| Total | 269 | 100.0% |
Housing Structures by Occupancy in South Point
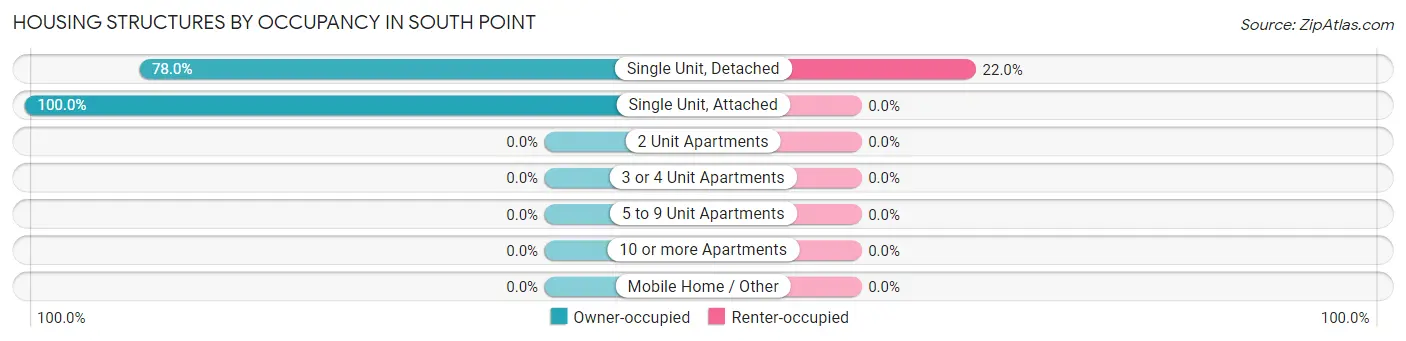
| Structure Type | Owner-occupied | Renter-occupied |
| Single Unit, Detached | 177 (78.0%) | 50 (22.0%) |
| Single Unit, Attached | 42 (100.0%) | 0 (0.0%) |
| 2 Unit Apartments | 0 (0.0%) | 0 (0.0%) |
| 3 or 4 Unit Apartments | 0 (0.0%) | 0 (0.0%) |
| 5 to 9 Unit Apartments | 0 (0.0%) | 0 (0.0%) |
| 10 or more Apartments | 0 (0.0%) | 0 (0.0%) |
| Mobile Home / Other | 0 (0.0%) | 0 (0.0%) |
| Total | 219 (81.4%) | 50 (18.6%) |
Housing Structures by Number of Rooms in South Point
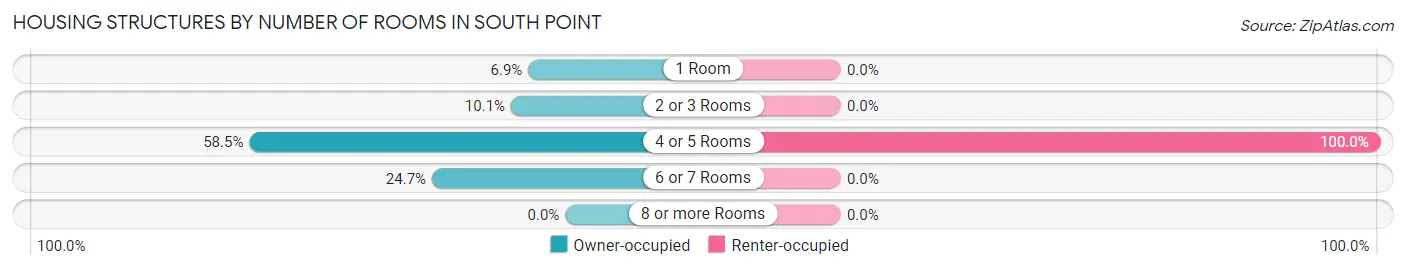
| Number of Rooms | Owner-occupied | Renter-occupied |
| 1 Room | 15 (6.9%) | 0 (0.0%) |
| 2 or 3 Rooms | 22 (10.1%) | 0 (0.0%) |
| 4 or 5 Rooms | 128 (58.5%) | 50 (100.0%) |
| 6 or 7 Rooms | 54 (24.7%) | 0 (0.0%) |
| 8 or more Rooms | 0 (0.0%) | 0 (0.0%) |
| Total | 219 (100.0%) | 50 (100.0%) |
Housing Structure by Heating Type in South Point
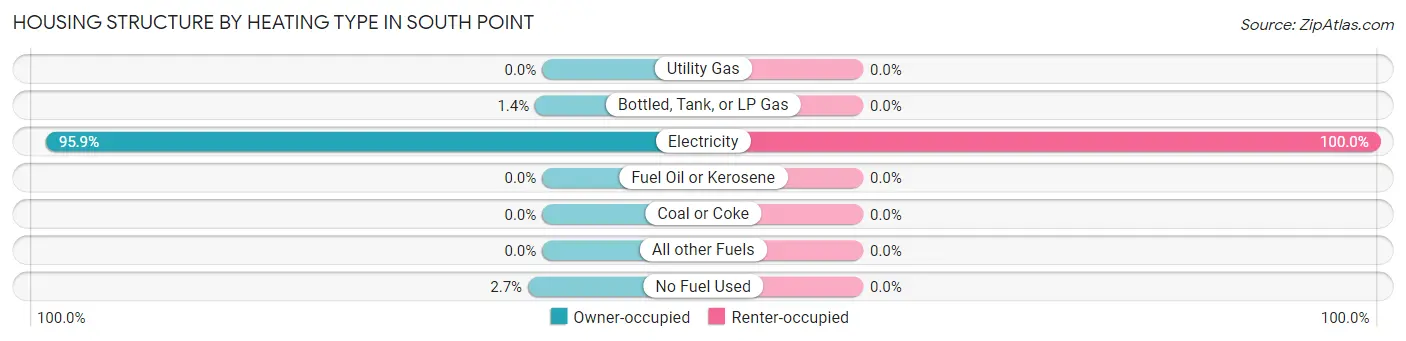
| Heating Type | Owner-occupied | Renter-occupied |
| Utility Gas | 0 (0.0%) | 0 (0.0%) |
| Bottled, Tank, or LP Gas | 3 (1.4%) | 0 (0.0%) |
| Electricity | 210 (95.9%) | 50 (100.0%) |
| Fuel Oil or Kerosene | 0 (0.0%) | 0 (0.0%) |
| Coal or Coke | 0 (0.0%) | 0 (0.0%) |
| All other Fuels | 0 (0.0%) | 0 (0.0%) |
| No Fuel Used | 6 (2.7%) | 0 (0.0%) |
| Total | 219 (100.0%) | 50 (100.0%) |
Household Vehicle Usage in South Point
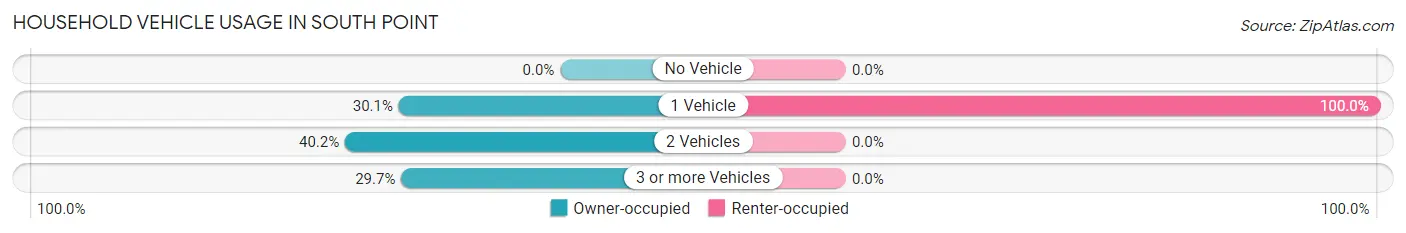
| Vehicles per Household | Owner-occupied | Renter-occupied |
| No Vehicle | 0 (0.0%) | 0 (0.0%) |
| 1 Vehicle | 66 (30.1%) | 50 (100.0%) |
| 2 Vehicles | 88 (40.2%) | 0 (0.0%) |
| 3 or more Vehicles | 65 (29.7%) | 0 (0.0%) |
| Total | 219 (100.0%) | 50 (100.0%) |
Real Estate & Mortgages in South Point
Real Estate and Mortgage Overview in South Point
| Characteristic | Without Mortgage | With Mortgage |
| Housing Units | 155 | 64 |
| Median Property Value | $84,200 | $134,500 |
| Median Household Income | - | - |
| Monthly Housing Costs | $370 | $0 |
| Real Estate Taxes | $622 | $0 |
Property Value by Mortgage Status in South Point
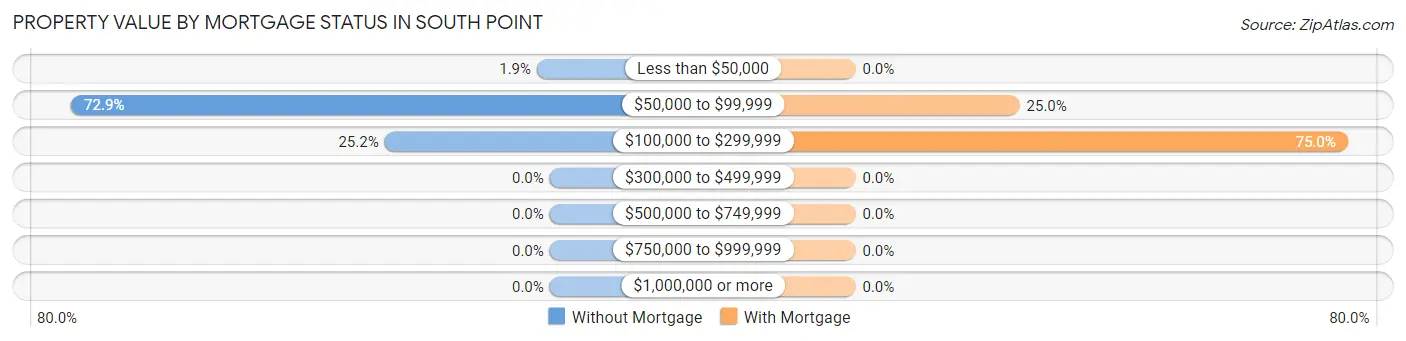
| Property Value | Without Mortgage | With Mortgage |
| Less than $50,000 | 3 (1.9%) | 0 (0.0%) |
| $50,000 to $99,999 | 113 (72.9%) | 16 (25.0%) |
| $100,000 to $299,999 | 39 (25.2%) | 48 (75.0%) |
| $300,000 to $499,999 | 0 (0.0%) | 0 (0.0%) |
| $500,000 to $749,999 | 0 (0.0%) | 0 (0.0%) |
| $750,000 to $999,999 | 0 (0.0%) | 0 (0.0%) |
| $1,000,000 or more | 0 (0.0%) | 0 (0.0%) |
| Total | 155 (100.0%) | 64 (100.0%) |
Household Income by Mortgage Status in South Point
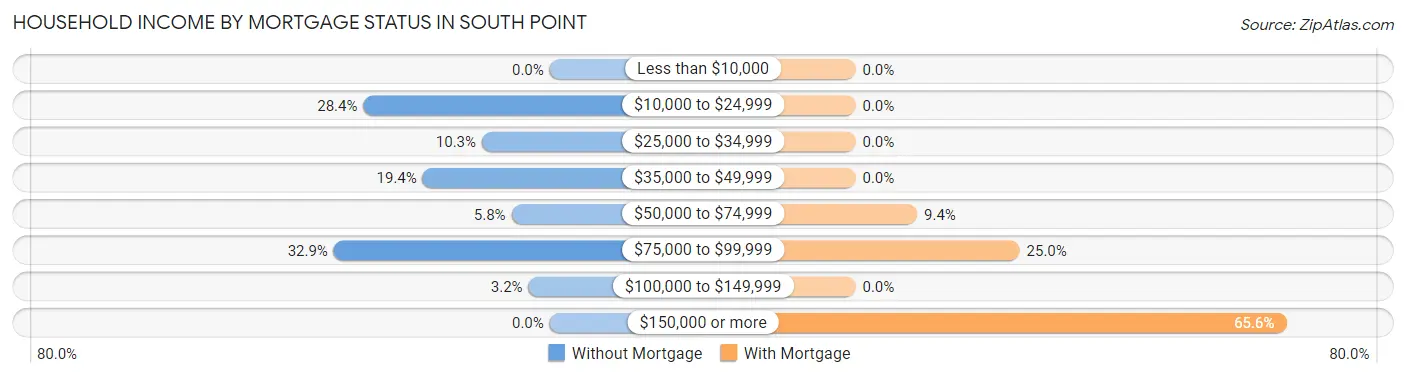
| Household Income | Without Mortgage | With Mortgage |
| Less than $10,000 | 0 (0.0%) | 0 (0.0%) |
| $10,000 to $24,999 | 44 (28.4%) | 0 (0.0%) |
| $25,000 to $34,999 | 16 (10.3%) | 0 (0.0%) |
| $35,000 to $49,999 | 30 (19.4%) | 0 (0.0%) |
| $50,000 to $74,999 | 9 (5.8%) | 6 (9.4%) |
| $75,000 to $99,999 | 51 (32.9%) | 16 (25.0%) |
| $100,000 to $149,999 | 5 (3.2%) | 0 (0.0%) |
| $150,000 or more | 0 (0.0%) | 42 (65.6%) |
| Total | 155 (100.0%) | 64 (100.0%) |
Property Value to Household Income Ratio in South Point
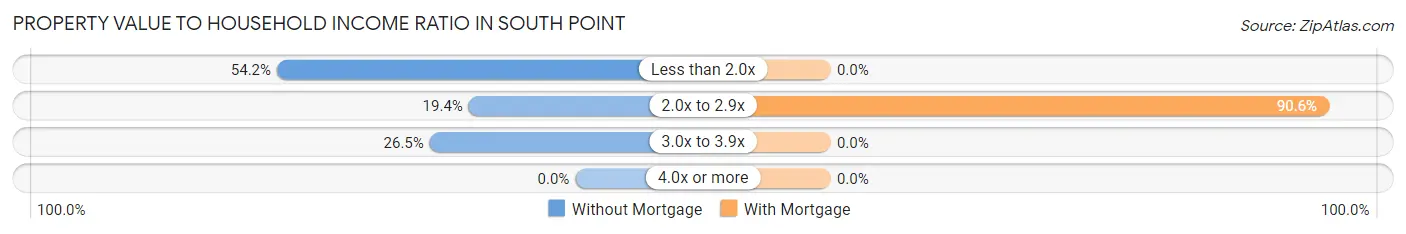
| Value-to-Income Ratio | Without Mortgage | With Mortgage |
| Less than 2.0x | 84 (54.2%) | 0 (0.0%) |
| 2.0x to 2.9x | 30 (19.4%) | 58 (90.6%) |
| 3.0x to 3.9x | 41 (26.5%) | 0 (0.0%) |
| 4.0x or more | 0 (0.0%) | 0 (0.0%) |
| Total | 155 (100.0%) | 64 (100.0%) |
Real Estate Taxes by Mortgage Status in South Point
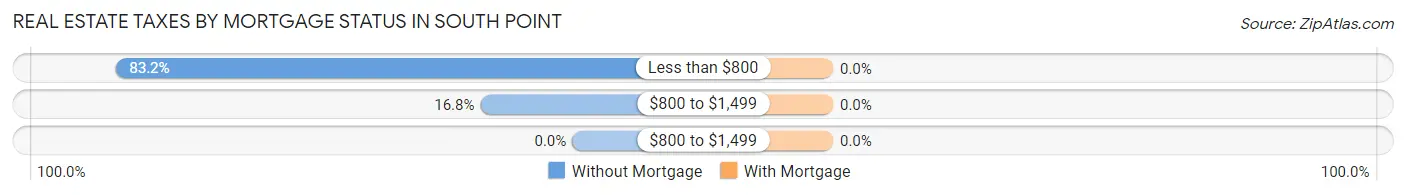
| Property Taxes | Without Mortgage | With Mortgage |
| Less than $800 | 129 (83.2%) | 0 (0.0%) |
| $800 to $1,499 | 26 (16.8%) | 0 (0.0%) |
| $800 to $1,499 | 0 (0.0%) | 0 (0.0%) |
| Total | 155 (100.0%) | 64 (100.0%) |
Health & Disability in South Point
Health Insurance Coverage by Age in South Point
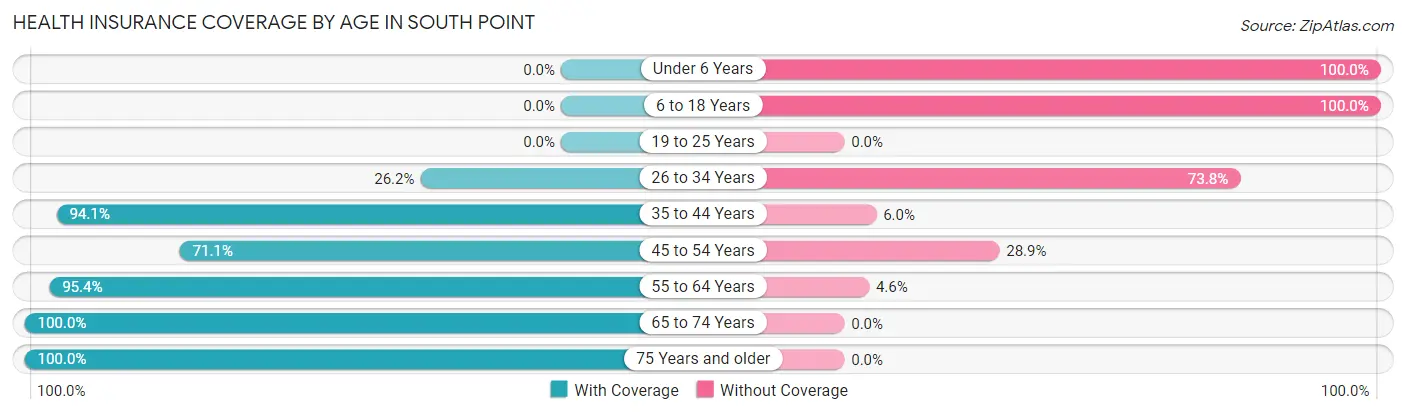
| Age Bracket | With Coverage | Without Coverage |
| Under 6 Years | 0 (0.0%) | 32 (100.0%) |
| 6 to 18 Years | 0 (0.0%) | 16 (100.0%) |
| 19 to 25 Years | 0 (0.0%) | 0 (0.0%) |
| 26 to 34 Years | 27 (26.2%) | 76 (73.8%) |
| 35 to 44 Years | 79 (94.1%) | 5 (5.9%) |
| 45 to 54 Years | 91 (71.1%) | 37 (28.9%) |
| 55 to 64 Years | 83 (95.4%) | 4 (4.6%) |
| 65 to 74 Years | 173 (100.0%) | 0 (0.0%) |
| 75 Years and older | 47 (100.0%) | 0 (0.0%) |
| Total | 500 (74.6%) | 170 (25.4%) |
Health Insurance Coverage by Citizenship Status in South Point
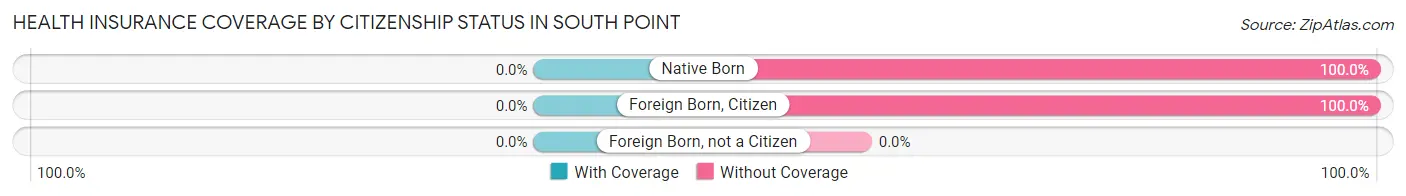
| Citizenship Status | With Coverage | Without Coverage |
| Native Born | 0 (0.0%) | 32 (100.0%) |
| Foreign Born, Citizen | 0 (0.0%) | 16 (100.0%) |
| Foreign Born, not a Citizen | 0 (0.0%) | 0 (0.0%) |
Health Insurance Coverage by Household Income in South Point
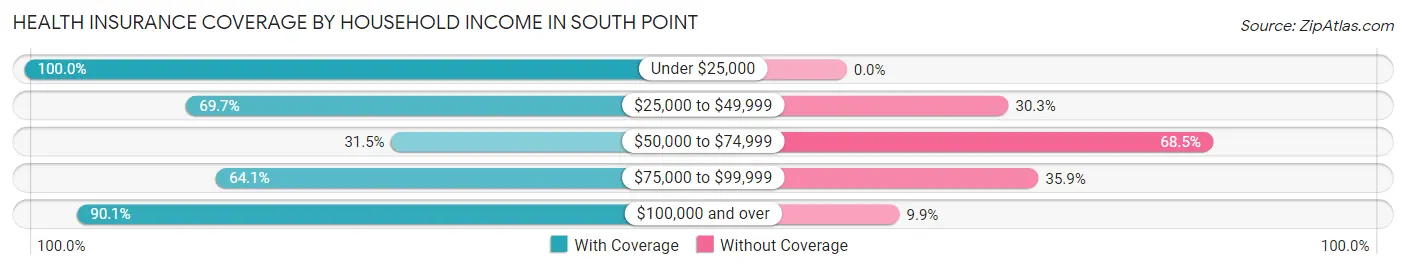
| Household Income | With Coverage | Without Coverage |
| Under $25,000 | 191 (100.0%) | 0 (0.0%) |
| $25,000 to $49,999 | 92 (69.7%) | 40 (30.3%) |
| $50,000 to $74,999 | 28 (31.5%) | 61 (68.5%) |
| $75,000 to $99,999 | 107 (64.1%) | 60 (35.9%) |
| $100,000 and over | 82 (90.1%) | 9 (9.9%) |
Public vs Private Health Insurance Coverage by Age in South Point
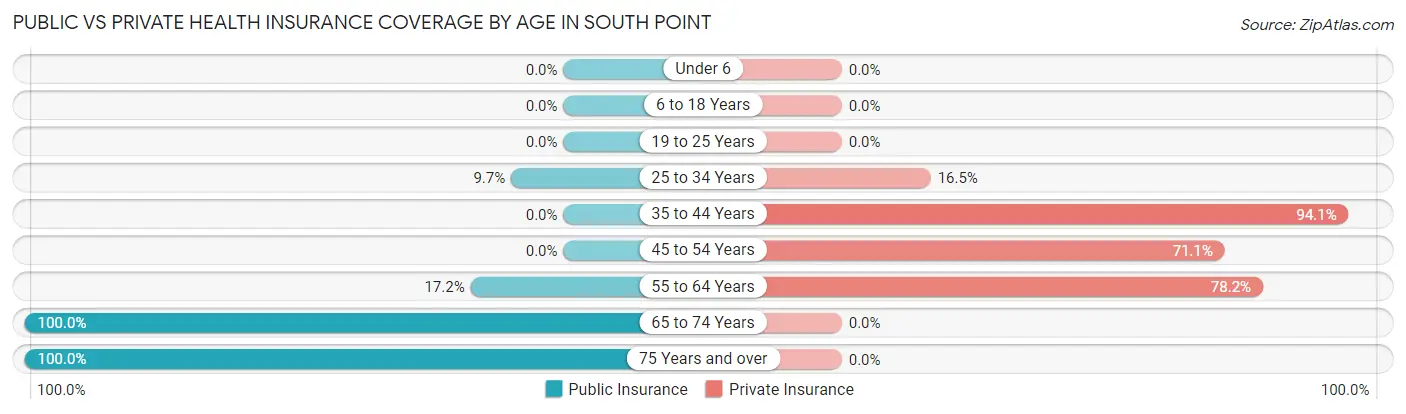
| Age Bracket | Public Insurance | Private Insurance |
| Under 6 | 0 (0.0%) | 0 (0.0%) |
| 6 to 18 Years | 0 (0.0%) | 0 (0.0%) |
| 19 to 25 Years | 0 (0.0%) | 0 (0.0%) |
| 25 to 34 Years | 10 (9.7%) | 17 (16.5%) |
| 35 to 44 Years | 0 (0.0%) | 79 (94.1%) |
| 45 to 54 Years | 0 (0.0%) | 91 (71.1%) |
| 55 to 64 Years | 15 (17.2%) | 68 (78.2%) |
| 65 to 74 Years | 173 (100.0%) | 0 (0.0%) |
| 75 Years and over | 47 (100.0%) | 0 (0.0%) |
| Total | 245 (36.6%) | 255 (38.1%) |
Disability Status by Sex by Age in South Point
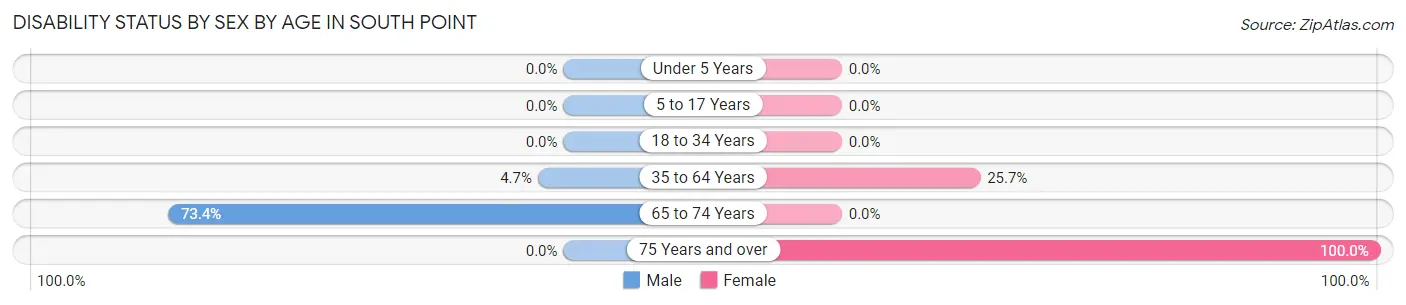
| Age Bracket | Male | Female |
| Under 5 Years | 0 (0.0%) | 0 (0.0%) |
| 5 to 17 Years | 0 (0.0%) | 0 (0.0%) |
| 18 to 34 Years | 0 (0.0%) | 0 (0.0%) |
| 35 to 64 Years | 9 (4.7%) | 28 (25.7%) |
| 65 to 74 Years | 80 (73.4%) | 0 (0.0%) |
| 75 Years and over | 0 (0.0%) | 47 (100.0%) |
Disability Class by Sex by Age in South Point
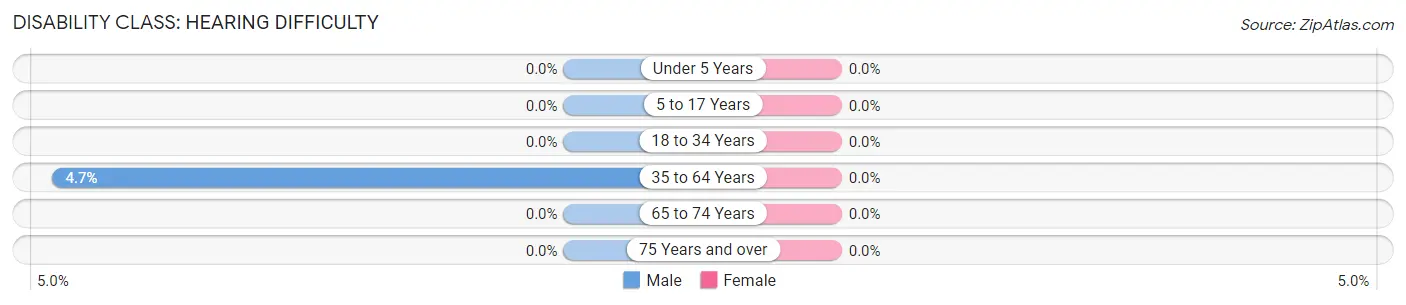
Disability Class: Hearing Difficulty
| Age Bracket | Male | Female |
| Under 5 Years | 0 (0.0%) | 0 (0.0%) |
| 5 to 17 Years | 0 (0.0%) | 0 (0.0%) |
| 18 to 34 Years | 0 (0.0%) | 0 (0.0%) |
| 35 to 64 Years | 9 (4.7%) | 0 (0.0%) |
| 65 to 74 Years | 0 (0.0%) | 0 (0.0%) |
| 75 Years and over | 0 (0.0%) | 0 (0.0%) |
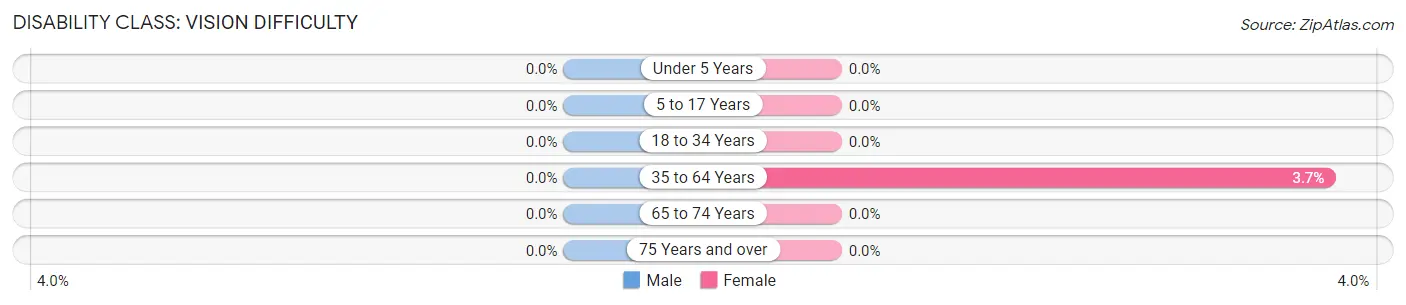
Disability Class: Vision Difficulty
| Age Bracket | Male | Female |
| Under 5 Years | 0 (0.0%) | 0 (0.0%) |
| 5 to 17 Years | 0 (0.0%) | 0 (0.0%) |
| 18 to 34 Years | 0 (0.0%) | 0 (0.0%) |
| 35 to 64 Years | 0 (0.0%) | 4 (3.7%) |
| 65 to 74 Years | 0 (0.0%) | 0 (0.0%) |
| 75 Years and over | 0 (0.0%) | 0 (0.0%) |
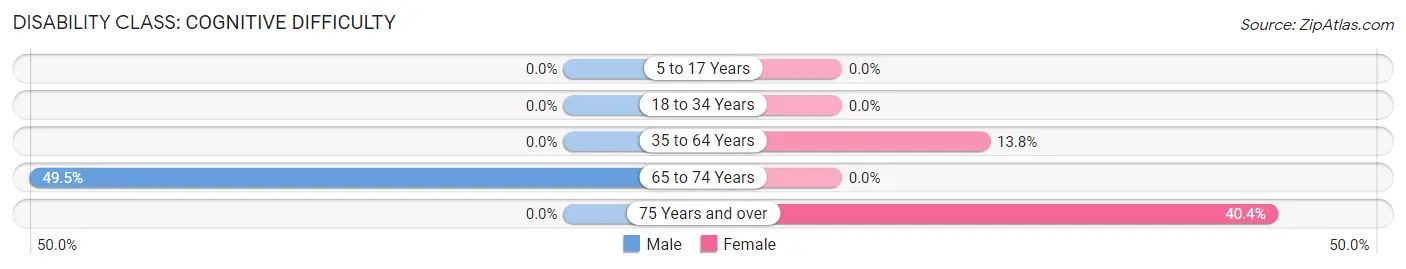
Disability Class: Cognitive Difficulty
| Age Bracket | Male | Female |
| 5 to 17 Years | 0 (0.0%) | 0 (0.0%) |
| 18 to 34 Years | 0 (0.0%) | 0 (0.0%) |
| 35 to 64 Years | 0 (0.0%) | 15 (13.8%) |
| 65 to 74 Years | 54 (49.5%) | 0 (0.0%) |
| 75 Years and over | 0 (0.0%) | 19 (40.4%) |
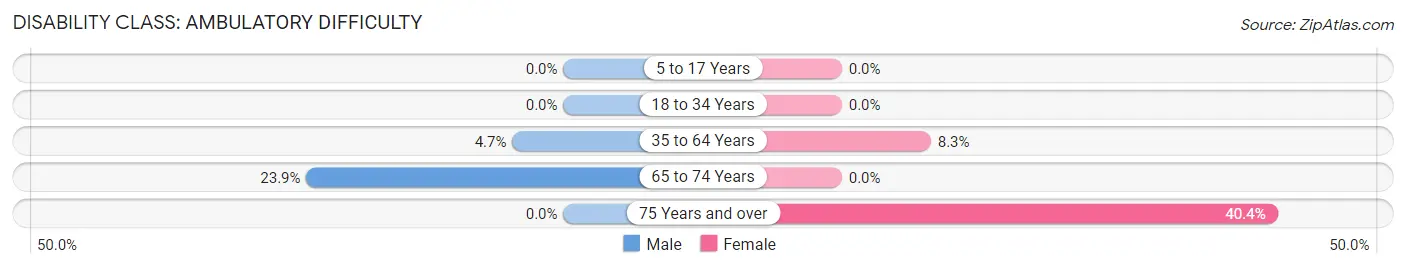
Disability Class: Ambulatory Difficulty
| Age Bracket | Male | Female |
| 5 to 17 Years | 0 (0.0%) | 0 (0.0%) |
| 18 to 34 Years | 0 (0.0%) | 0 (0.0%) |
| 35 to 64 Years | 9 (4.7%) | 9 (8.3%) |
| 65 to 74 Years | 26 (23.8%) | 0 (0.0%) |
| 75 Years and over | 0 (0.0%) | 19 (40.4%) |
Disability Class: Self-Care Difficulty
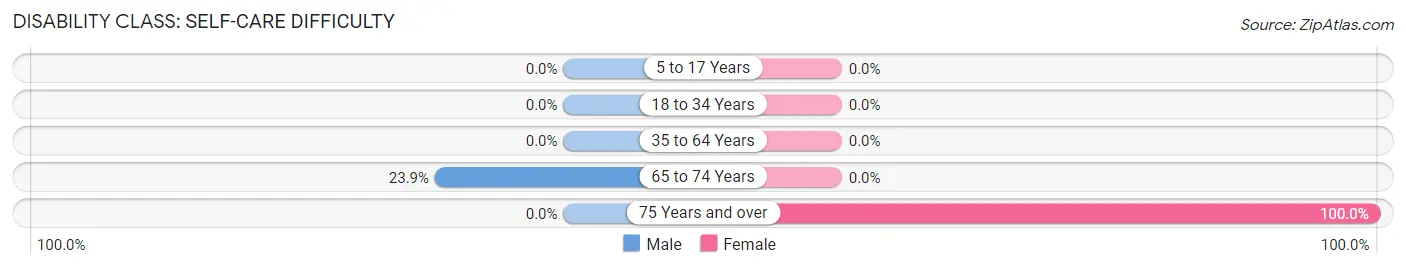
| Age Bracket | Male | Female |
| 5 to 17 Years | 0 (0.0%) | 0 (0.0%) |
| 18 to 34 Years | 0 (0.0%) | 0 (0.0%) |
| 35 to 64 Years | 0 (0.0%) | 0 (0.0%) |
| 65 to 74 Years | 26 (23.8%) | 0 (0.0%) |
| 75 Years and over | 0 (0.0%) | 47 (100.0%) |
Technology Access in South Point
Computing Device Access in South Point
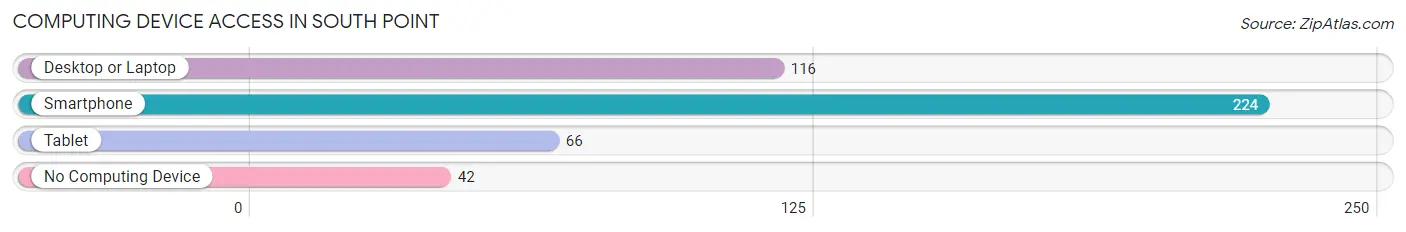
| Device Type | # Households | % Households |
| Desktop or Laptop | 116 | 43.1% |
| Smartphone | 224 | 83.3% |
| Tablet | 66 | 24.5% |
| No Computing Device | 42 | 15.6% |
| Total | 269 | 100.0% |
Internet Access in South Point
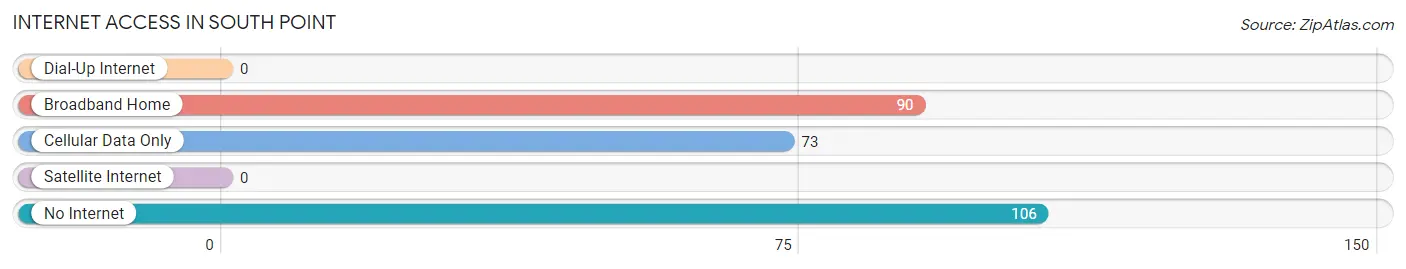
| Internet Type | # Households | % Households |
| Dial-Up Internet | 0 | 0.0% |
| Broadband Home | 90 | 33.5% |
| Cellular Data Only | 73 | 27.1% |
| Satellite Internet | 0 | 0.0% |
| No Internet | 106 | 39.4% |
| Total | 269 | 100.0% |
South Point Summary
South Point is a small unincorporated community located in the southeastern corner of Texas, in the county of Nueces. It is situated on the Gulf of Mexico, approximately 25 miles south of Corpus Christi. The population of South Point is estimated to be around 500 people.
History
South Point was first settled in the late 1800s by a group of settlers from the nearby town of Corpus Christi. The settlers were attracted to the area due to its proximity to the Gulf of Mexico and the abundance of fish and wildlife in the area. The settlers named the area South Point due to its location at the southernmost point of Nueces County.
In the early 1900s, South Point began to grow as a fishing and shrimping community. The town was home to several seafood processing plants, as well as a number of small businesses. The town also had a post office, a school, and a few churches.
In the 1950s, South Point began to experience a decline in population as many of the residents moved away to larger cities. The town was also affected by the construction of the Port of Corpus Christi, which caused the water levels in the area to drop significantly.
Geography
South Point is located in the southeastern corner of Texas, in Nueces County. It is situated on the Gulf of Mexico, approximately 25 miles south of Corpus Christi. The town is surrounded by a number of small towns and communities, including Port Aransas, Ingleside, and Aransas Pass.
The terrain of South Point is mostly flat, with some areas of marshland and wetlands. The area is also home to a number of small lakes and ponds. The climate in South Point is generally warm and humid, with temperatures ranging from the mid-70s in the summer to the mid-50s in the winter.
Economy
The economy of South Point is largely based on fishing and shrimping. The town is home to several seafood processing plants, as well as a number of small businesses. The town also has a post office, a school, and a few churches.
In recent years, South Point has become a popular tourist destination due to its proximity to the Gulf of Mexico and its abundance of wildlife. The town is home to a number of popular fishing spots, as well as a number of parks and nature preserves.
Demographics
As of the 2010 census, the population of South Point was estimated to be around 500 people. The racial makeup of the town was 94.2% White, 0.8% African American, 0.2% Native American, 0.2% Asian, and 4.4% from other races. The median household income in South Point was $37,500, and the median age was 44.5 years.
Common Questions
What is the Total Population of South Point?
Total Population of South Point is 670.
What is the Total Male Population of South Point?
Total Male Population of South Point is 373.
What is the Total Female Population of South Point?
Total Female Population of South Point is 297.
What is the Ratio of Males per 100 Females in South Point?
There are 125.59 Males per 100 Females in South Point.
What is the Ratio of Females per 100 Males in South Point?
There are 79.62 Females per 100 Males in South Point.
What is the Median Population Age in South Point?
Median Population Age in South Point is 52.7 Years.
What is the Average Family Size in South Point
Average Family Size in South Point is 2.7 People.
What is the Average Household Size in South Point
Average Household Size in South Point is 2.5 People.
What is Per Capita Income in South Point?
Per Capita income in South Point is $23,898.
What is the Median Family Income in South Point?
Median Family Income in South Point is $35,357.
What is the Median Household income in South Point?
Median Household Income in South Point is $40,703.
What is Income or Wage Gap in South Point?
Income or Wage Gap in South Point is 57.9%.
Women in South Point earn 42.1 cents for every dollar earned by a man.
What is Inequality or Gini Index in South Point?
Inequality or Gini Index in South Point is 0.43.
How Large is the Labor Force in South Point?
There are 317 People in the Labor Forcein in South Point.
What is the Percentage of People in the Labor Force in South Point?
51.0% of People are in the Labor Force in South Point.
What is the Unemployment Rate in South Point?
Unemployment Rate in South Point is 2.8%.