Zip Codes with the Highest Percentage of Population Employed in Accommodation & Food Services in Humble, TX
RELATED REPORTS & OPTIONS
Accommodation & Food Services
Humble
Compare Zip Codes
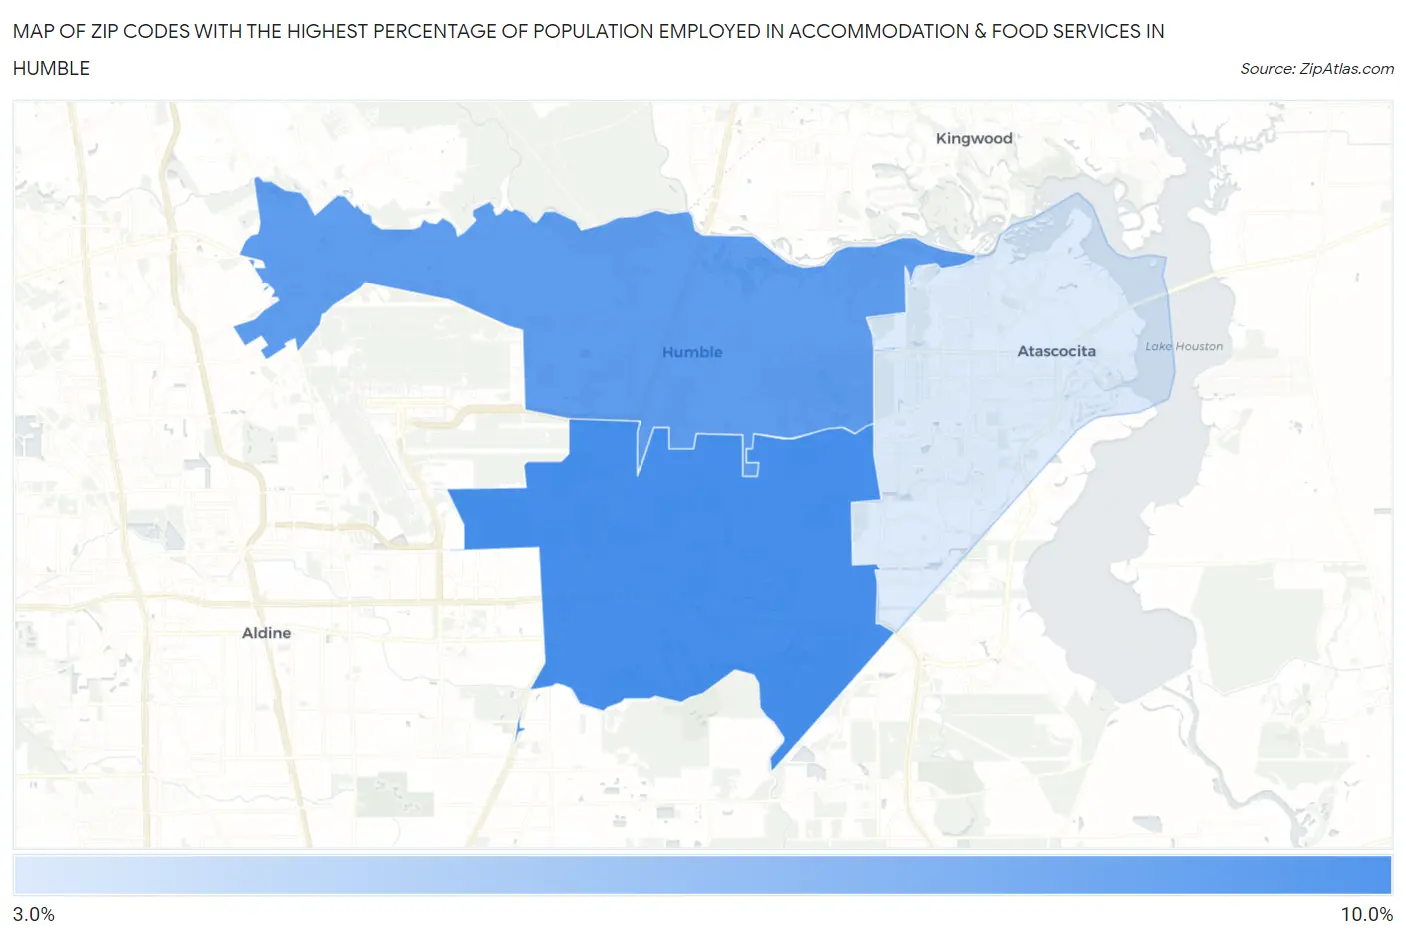
Map of Zip Codes with the Highest Percentage of Population Employed in Accommodation & Food Services in Humble
0.0%
10.0%
Zip Codes with the Highest Percentage of Population Employed in Accommodation & Food Services in Humble, TX
| Zip Code | % Employed | vs State | vs National | |
| 1. | 77396 | 8.9% | 7.2%(+1.73)#413 | 6.9%(+2.06)#6,064 |
| 2. | 77338 | 8.1% | 7.2%(+0.880)#544 | 6.9%(+1.21)#7,649 |
| 3. | 77346 | 3.6% | 7.2%(-3.57)#1,331 | 6.9%(-3.24)#21,336 |
1
Common Questions
What are the Top Zip Codes with the Highest Percentage of Population Employed in Accommodation & Food Services in Humble, TX?
Top Zip Codes with the Highest Percentage of Population Employed in Accommodation & Food Services in Humble, TX are:
What zip code has the Highest Percentage of Population Employed in Accommodation & Food Services in Humble, TX?
77396 has the Highest Percentage of Population Employed in Accommodation & Food Services in Humble, TX with 8.9%.
What is the Percentage of Population Employed in Accommodation & Food Services in Humble, TX?
Percentage of Population Employed in Accommodation & Food Services in Humble is 3.9%.
What is the Percentage of Population Employed in Accommodation & Food Services in Texas?
Percentage of Population Employed in Accommodation & Food Services in Texas is 7.2%.
What is the Percentage of Population Employed in Accommodation & Food Services in the United States?
Percentage of Population Employed in Accommodation & Food Services in the United States is 6.9%.