Zip Codes with the Highest Percentage of Population Employed in Accommodation & Food Services in Baytown, TX
RELATED REPORTS & OPTIONS
Accommodation & Food Services
Baytown
Compare Zip Codes
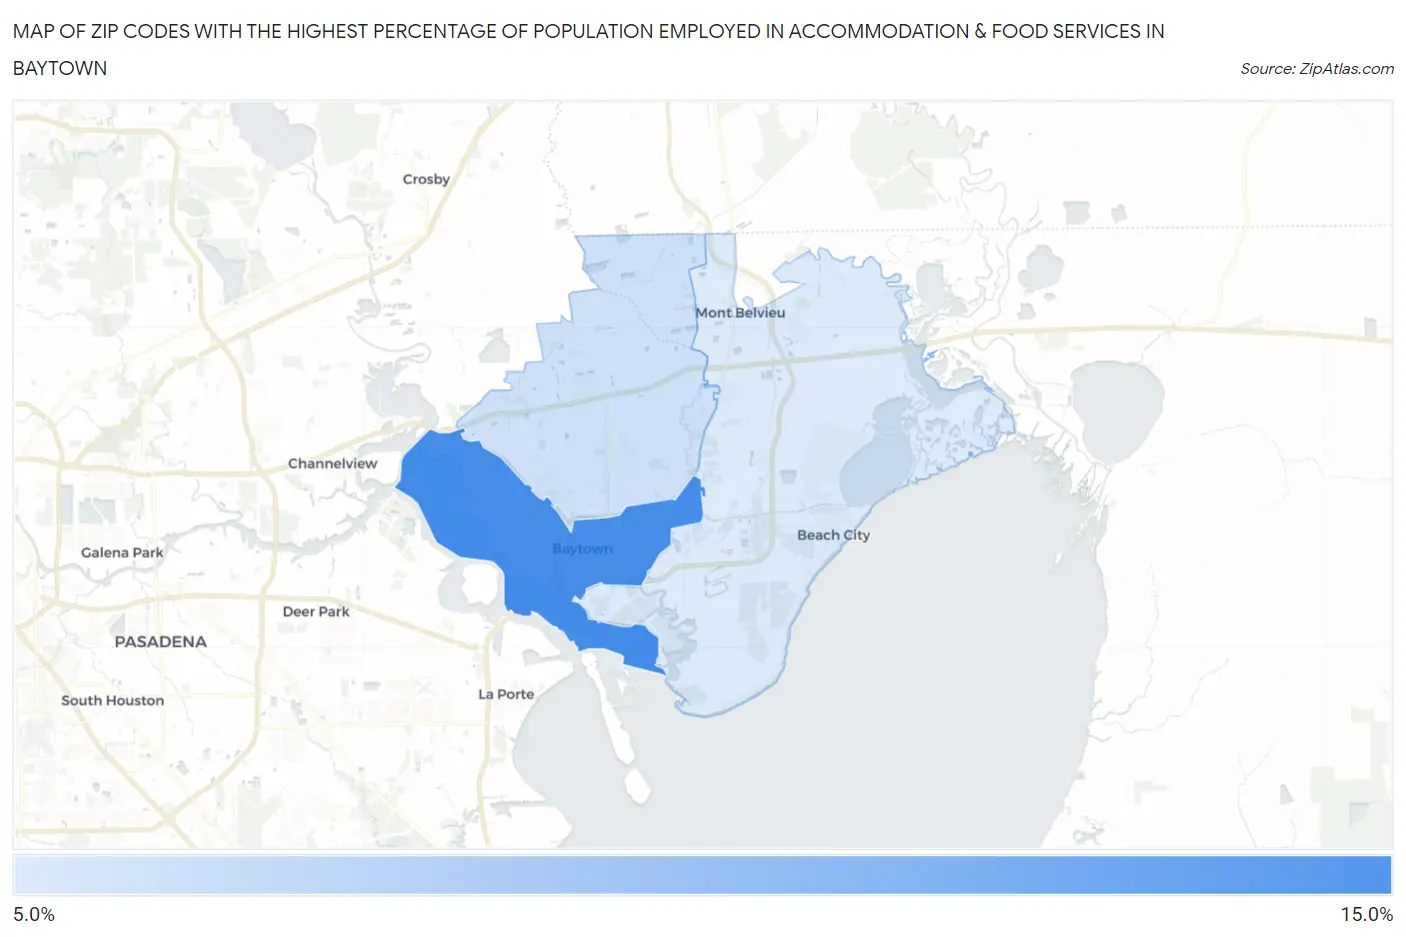
Map of Zip Codes with the Highest Percentage of Population Employed in Accommodation & Food Services in Baytown
0.0%
15.0%
Zip Codes with the Highest Percentage of Population Employed in Accommodation & Food Services in Baytown, TX
| Zip Code | % Employed | vs State | vs National | |
| 1. | 77520 | 11.5% | 7.2%(+4.27)#191 | 6.9%(+4.60)#3,176 |
| 2. | 77521 | 8.9% | 7.2%(+1.66)#422 | 6.9%(+1.98)#6,176 |
| 3. | 77523 | 8.6% | 7.2%(+1.39)#455 | 6.9%(+1.71)#6,657 |
1
Common Questions
What are the Top Zip Codes with the Highest Percentage of Population Employed in Accommodation & Food Services in Baytown, TX?
Top Zip Codes with the Highest Percentage of Population Employed in Accommodation & Food Services in Baytown, TX are:
What zip code has the Highest Percentage of Population Employed in Accommodation & Food Services in Baytown, TX?
77520 has the Highest Percentage of Population Employed in Accommodation & Food Services in Baytown, TX with 11.5%.
What is the Percentage of Population Employed in Accommodation & Food Services in Baytown, TX?
Percentage of Population Employed in Accommodation & Food Services in Baytown is 10.0%.
What is the Percentage of Population Employed in Accommodation & Food Services in Texas?
Percentage of Population Employed in Accommodation & Food Services in Texas is 7.2%.
What is the Percentage of Population Employed in Accommodation & Food Services in the United States?
Percentage of Population Employed in Accommodation & Food Services in the United States is 6.9%.