Zip Codes with the Highest Percentage of Population Employed in Accommodation & Food Services in Bedford, TX
RELATED REPORTS & OPTIONS
Accommodation & Food Services
Bedford
Compare Zip Codes
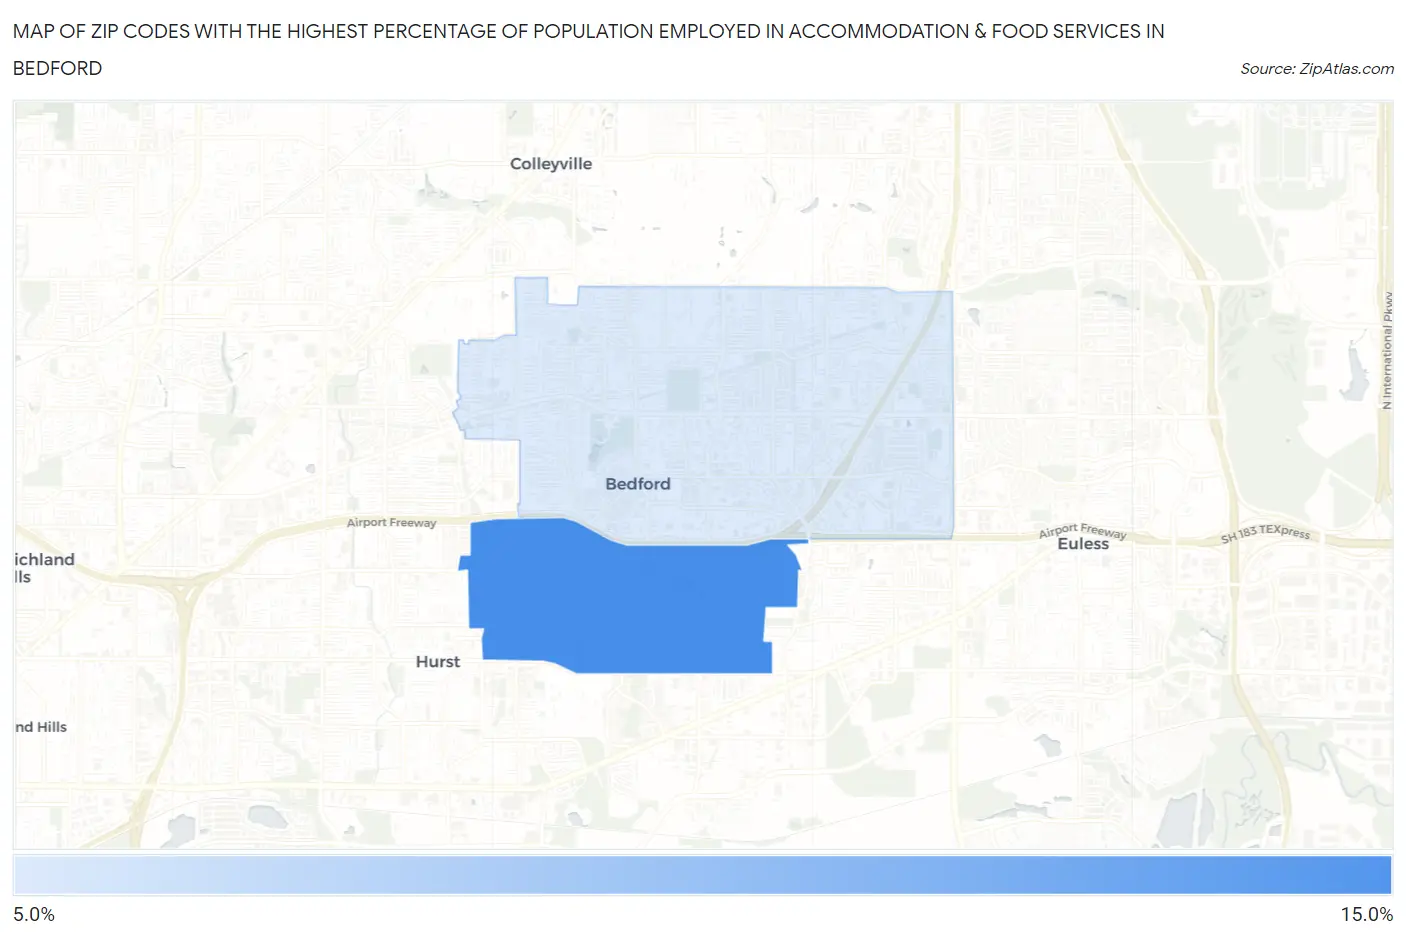
Map of Zip Codes with the Highest Percentage of Population Employed in Accommodation & Food Services in Bedford
0.0%
15.0%
Zip Codes with the Highest Percentage of Population Employed in Accommodation & Food Services in Bedford, TX
| Zip Code | % Employed | vs State | vs National | |
| 1. | 76022 | 11.3% | 7.2%(+4.05)#197 | 6.9%(+4.38)#3,353 |
| 2. | 76021 | 8.6% | 7.2%(+1.36)#460 | 6.9%(+1.68)#6,708 |
1
Common Questions
What are the Top Zip Codes with the Highest Percentage of Population Employed in Accommodation & Food Services in Bedford, TX?
Top Zip Codes with the Highest Percentage of Population Employed in Accommodation & Food Services in Bedford, TX are:
What zip code has the Highest Percentage of Population Employed in Accommodation & Food Services in Bedford, TX?
76022 has the Highest Percentage of Population Employed in Accommodation & Food Services in Bedford, TX with 11.3%.
What is the Percentage of Population Employed in Accommodation & Food Services in Bedford, TX?
Percentage of Population Employed in Accommodation & Food Services in Bedford is 9.3%.
What is the Percentage of Population Employed in Accommodation & Food Services in Texas?
Percentage of Population Employed in Accommodation & Food Services in Texas is 7.2%.
What is the Percentage of Population Employed in Accommodation & Food Services in the United States?
Percentage of Population Employed in Accommodation & Food Services in the United States is 6.9%.