Cities with the Highest Percentage of Population Employed in Accommodation & Food Services in Pennsylvania
RELATED REPORTS & OPTIONS
Accommodation & Food Services
Pennsylvania
Compare Cities
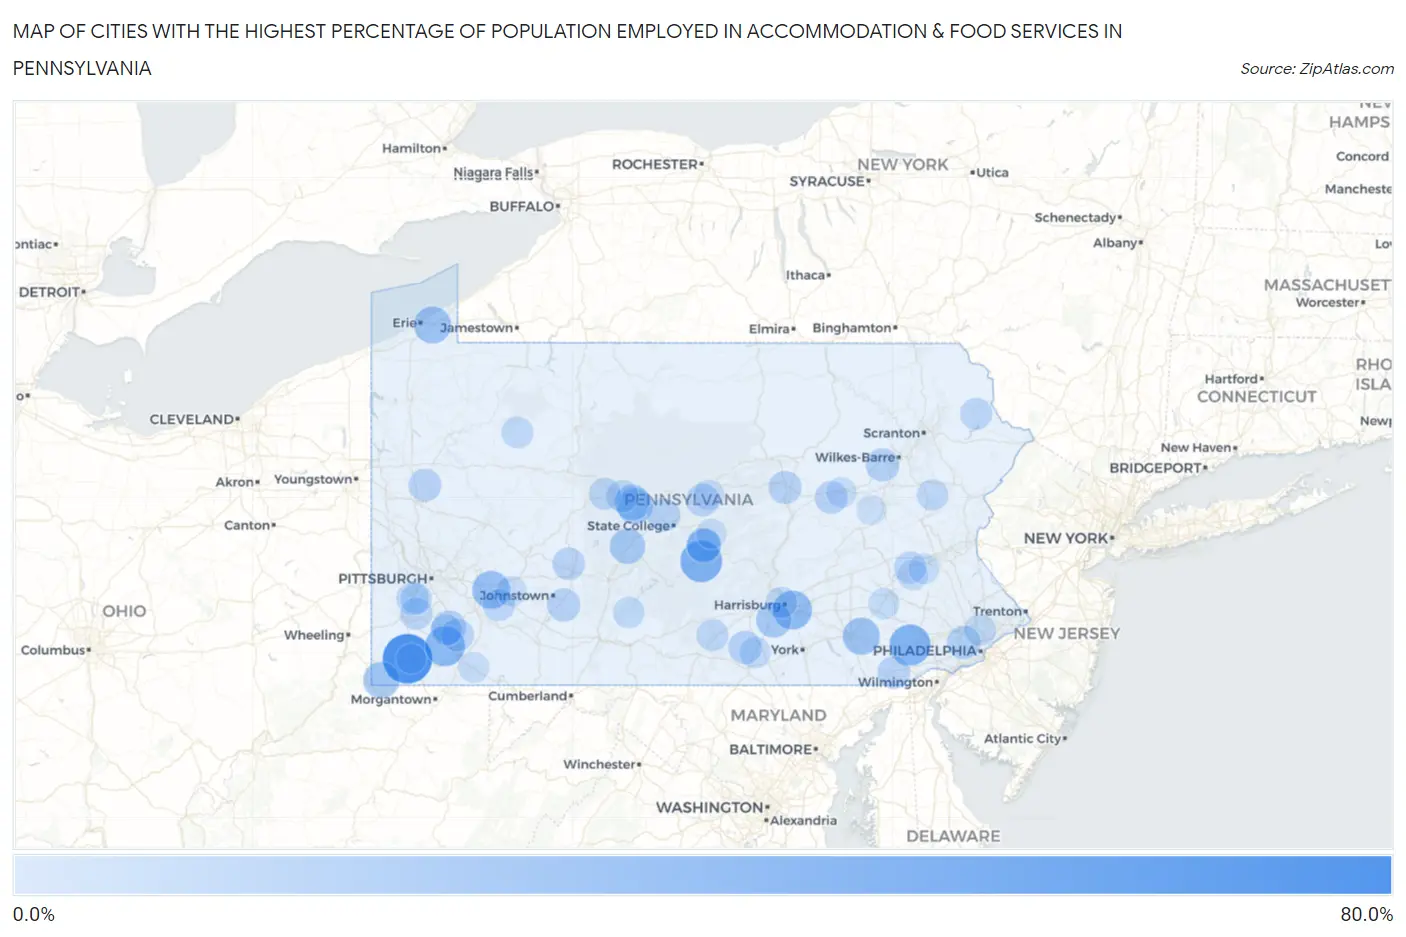
Map of Cities with the Highest Percentage of Population Employed in Accommodation & Food Services in Pennsylvania
0.0%
80.0%
Cities with the Highest Percentage of Population Employed in Accommodation & Food Services in Pennsylvania
| City | % Employed | vs State | vs National | |
| 1. | West Waynesburg | 64.5% | 5.9%(+58.6)#1 | 6.9%(+57.6)#70 |
| 2. | Aaronsburg Cdp Washington County | 63.6% | 5.9%(+57.7)#2 | 6.9%(+56.8)#72 |
| 3. | Seven Springs Borough | 62.5% | 5.9%(+56.6)#3 | 6.9%(+55.6)#79 |
| 4. | Milford Borough | 54.0% | 5.9%(+48.1)#4 | 6.9%(+47.1)#122 |
| 5. | Glasgow Borough | 46.9% | 5.9%(+41.0)#5 | 6.9%(+40.1)#194 |
| 6. | Granville | 44.3% | 5.9%(+38.4)#6 | 6.9%(+37.4)#222 |
| 7. | Caln | 42.7% | 5.9%(+36.8)#7 | 6.9%(+35.8)#240 |
| 8. | Allison | 39.8% | 5.9%(+34.0)#8 | 6.9%(+33.0)#268 |
| 9. | Bressler | 37.5% | 5.9%(+31.6)#9 | 6.9%(+30.6)#300 |
| 10. | Blue Knob | 37.5% | 5.9%(+31.6)#10 | 6.9%(+30.6)#302 |
| 11. | Cove Forge | 36.5% | 5.9%(+30.6)#11 | 6.9%(+29.6)#324 |
| 12. | Shellytown | 35.3% | 5.9%(+29.4)#12 | 6.9%(+28.4)#348 |
| 13. | Crabtree | 34.7% | 5.9%(+28.8)#13 | 6.9%(+27.8)#360 |
| 14. | Beavertown | 33.3% | 5.9%(+27.4)#14 | 6.9%(+26.5)#391 |
| 15. | Witmer | 32.4% | 5.9%(+26.5)#15 | 6.9%(+25.6)#413 |
| 16. | Penn State Erie Behrend | 32.3% | 5.9%(+26.4)#16 | 6.9%(+25.4)#415 |
| 17. | Misericordia University | 30.5% | 5.9%(+24.6)#17 | 6.9%(+23.6)#468 |
| 18. | New Freeport | 30.4% | 5.9%(+24.5)#18 | 6.9%(+23.6)#472 |
| 19. | Hawk Run | 29.1% | 5.9%(+23.2)#19 | 6.9%(+22.2)#511 |
| 20. | Morrisdale | 28.9% | 5.9%(+23.0)#20 | 6.9%(+22.0)#517 |
| 21. | Grazierville | 28.5% | 5.9%(+22.6)#21 | 6.9%(+21.7)#542 |
| 22. | Messiah College | 28.2% | 5.9%(+22.3)#22 | 6.9%(+21.3)#550 |
| 23. | Clarksville Borough | 27.3% | 5.9%(+21.4)#23 | 6.9%(+20.4)#598 |
| 24. | Lumber City | 26.0% | 5.9%(+20.1)#24 | 6.9%(+19.1)#674 |
| 25. | Hawley Borough | 25.7% | 5.9%(+19.8)#25 | 6.9%(+18.8)#692 |
| 26. | Fairhope | 25.2% | 5.9%(+19.4)#26 | 6.9%(+18.4)#714 |
| 27. | Reedsville | 24.8% | 5.9%(+18.9)#27 | 6.9%(+17.9)#754 |
| 28. | Eagleville Cdp Centre County | 24.5% | 5.9%(+18.6)#28 | 6.9%(+17.6)#771 |
| 29. | Haysville Borough | 24.5% | 5.9%(+18.6)#29 | 6.9%(+17.6)#773 |
| 30. | Haverford College | 23.9% | 5.9%(+18.0)#30 | 6.9%(+17.0)#826 |
| 31. | Shelocta Borough | 23.8% | 5.9%(+17.9)#31 | 6.9%(+16.9)#834 |
| 32. | Aspers | 23.4% | 5.9%(+17.5)#32 | 6.9%(+16.5)#865 |
| 33. | Sheatown | 23.0% | 5.9%(+17.2)#33 | 6.9%(+16.2)#905 |
| 34. | University Of Pittsburgh Johnstown | 23.0% | 5.9%(+17.1)#34 | 6.9%(+16.1)#910 |
| 35. | New Columbia | 22.7% | 5.9%(+16.9)#35 | 6.9%(+15.9)#930 |
| 36. | Little Meadows Borough | 22.3% | 5.9%(+16.4)#36 | 6.9%(+15.4)#964 |
| 37. | Manorville Borough | 22.3% | 5.9%(+16.4)#37 | 6.9%(+15.4)#969 |
| 38. | Julian | 22.2% | 5.9%(+16.3)#38 | 6.9%(+15.3)#977 |
| 39. | Hublersburg | 22.1% | 5.9%(+16.2)#39 | 6.9%(+15.2)#1,008 |
| 40. | Star Junction | 22.0% | 5.9%(+16.1)#40 | 6.9%(+15.1)#1,012 |
| 41. | Rupert | 21.8% | 5.9%(+15.9)#41 | 6.9%(+14.9)#1,030 |
| 42. | Slippery Rock University | 21.8% | 5.9%(+15.9)#42 | 6.9%(+14.9)#1,034 |
| 43. | Colver | 21.6% | 5.9%(+15.7)#43 | 6.9%(+14.7)#1,051 |
| 44. | Lincoln University | 21.5% | 5.9%(+15.7)#44 | 6.9%(+14.7)#1,053 |
| 45. | Indiana Borough | 21.5% | 5.9%(+15.6)#45 | 6.9%(+14.6)#1,056 |
| 46. | Hendersonville | 20.9% | 5.9%(+15.0)#46 | 6.9%(+14.0)#1,132 |
| 47. | Hostetter | 20.9% | 5.9%(+15.0)#47 | 6.9%(+14.0)#1,133 |
| 48. | Wylandville | 20.6% | 5.9%(+14.7)#48 | 6.9%(+13.7)#1,164 |
| 49. | Kutztown University | 20.5% | 5.9%(+14.6)#49 | 6.9%(+13.6)#1,188 |
| 50. | Bigler | 20.4% | 5.9%(+14.5)#50 | 6.9%(+13.5)#1,198 |
| 51. | Hyde | 20.3% | 5.9%(+14.4)#51 | 6.9%(+13.4)#1,212 |
| 52. | Shippensburg University | 20.0% | 5.9%(+14.1)#52 | 6.9%(+13.1)#1,235 |
| 53. | Penn State Berks | 19.9% | 5.9%(+14.1)#53 | 6.9%(+13.1)#1,264 |
| 54. | White Mills | 19.9% | 5.9%(+14.0)#54 | 6.9%(+13.0)#1,270 |
| 55. | Arcadia University | 19.6% | 5.9%(+13.7)#55 | 6.9%(+12.7)#1,310 |
| 56. | Millbourne Borough | 19.4% | 5.9%(+13.5)#56 | 6.9%(+12.5)#1,338 |
| 57. | West Fairview | 19.4% | 5.9%(+13.5)#57 | 6.9%(+12.5)#1,344 |
| 58. | Vowinckel | 19.4% | 5.9%(+13.5)#58 | 6.9%(+12.5)#1,349 |
| 59. | Towamensing Trails | 19.3% | 5.9%(+13.4)#59 | 6.9%(+12.4)#1,367 |
| 60. | Allenport | 19.0% | 5.9%(+13.1)#60 | 6.9%(+12.1)#1,417 |
| 61. | Woodcock Borough | 18.8% | 5.9%(+12.9)#61 | 6.9%(+11.9)#1,463 |
| 62. | Finleyville Borough | 18.7% | 5.9%(+12.8)#62 | 6.9%(+11.8)#1,468 |
| 63. | Stonerstown | 18.6% | 5.9%(+12.8)#63 | 6.9%(+11.8)#1,486 |
| 64. | Lawrence | 18.5% | 5.9%(+12.7)#64 | 6.9%(+11.7)#1,504 |
| 65. | Heidlersburg | 18.5% | 5.9%(+12.6)#65 | 6.9%(+11.7)#1,506 |
| 66. | Chester Hill Borough | 18.1% | 5.9%(+12.2)#66 | 6.9%(+11.2)#1,608 |
| 67. | Meyersdale Borough | 18.0% | 5.9%(+12.1)#67 | 6.9%(+11.1)#1,618 |
| 68. | Millvale Borough | 18.0% | 5.9%(+12.1)#68 | 6.9%(+11.1)#1,628 |
| 69. | Bedford Borough | 18.0% | 5.9%(+12.1)#69 | 6.9%(+11.1)#1,632 |
| 70. | Volant Borough | 17.8% | 5.9%(+11.9)#70 | 6.9%(+10.9)#1,665 |
| 71. | Gouglersville | 17.7% | 5.9%(+11.9)#71 | 6.9%(+10.9)#1,671 |
| 72. | East Lansdowne Borough | 17.7% | 5.9%(+11.8)#72 | 6.9%(+10.8)#1,689 |
| 73. | Wattsburg Borough | 17.3% | 5.9%(+11.4)#73 | 6.9%(+10.4)#1,772 |
| 74. | Dryville | 17.2% | 5.9%(+11.4)#74 | 6.9%(+10.4)#1,778 |
| 75. | Adamsburg Borough | 17.2% | 5.9%(+11.3)#75 | 6.9%(+10.3)#1,793 |
| 76. | Millwood | 17.2% | 5.9%(+11.3)#76 | 6.9%(+10.3)#1,795 |
| 77. | Chalkhill | 17.1% | 5.9%(+11.3)#77 | 6.9%(+10.3)#1,802 |
| 78. | Rainsburg Borough | 17.0% | 5.9%(+11.1)#78 | 6.9%(+10.1)#1,840 |
| 79. | Upland Borough | 16.9% | 5.9%(+11.0)#79 | 6.9%(+10.0)#1,854 |
| 80. | Valley View Cdp York County | 16.9% | 5.9%(+11.0)#80 | 6.9%(+10.0)#1,855 |
| 81. | Nittany | 16.8% | 5.9%(+11.0)#81 | 6.9%(+9.97)#1,867 |
| 82. | Almedia | 16.8% | 5.9%(+10.9)#82 | 6.9%(+9.95)#1,872 |
| 83. | Stoystown Borough | 16.7% | 5.9%(+10.9)#83 | 6.9%(+9.87)#1,887 |
| 84. | Dale Borough | 16.7% | 5.9%(+10.8)#84 | 6.9%(+9.79)#1,898 |
| 85. | Darlington Borough | 16.7% | 5.9%(+10.8)#85 | 6.9%(+9.79)#1,903 |
| 86. | East Washington Borough | 16.6% | 5.9%(+10.7)#86 | 6.9%(+9.72)#1,930 |
| 87. | Mertztown | 16.5% | 5.9%(+10.6)#87 | 6.9%(+9.62)#1,954 |
| 88. | Mount Oliver Borough | 16.5% | 5.9%(+10.6)#88 | 6.9%(+9.57)#1,967 |
| 89. | White Haven Borough | 16.3% | 5.9%(+10.4)#89 | 6.9%(+9.45)#1,990 |
| 90. | Markleysburg Borough | 16.2% | 5.9%(+10.3)#90 | 6.9%(+9.28)#2,045 |
| 91. | Wesleyville Borough | 16.1% | 5.9%(+10.2)#91 | 6.9%(+9.23)#2,067 |
| 92. | Elizabeth Borough | 16.0% | 5.9%(+10.1)#92 | 6.9%(+9.13)#2,095 |
| 93. | Etna Borough | 16.0% | 5.9%(+10.1)#93 | 6.9%(+9.11)#2,104 |
| 94. | Siglerville | 15.9% | 5.9%(+10.0)#94 | 6.9%(+9.03)#2,134 |
| 95. | Smicksburg Borough | 15.8% | 5.9%(+9.90)#95 | 6.9%(+8.91)#2,173 |
| 96. | Hooversville Borough | 15.6% | 5.9%(+9.74)#96 | 6.9%(+8.75)#2,218 |
| 97. | Modena Borough | 15.5% | 5.9%(+9.63)#97 | 6.9%(+8.64)#2,266 |
| 98. | Sheppton | 15.4% | 5.9%(+9.50)#98 | 6.9%(+8.50)#2,301 |
| 99. | Morrisville | 15.3% | 5.9%(+9.46)#99 | 6.9%(+8.47)#2,316 |
| 100. | Dupont Borough | 15.2% | 5.9%(+9.33)#100 | 6.9%(+8.34)#2,347 |
Common Questions
What are the Top 10 Cities with the Highest Percentage of Population Employed in Accommodation & Food Services in Pennsylvania?
Top 10 Cities with the Highest Percentage of Population Employed in Accommodation & Food Services in Pennsylvania are:
#1
64.5%
#2
44.3%
#3
42.7%
#4
39.8%
#5
37.5%
#6
34.7%
#7
32.4%
#8
32.3%
#9
30.4%
#10
29.1%
What city has the Highest Percentage of Population Employed in Accommodation & Food Services in Pennsylvania?
West Waynesburg has the Highest Percentage of Population Employed in Accommodation & Food Services in Pennsylvania with 64.5%.
What is the Percentage of Population Employed in Accommodation & Food Services in the State of Pennsylvania?
Percentage of Population Employed in Accommodation & Food Services in Pennsylvania is 5.9%.
What is the Percentage of Population Employed in Accommodation & Food Services in the United States?
Percentage of Population Employed in Accommodation & Food Services in the United States is 6.9%.