Zip Codes with the Highest Percentage of Population Employed in Accommodation & Food Services in Lancaster, TX
RELATED REPORTS & OPTIONS
Accommodation & Food Services
Lancaster
Compare Zip Codes
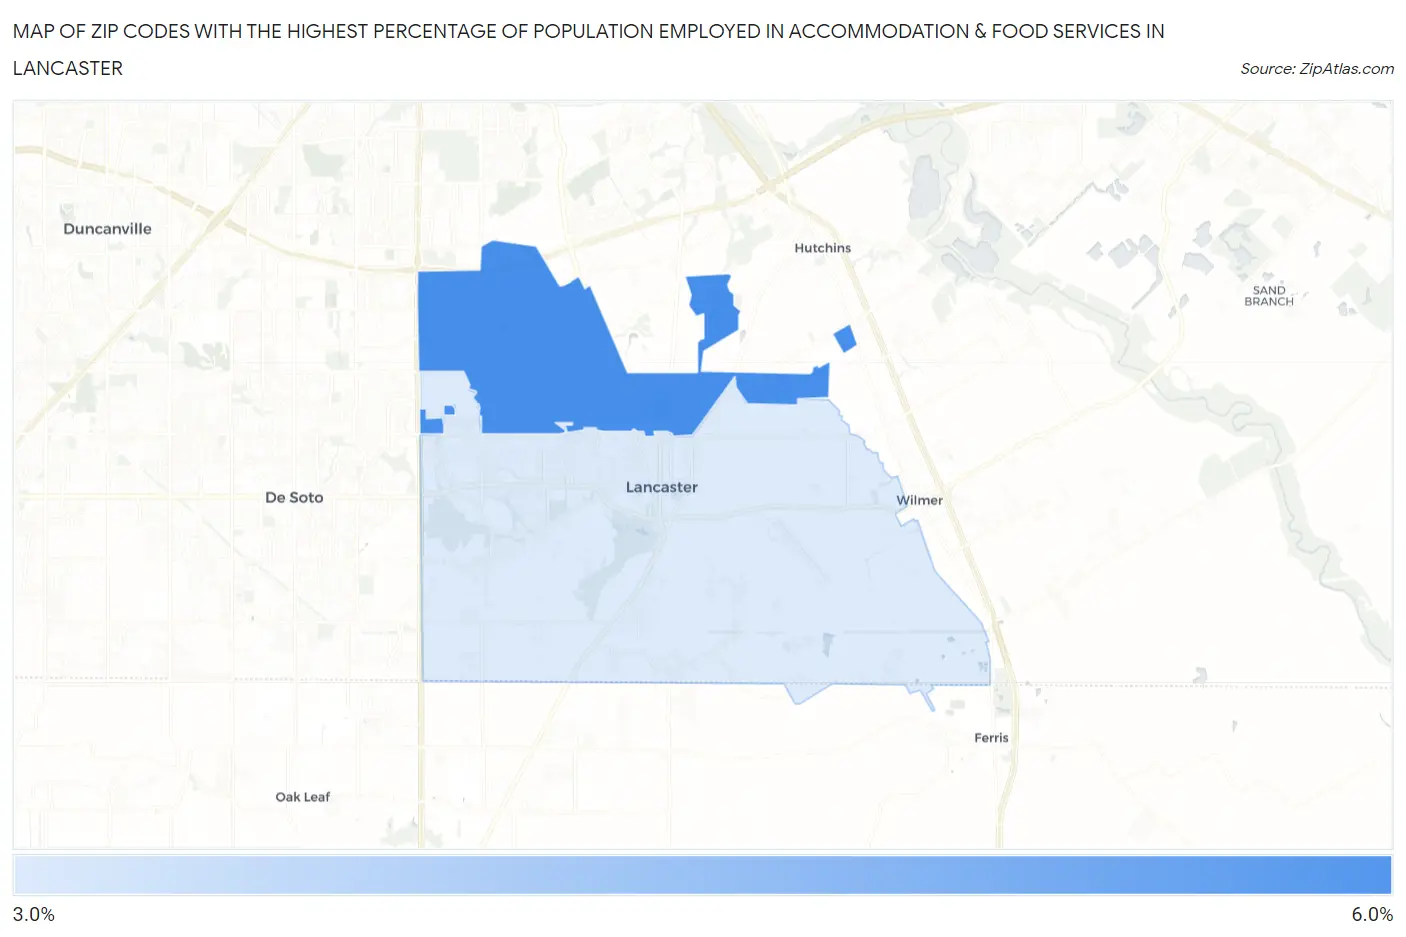
Map of Zip Codes with the Highest Percentage of Population Employed in Accommodation & Food Services in Lancaster
0.0%
6.0%
Zip Codes with the Highest Percentage of Population Employed in Accommodation & Food Services in Lancaster, TX
| Zip Code | % Employed | vs State | vs National | |
| 1. | 75134 | 5.0% | 7.2%(-2.16)#1,079 | 6.9%(-1.83)#16,659 |
| 2. | 75146 | 3.9% | 7.2%(-3.33)#1,287 | 6.9%(-3.01)#20,562 |
1
Common Questions
What are the Top Zip Codes with the Highest Percentage of Population Employed in Accommodation & Food Services in Lancaster, TX?
Top Zip Codes with the Highest Percentage of Population Employed in Accommodation & Food Services in Lancaster, TX are:
What zip code has the Highest Percentage of Population Employed in Accommodation & Food Services in Lancaster, TX?
75134 has the Highest Percentage of Population Employed in Accommodation & Food Services in Lancaster, TX with 5.0%.
What is the Percentage of Population Employed in Accommodation & Food Services in Lancaster, TX?
Percentage of Population Employed in Accommodation & Food Services in Lancaster is 4.8%.
What is the Percentage of Population Employed in Accommodation & Food Services in Texas?
Percentage of Population Employed in Accommodation & Food Services in Texas is 7.2%.
What is the Percentage of Population Employed in Accommodation & Food Services in the United States?
Percentage of Population Employed in Accommodation & Food Services in the United States is 6.9%.