Zip Codes with the Highest Percentage of Population Employed in Accommodation & Food Services in Waxahachie, TX
RELATED REPORTS & OPTIONS
Accommodation & Food Services
Waxahachie
Compare Zip Codes
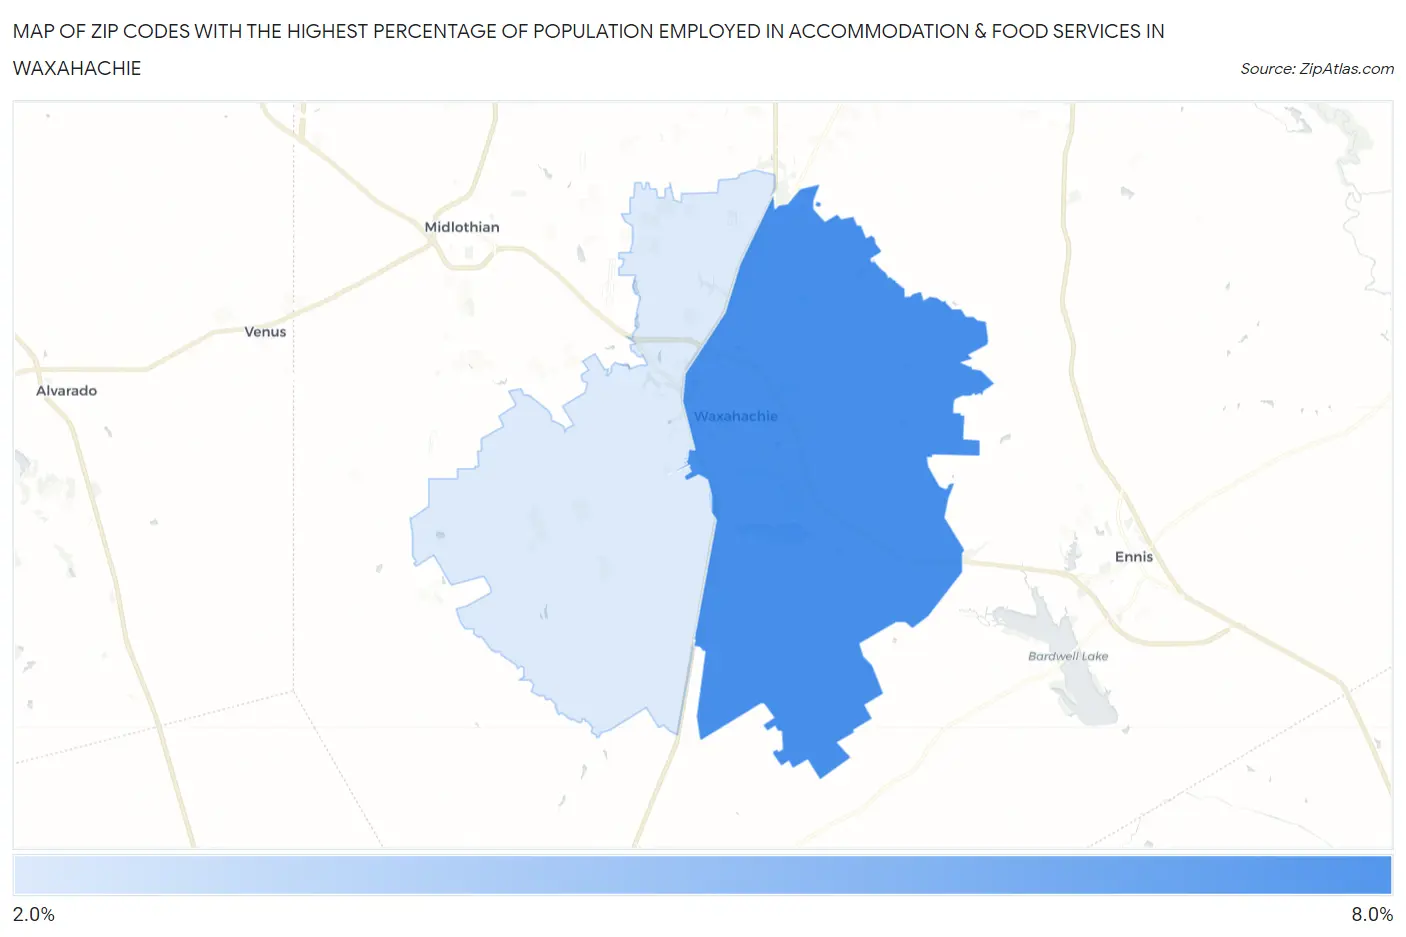
Map of Zip Codes with the Highest Percentage of Population Employed in Accommodation & Food Services in Waxahachie
0.0%
8.0%
Zip Codes with the Highest Percentage of Population Employed in Accommodation & Food Services in Waxahachie, TX
| Zip Code | % Employed | vs State | vs National | |
| 1. | 75165 | 6.4% | 7.2%(-0.763)#832 | 6.9%(-0.438)#12,024 |
| 2. | 75167 | 2.5% | 7.2%(-4.69)#1,482 | 6.9%(-4.36)#24,446 |
1
Common Questions
What are the Top Zip Codes with the Highest Percentage of Population Employed in Accommodation & Food Services in Waxahachie, TX?
Top Zip Codes with the Highest Percentage of Population Employed in Accommodation & Food Services in Waxahachie, TX are:
What zip code has the Highest Percentage of Population Employed in Accommodation & Food Services in Waxahachie, TX?
75165 has the Highest Percentage of Population Employed in Accommodation & Food Services in Waxahachie, TX with 6.4%.
What is the Percentage of Population Employed in Accommodation & Food Services in Waxahachie, TX?
Percentage of Population Employed in Accommodation & Food Services in Waxahachie is 7.0%.
What is the Percentage of Population Employed in Accommodation & Food Services in Texas?
Percentage of Population Employed in Accommodation & Food Services in Texas is 7.2%.
What is the Percentage of Population Employed in Accommodation & Food Services in the United States?
Percentage of Population Employed in Accommodation & Food Services in the United States is 6.9%.