Cities with the Most Immigrants from Iran in Washington
RELATED REPORTS & OPTIONS
Iran
Washington
Compare Cities
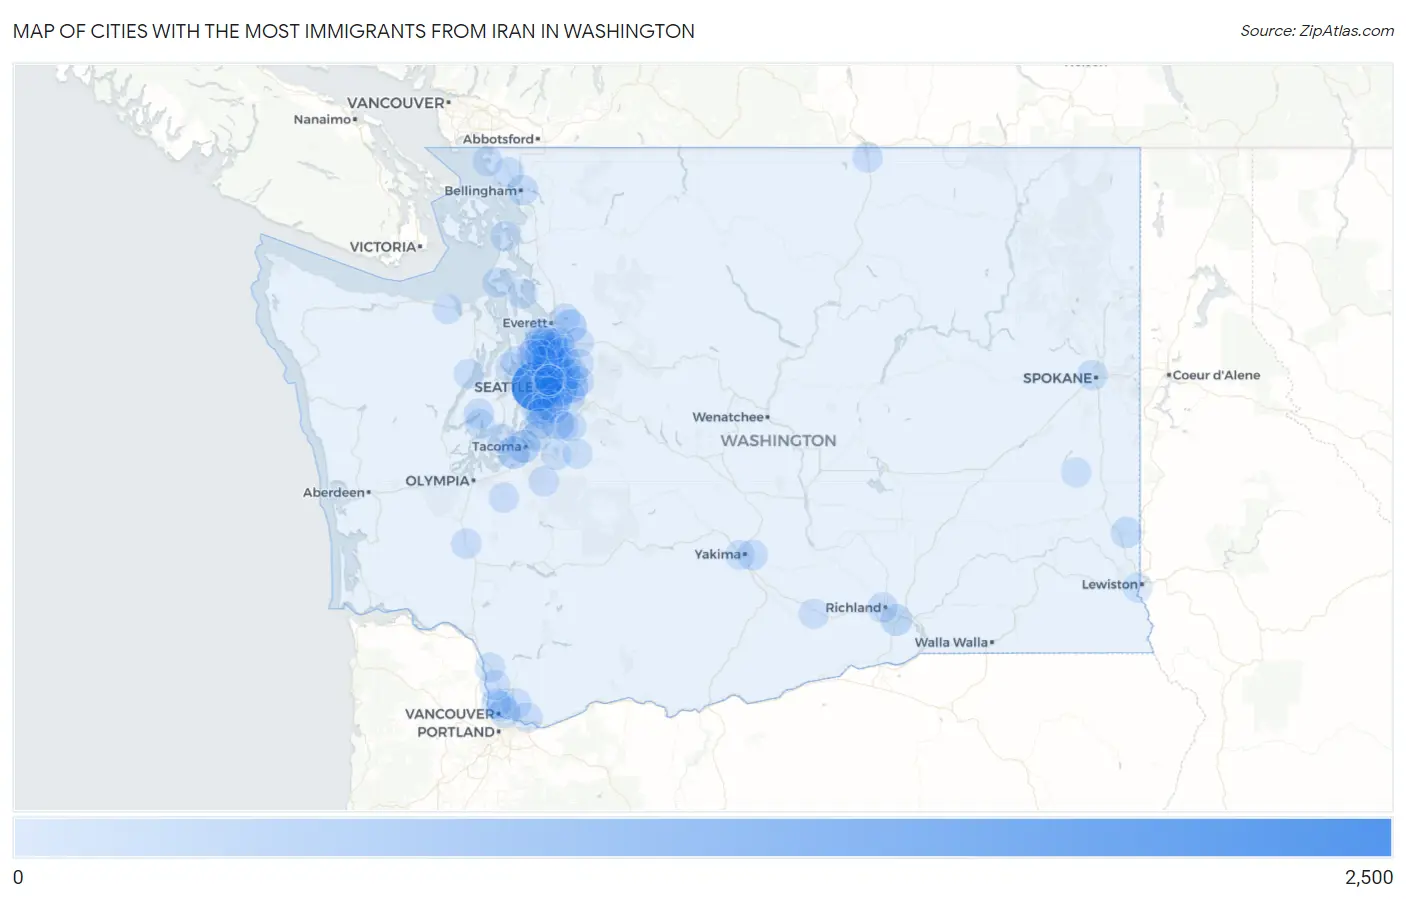
Map of Cities with the Most Immigrants from Iran in Washington
0
2,500
Cities with the Most Immigrants from Iran in Washington
| City | Iran | vs State | vs National | |
| 1. | Seattle | 2,043 | 10,499(19.46%)#1 | 391,354(0.52%)#14 |
| 2. | Kirkland | 986 | 10,499(9.39%)#2 | 391,354(0.25%)#43 |
| 3. | Bellevue | 797 | 10,499(7.59%)#3 | 391,354(0.20%)#54 |
| 4. | Bothell | 428 | 10,499(4.08%)#4 | 391,354(0.11%)#123 |
| 5. | Sammamish | 398 | 10,499(3.79%)#5 | 391,354(0.10%)#134 |
| 6. | Redmond | 339 | 10,499(3.23%)#6 | 391,354(0.09%)#156 |
| 7. | Everett | 315 | 10,499(3.00%)#7 | 391,354(0.08%)#168 |
| 8. | Tacoma | 285 | 10,499(2.71%)#8 | 391,354(0.07%)#190 |
| 9. | University Place | 275 | 10,499(2.62%)#9 | 391,354(0.07%)#203 |
| 10. | Kent | 239 | 10,499(2.28%)#10 | 391,354(0.06%)#237 |
| 11. | Bothell West | 192 | 10,499(1.83%)#11 | 391,354(0.05%)#292 |
| 12. | Bothell East | 187 | 10,499(1.78%)#12 | 391,354(0.05%)#300 |
| 13. | Renton | 171 | 10,499(1.63%)#13 | 391,354(0.04%)#320 |
| 14. | Kennewick | 159 | 10,499(1.51%)#14 | 391,354(0.04%)#346 |
| 15. | Clyde Hill | 146 | 10,499(1.39%)#15 | 391,354(0.04%)#384 |
| 16. | Vancouver | 128 | 10,499(1.22%)#16 | 391,354(0.03%)#423 |
| 17. | North Lynnwood | 126 | 10,499(1.20%)#17 | 391,354(0.03%)#428 |
| 18. | Kenmore | 121 | 10,499(1.15%)#18 | 391,354(0.03%)#449 |
| 19. | Burien | 113 | 10,499(1.08%)#19 | 391,354(0.03%)#474 |
| 20. | Shoreline | 105 | 10,499(1.00%)#20 | 391,354(0.03%)#501 |
| 21. | Pullman | 100 | 10,499(0.95%)#21 | 391,354(0.03%)#522 |
| 22. | Woodinville | 94 | 10,499(0.90%)#22 | 391,354(0.02%)#553 |
| 23. | Mercer Island | 86 | 10,499(0.82%)#23 | 391,354(0.02%)#595 |
| 24. | Mukilteo | 82 | 10,499(0.78%)#24 | 391,354(0.02%)#618 |
| 25. | Bellingham | 81 | 10,499(0.77%)#25 | 391,354(0.02%)#622 |
| 26. | Lynnwood | 81 | 10,499(0.77%)#26 | 391,354(0.02%)#625 |
| 27. | Silver Firs | 79 | 10,499(0.75%)#27 | 391,354(0.02%)#639 |
| 28. | Tukwila | 74 | 10,499(0.70%)#28 | 391,354(0.02%)#674 |
| 29. | Issaquah | 68 | 10,499(0.65%)#29 | 391,354(0.02%)#717 |
| 30. | Ferndale | 68 | 10,499(0.65%)#30 | 391,354(0.02%)#719 |
| 31. | Mill Creek East | 66 | 10,499(0.63%)#31 | 391,354(0.02%)#728 |
| 32. | Union Hill Novelty Hill | 66 | 10,499(0.63%)#32 | 391,354(0.02%)#729 |
| 33. | Edmonds | 65 | 10,499(0.62%)#33 | 391,354(0.02%)#736 |
| 34. | Picnic Point | 64 | 10,499(0.61%)#34 | 391,354(0.02%)#754 |
| 35. | Federal Way | 56 | 10,499(0.53%)#35 | 391,354(0.01%)#811 |
| 36. | Lake Stevens | 56 | 10,499(0.53%)#36 | 391,354(0.01%)#814 |
| 37. | Mill Creek | 56 | 10,499(0.53%)#37 | 391,354(0.01%)#816 |
| 38. | Lake Stickney | 54 | 10,499(0.51%)#38 | 391,354(0.01%)#837 |
| 39. | Terrace Heights | 51 | 10,499(0.49%)#39 | 391,354(0.01%)#868 |
| 40. | Hazel Dell | 49 | 10,499(0.47%)#40 | 391,354(0.01%)#893 |
| 41. | Orchards | 48 | 10,499(0.46%)#41 | 391,354(0.01%)#904 |
| 42. | Spokane | 45 | 10,499(0.43%)#42 | 391,354(0.01%)#935 |
| 43. | Richland | 45 | 10,499(0.43%)#43 | 391,354(0.01%)#938 |
| 44. | Newcastle | 45 | 10,499(0.43%)#44 | 391,354(0.01%)#941 |
| 45. | Maple Valley | 40 | 10,499(0.38%)#45 | 391,354(0.01%)#1,002 |
| 46. | Cottage Lake | 38 | 10,499(0.36%)#46 | 391,354(0.01%)#1,041 |
| 47. | Chehalis | 38 | 10,499(0.36%)#47 | 391,354(0.01%)#1,044 |
| 48. | Bryn Mawr Skyway | 37 | 10,499(0.35%)#48 | 391,354(0.01%)#1,056 |
| 49. | Ames Lake | 37 | 10,499(0.35%)#49 | 391,354(0.01%)#1,062 |
| 50. | Mountlake Terrace | 36 | 10,499(0.34%)#50 | 391,354(0.01%)#1,070 |
| 51. | Lake Shore | 33 | 10,499(0.31%)#51 | 391,354(0.01%)#1,135 |
| 52. | Covington | 32 | 10,499(0.30%)#52 | 391,354(0.01%)#1,147 |
| 53. | Ridgefield | 30 | 10,499(0.29%)#53 | 391,354(0.01%)#1,204 |
| 54. | Graham | 29 | 10,499(0.28%)#54 | 391,354(0.01%)#1,219 |
| 55. | Seatac | 29 | 10,499(0.28%)#55 | 391,354(0.01%)#1,221 |
| 56. | Yelm | 28 | 10,499(0.27%)#56 | 391,354(0.01%)#1,253 |
| 57. | Belfair | 28 | 10,499(0.27%)#57 | 391,354(0.01%)#1,260 |
| 58. | Oroville | 26 | 10,499(0.25%)#58 | 391,354(0.01%)#1,320 |
| 59. | Camas | 24 | 10,499(0.23%)#59 | 391,354(0.01%)#1,355 |
| 60. | Maltby | 21 | 10,499(0.20%)#60 | 391,354(0.01%)#1,430 |
| 61. | Bonney Lake | 20 | 10,499(0.19%)#61 | 391,354(0.01%)#1,450 |
| 62. | Monroe | 20 | 10,499(0.19%)#62 | 391,354(0.01%)#1,453 |
| 63. | Coupeville | 18 | 10,499(0.17%)#63 | 391,354(0.00%)#1,543 |
| 64. | Artondale | 17 | 10,499(0.16%)#64 | 391,354(0.00%)#1,571 |
| 65. | Yarrow Point | 16 | 10,499(0.15%)#65 | 391,354(0.00%)#1,617 |
| 66. | Des Moines | 15 | 10,499(0.14%)#66 | 391,354(0.00%)#1,624 |
| 67. | Grandview | 15 | 10,499(0.14%)#67 | 391,354(0.00%)#1,638 |
| 68. | Woodland | 14 | 10,499(0.13%)#68 | 391,354(0.00%)#1,680 |
| 69. | River Road | 14 | 10,499(0.13%)#69 | 391,354(0.00%)#1,699 |
| 70. | Medina | 13 | 10,499(0.12%)#70 | 391,354(0.00%)#1,737 |
| 71. | Brinnon | 13 | 10,499(0.12%)#71 | 391,354(0.00%)#1,740 |
| 72. | Yakima | 11 | 10,499(0.10%)#72 | 391,354(0.00%)#1,792 |
| 73. | Anacortes | 10 | 10,499(0.10%)#73 | 391,354(0.00%)#1,871 |
| 74. | Birch Bay | 10 | 10,499(0.10%)#74 | 391,354(0.00%)#1,883 |
| 75. | Camano | 9 | 10,499(0.09%)#75 | 391,354(0.00%)#1,942 |
| 76. | Lake Forest Park | 9 | 10,499(0.09%)#76 | 391,354(0.00%)#1,947 |
| 77. | Enumclaw | 9 | 10,499(0.09%)#77 | 391,354(0.00%)#1,949 |
| 78. | Duvall | 9 | 10,499(0.09%)#78 | 391,354(0.00%)#1,959 |
| 79. | West Clarkston Highland | 7 | 10,499(0.07%)#79 | 391,354(0.00%)#2,096 |
| 80. | Suquamish | 5 | 10,499(0.05%)#80 | 391,354(0.00%)#2,197 |
| 81. | Indianola | 3 | 10,499(0.03%)#81 | 391,354(0.00%)#2,273 |
| 82. | Allyn | 3 | 10,499(0.03%)#82 | 391,354(0.00%)#2,279 |
| 83. | Woodway | 3 | 10,499(0.03%)#83 | 391,354(0.00%)#2,288 |
| 84. | St John | 2 | 10,499(0.02%)#84 | 391,354(0.00%)#2,327 |
| 85. | Hunts Point | 2 | 10,499(0.02%)#85 | 391,354(0.00%)#2,335 |
Common Questions
What are the Top 10 Cities with the Most Immigrants from Iran in Washington?
Top 10 Cities with the Most Immigrants from Iran in Washington are:
What city has the Most Immigrants from Iran in Washington?
Seattle has the Most Immigrants from Iran in Washington with 2,043.
What is the Total Immigrants from Iran in the State of Washington?
Total Immigrants from Iran in Washington is 10,499.
What is the Total Immigrants from Iran in the United States?
Total Immigrants from Iran in the United States is 391,354.