Cities with the Most Immigrants from Iran in Minnesota
RELATED REPORTS & OPTIONS
Iran
Minnesota
Compare Cities
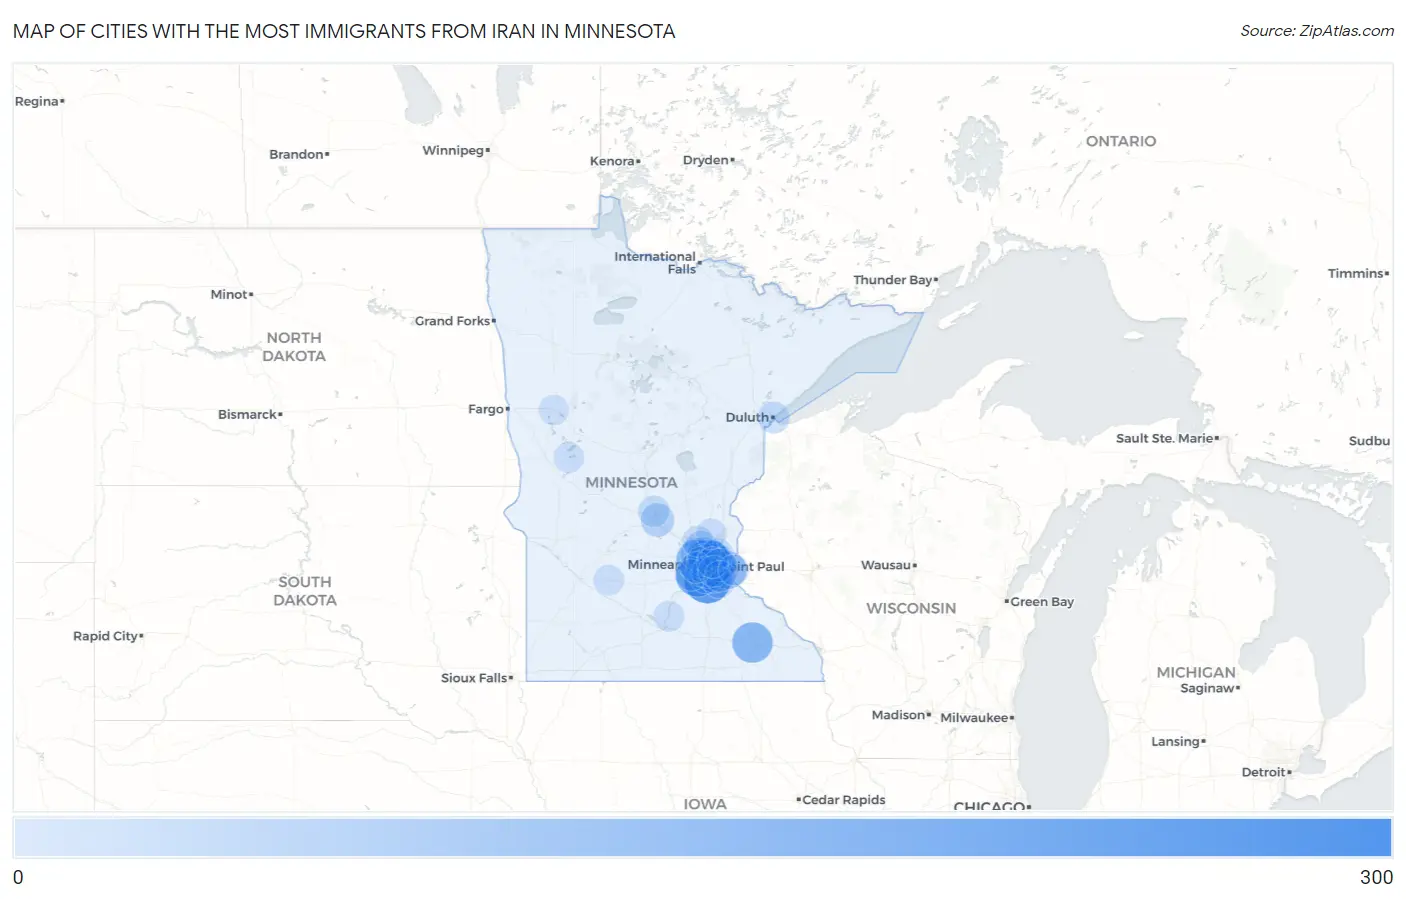
Map of Cities with the Most Immigrants from Iran in Minnesota
0
300
Cities with the Most Immigrants from Iran in Minnesota
| City | Iran | vs State | vs National | |
| 1. | Minneapolis | 281 | 2,035(13.81%)#1 | 391,354(0.07%)#197 |
| 2. | Burnsville | 240 | 2,035(11.79%)#2 | 391,354(0.06%)#236 |
| 3. | Eden Prairie | 191 | 2,035(9.39%)#3 | 391,354(0.05%)#293 |
| 4. | Rochester | 147 | 2,035(7.22%)#4 | 391,354(0.04%)#380 |
| 5. | Plymouth | 141 | 2,035(6.93%)#5 | 391,354(0.04%)#394 |
| 6. | St Paul | 113 | 2,035(5.55%)#6 | 391,354(0.03%)#470 |
| 7. | Woodbury | 111 | 2,035(5.45%)#7 | 391,354(0.03%)#485 |
| 8. | Roseville | 74 | 2,035(3.64%)#8 | 391,354(0.02%)#672 |
| 9. | Bloomington | 57 | 2,035(2.80%)#9 | 391,354(0.01%)#802 |
| 10. | New Brighton | 55 | 2,035(2.70%)#10 | 391,354(0.01%)#823 |
| 11. | Brooklyn Center | 54 | 2,035(2.65%)#11 | 391,354(0.01%)#832 |
| 12. | Edina | 50 | 2,035(2.46%)#12 | 391,354(0.01%)#876 |
| 13. | St Cloud | 47 | 2,035(2.31%)#13 | 391,354(0.01%)#911 |
| 14. | Champlin | 41 | 2,035(2.01%)#14 | 391,354(0.01%)#992 |
| 15. | Brooklyn Park | 39 | 2,035(1.92%)#15 | 391,354(0.01%)#1,017 |
| 16. | Eagan | 33 | 2,035(1.62%)#16 | 391,354(0.01%)#1,127 |
| 17. | Maplewood | 31 | 2,035(1.52%)#17 | 391,354(0.01%)#1,167 |
| 18. | Maple Grove | 27 | 2,035(1.33%)#18 | 391,354(0.01%)#1,267 |
| 19. | St Louis Park | 27 | 2,035(1.33%)#19 | 391,354(0.01%)#1,270 |
| 20. | Golden Valley | 25 | 2,035(1.23%)#20 | 391,354(0.01%)#1,336 |
| 21. | Duluth | 22 | 2,035(1.08%)#21 | 391,354(0.01%)#1,388 |
| 22. | Robbinsdale | 22 | 2,035(1.08%)#22 | 391,354(0.01%)#1,401 |
| 23. | Chanhassen | 17 | 2,035(0.84%)#23 | 391,354(0.00%)#1,562 |
| 24. | Sartell | 17 | 2,035(0.84%)#24 | 391,354(0.00%)#1,567 |
| 25. | Arden Hills | 17 | 2,035(0.84%)#25 | 391,354(0.00%)#1,579 |
| 26. | Richfield | 14 | 2,035(0.69%)#26 | 391,354(0.00%)#1,659 |
| 27. | North Oaks | 12 | 2,035(0.59%)#27 | 391,354(0.00%)#1,775 |
| 28. | Rosemount | 11 | 2,035(0.54%)#28 | 391,354(0.00%)#1,810 |
| 29. | Minnetonka | 10 | 2,035(0.49%)#29 | 391,354(0.00%)#1,849 |
| 30. | Ramsey | 10 | 2,035(0.49%)#30 | 391,354(0.00%)#1,861 |
| 31. | Mendota Heights | 9 | 2,035(0.44%)#31 | 391,354(0.00%)#1,952 |
| 32. | Inver Grove Heights | 8 | 2,035(0.39%)#32 | 391,354(0.00%)#2,000 |
| 33. | Falcon Heights | 8 | 2,035(0.39%)#33 | 391,354(0.00%)#2,042 |
| 34. | St Peter | 7 | 2,035(0.34%)#34 | 391,354(0.00%)#2,087 |
| 35. | East Bethel | 7 | 2,035(0.34%)#35 | 391,354(0.00%)#2,088 |
| 36. | Olivia | 5 | 2,035(0.25%)#36 | 391,354(0.00%)#2,206 |
| 37. | Afton | 4 | 2,035(0.20%)#37 | 391,354(0.00%)#2,241 |
| 38. | Battle Lake | 4 | 2,035(0.20%)#38 | 391,354(0.00%)#2,256 |
| 39. | Audubon | 2 | 2,035(0.10%)#39 | 391,354(0.00%)#2,333 |
Common Questions
What are the Top 10 Cities with the Most Immigrants from Iran in Minnesota?
Top 10 Cities with the Most Immigrants from Iran in Minnesota are:
#1
281
#2
240
#3
191
#4
147
#5
141
#6
113
#7
111
#8
74
#9
57
#10
55
What city has the Most Immigrants from Iran in Minnesota?
Minneapolis has the Most Immigrants from Iran in Minnesota with 281.
What is the Total Immigrants from Iran in the State of Minnesota?
Total Immigrants from Iran in Minnesota is 2,035.
What is the Total Immigrants from Iran in the United States?
Total Immigrants from Iran in the United States is 391,354.