Cities with the Most Immigrants from Cuba in Missouri
RELATED REPORTS & OPTIONS
Cuba
Missouri
Compare Cities
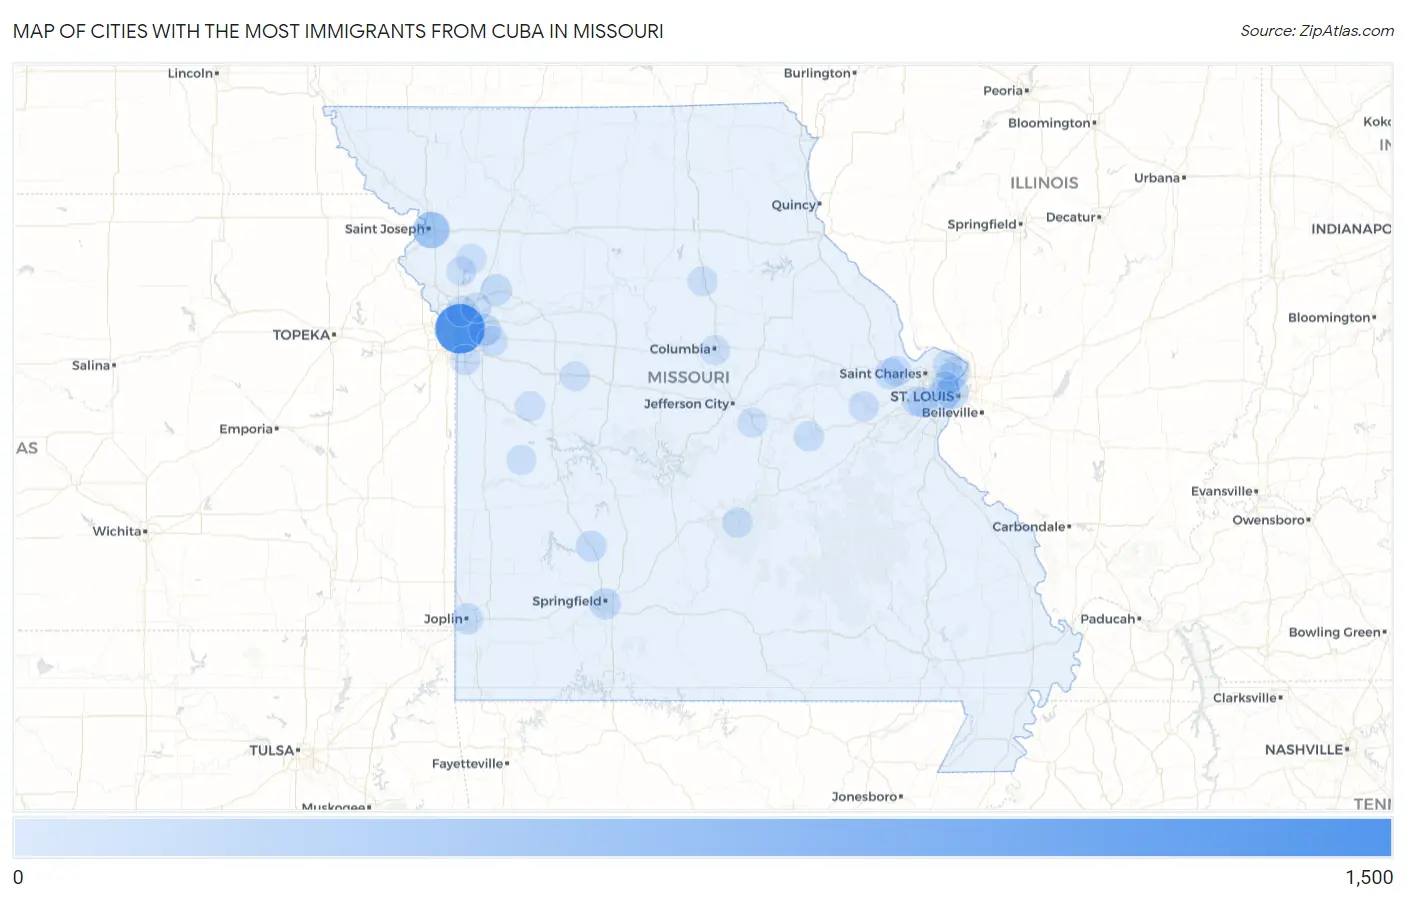
Map of Cities with the Most Immigrants from Cuba in Missouri
0
1,500
Cities with the Most Immigrants from Cuba in Missouri
| City | Cuba | vs State | vs National | |
| 1. | Kansas City | 1,346 | 2,867(46.95%)#1 | 1,325,277(0.10%)#113 |
| 2. | St Joseph | 426 | 2,867(14.86%)#2 | 1,325,277(0.03%)#243 |
| 3. | St Louis | 193 | 2,867(6.73%)#3 | 1,325,277(0.01%)#447 |
| 4. | Independence | 127 | 2,867(4.43%)#4 | 1,325,277(0.01%)#588 |
| 5. | Excelsior Springs | 97 | 2,867(3.38%)#5 | 1,325,277(0.01%)#725 |
| 6. | Springfield | 81 | 2,867(2.83%)#6 | 1,325,277(0.01%)#818 |
| 7. | Joplin | 65 | 2,867(2.27%)#7 | 1,325,277(0.00%)#967 |
| 8. | Bolivar | 57 | 2,867(1.99%)#8 | 1,325,277(0.00%)#1,058 |
| 9. | Lake St Louis | 47 | 2,867(1.64%)#9 | 1,325,277(0.00%)#1,198 |
| 10. | O Fallon | 33 | 2,867(1.15%)#10 | 1,325,277(0.00%)#1,472 |
| 11. | Ballwin | 28 | 2,867(0.98%)#11 | 1,325,277(0.00%)#1,610 |
| 12. | Grandview | 26 | 2,867(0.91%)#12 | 1,325,277(0.00%)#1,663 |
| 13. | Gladstone | 22 | 2,867(0.77%)#13 | 1,325,277(0.00%)#1,800 |
| 14. | Washington | 21 | 2,867(0.73%)#14 | 1,325,277(0.00%)#1,845 |
| 15. | Fort Leonard Wood | 20 | 2,867(0.70%)#15 | 1,325,277(0.00%)#1,897 |
| 16. | Blue Springs | 19 | 2,867(0.66%)#16 | 1,325,277(0.00%)#1,922 |
| 17. | Liberty | 15 | 2,867(0.52%)#17 | 1,325,277(0.00%)#2,116 |
| 18. | Manchester | 14 | 2,867(0.49%)#18 | 1,325,277(0.00%)#2,187 |
| 19. | Owensville | 14 | 2,867(0.49%)#19 | 1,325,277(0.00%)#2,213 |
| 20. | Richmond Heights | 12 | 2,867(0.42%)#20 | 1,325,277(0.00%)#2,343 |
| 21. | Blairstown | 10 | 2,867(0.35%)#21 | 1,325,277(0.00%)#2,520 |
| 22. | Spanish Lake | 9 | 2,867(0.31%)#22 | 1,325,277(0.00%)#2,561 |
| 23. | Castle Point | 8 | 2,867(0.28%)#23 | 1,325,277(0.00%)#2,691 |
| 24. | Columbia | 7 | 2,867(0.24%)#24 | 1,325,277(0.00%)#2,709 |
| 25. | Moberly | 7 | 2,867(0.24%)#25 | 1,325,277(0.00%)#2,743 |
| 26. | Plattsburg | 7 | 2,867(0.24%)#26 | 1,325,277(0.00%)#2,784 |
| 27. | Knob Noster | 6 | 2,867(0.21%)#27 | 1,325,277(0.00%)#2,849 |
| 28. | Trimble | 5 | 2,867(0.17%)#28 | 1,325,277(0.00%)#2,941 |
| 29. | Old Jamestown | 4 | 2,867(0.14%)#29 | 1,325,277(0.00%)#2,967 |
| 30. | Appleton City | 2 | 2,867(0.07%)#30 | 1,325,277(0.00%)#3,120 |
| 31. | Greendale | 2 | 2,867(0.07%)#31 | 1,325,277(0.00%)#3,131 |
| 32. | Westphalia | 1 | 2,867(0.03%)#32 | 1,325,277(0.00%)#3,214 |
Common Questions
What are the Top 10 Cities with the Most Immigrants from Cuba in Missouri?
Top 10 Cities with the Most Immigrants from Cuba in Missouri are:
#1
1,346
#2
426
#3
193
#4
127
#5
97
#6
81
#7
65
#8
57
#9
47
#10
33
What city has the Most Immigrants from Cuba in Missouri?
Kansas City has the Most Immigrants from Cuba in Missouri with 1,346.
What is the Total Immigrants from Cuba in the State of Missouri?
Total Immigrants from Cuba in Missouri is 2,867.
What is the Total Immigrants from Cuba in the United States?
Total Immigrants from Cuba in the United States is 1,325,277.