Cities with the Most Immigrants from Burma / Myanmar in Indiana
RELATED REPORTS & OPTIONS
Burma / Myanmar
Indiana
Compare Cities
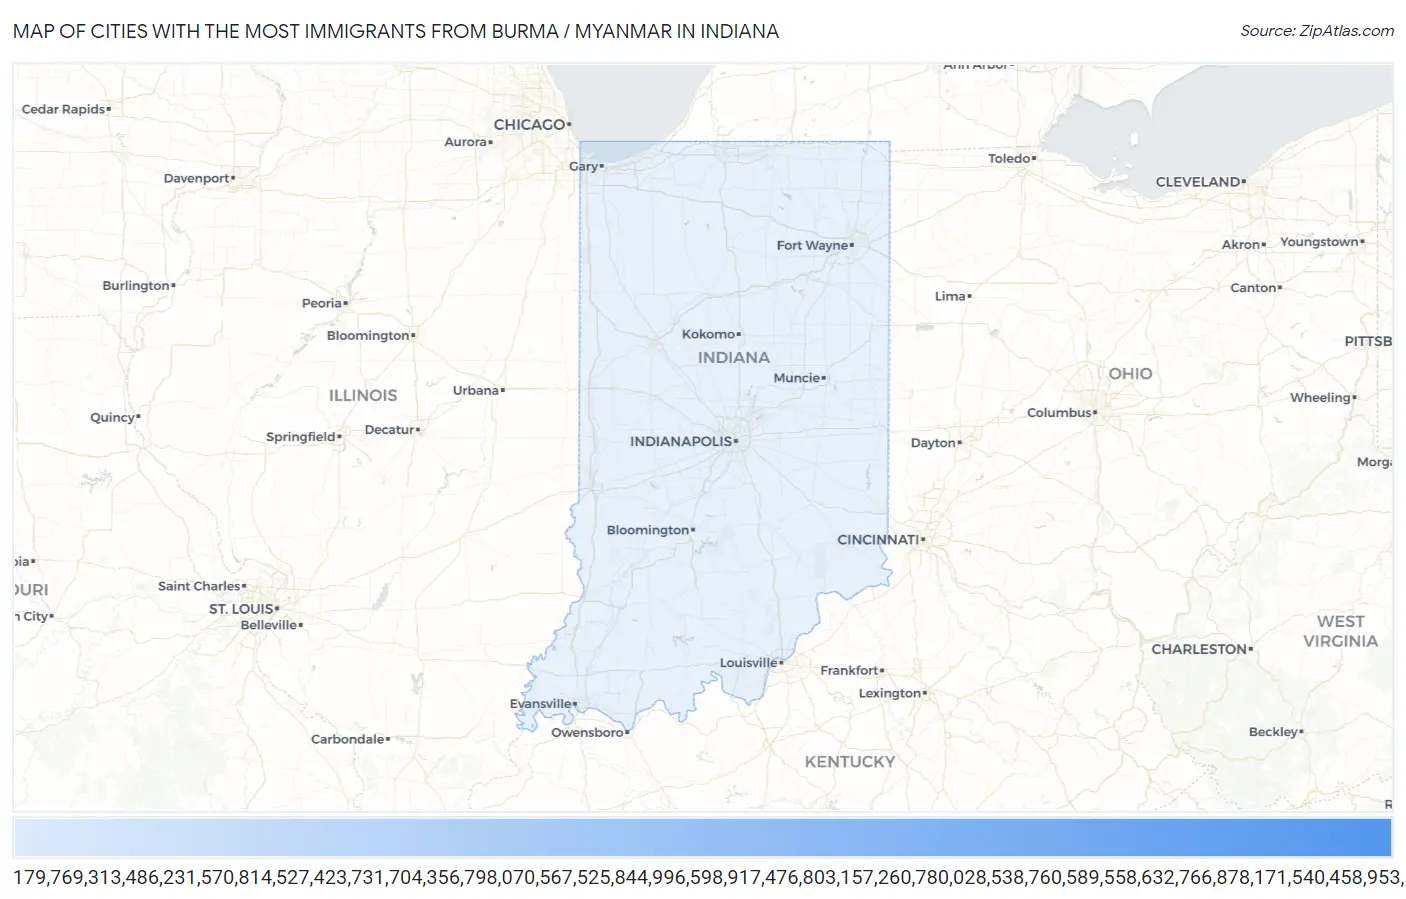
Map of Cities with the Most Immigrants from Burma / Myanmar in Indiana
0
10,000
Cities with the Most Immigrants from Burma / Myanmar in Indiana
| City | Burma / Myanmar | vs State | vs National | |
| 1. | Indianapolis | 9,497 | 16,289(58.30%)#-1 | 157,000(6.05%)#0 |
| 2. | Fort Wayne | 4,319 | 16,289(26.51%)#0 | 157,000(2.75%)#1 |
| 3. | Southport | 364 | 16,289(2.23%)#1 | 157,000(0.23%)#2 |
| 4. | Greenwood | 253 | 16,289(1.55%)#2 | 157,000(0.16%)#3 |
| 5. | Granger | 190 | 16,289(1.17%)#3 | 157,000(0.12%)#4 |
| 6. | Fishers | 152 | 16,289(0.93%)#4 | 157,000(0.10%)#5 |
| 7. | Griffith | 149 | 16,289(0.91%)#5 | 157,000(0.09%)#6 |
| 8. | Mishawaka | 94 | 16,289(0.58%)#6 | 157,000(0.06%)#7 |
| 9. | South Bend | 72 | 16,289(0.44%)#7 | 157,000(0.05%)#8 |
| 10. | Melody Hill | 60 | 16,289(0.37%)#8 | 157,000(0.04%)#9 |
| 11. | Frankfort | 59 | 16,289(0.36%)#9 | 157,000(0.04%)#10 |
| 12. | Plainfield | 51 | 16,289(0.31%)#10 | 157,000(0.03%)#11 |
| 13. | Shorewood Forest | 50 | 16,289(0.31%)#11 | 157,000(0.03%)#12 |
| 14. | Columbus | 43 | 16,289(0.26%)#12 | 157,000(0.03%)#13 |
| 15. | Zionsville | 42 | 16,289(0.26%)#13 | 157,000(0.03%)#14 |
| 16. | Greenfield | 36 | 16,289(0.22%)#14 | 157,000(0.02%)#15 |
| 17. | Huntertown | 34 | 16,289(0.21%)#15 | 157,000(0.02%)#16 |
| 18. | Gas City | 34 | 16,289(0.21%)#16 | 157,000(0.02%)#17 |
| 19. | Princeton | 31 | 16,289(0.19%)#17 | 157,000(0.02%)#18 |
| 20. | New Haven | 25 | 16,289(0.15%)#18 | 157,000(0.02%)#19 |
| 21. | Leesburg | 23 | 16,289(0.14%)#19 | 157,000(0.01%)#20 |
| 22. | New Castle | 22 | 16,289(0.14%)#20 | 157,000(0.01%)#21 |
| 23. | Portland | 22 | 16,289(0.14%)#21 | 157,000(0.01%)#22 |
| 24. | Bloomington | 17 | 16,289(0.10%)#22 | 157,000(0.01%)#23 |
| 25. | Sunman | 16 | 16,289(0.10%)#23 | 157,000(0.01%)#24 |
| 26. | Syracuse | 15 | 16,289(0.09%)#24 | 157,000(0.01%)#25 |
| 27. | Lyons | 15 | 16,289(0.09%)#25 | 157,000(0.01%)#26 |
| 28. | Beech Grove | 12 | 16,289(0.07%)#26 | 157,000(0.01%)#27 |
| 29. | Claypool | 12 | 16,289(0.07%)#27 | 157,000(0.01%)#28 |
| 30. | Speedway | 9 | 16,289(0.06%)#28 | 157,000(0.01%)#29 |
| 31. | North Manchester | 9 | 16,289(0.06%)#29 | 157,000(0.01%)#30 |
| 32. | Muncie | 8 | 16,289(0.05%)#30 | 157,000(0.01%)#31 |
| 33. | Homecroft | 8 | 16,289(0.05%)#31 | 157,000(0.01%)#32 |
| 34. | West Lafayette | 7 | 16,289(0.04%)#32 | 157,000(0.00%)#33 |
| 35. | Oakland City | 6 | 16,289(0.04%)#33 | 157,000(0.00%)#34 |
| 36. | Angola | 4 | 16,289(0.02%)#34 | 157,000(0.00%)#35 |
| 37. | Notre Dame | 4 | 16,289(0.02%)#35 | 157,000(0.00%)#36 |
| 38. | Richmond | 3 | 16,289(0.02%)#36 | 157,000(0.00%)#37 |
| 39. | Upland | 3 | 16,289(0.02%)#37 | 157,000(0.00%)#38 |
| 40. | Aurora | 2 | 16,289(0.01%)#38 | 157,000(0.00%)#39 |
| 41. | Burns Harbor | 2 | 16,289(0.01%)#39 | 157,000(0.00%)#40 |
| 42. | Monrovia | 2 | 16,289(0.01%)#40 | 157,000(0.00%)#41 |
| 43. | West Harrison | 2 | 16,289(0.01%)#41 | 157,000(0.00%)#42 |
| 44. | Wynnedale | 2 | 16,289(0.01%)#42 | 157,000(0.00%)#43 |
| 45. | Larwill | 1 | 16,289(0.01%)#43 | 157,000(0.00%)#44 |
Common Questions
What are the Top 10 Cities with the Most Immigrants from Burma / Myanmar in Indiana?
Top 10 Cities with the Most Immigrants from Burma / Myanmar in Indiana are:
#1
9,497
#2
4,319
#3
364
#4
253
#5
190
#6
152
#7
149
#8
94
#9
72
#10
60
What city has the Most Immigrants from Burma / Myanmar in Indiana?
Indianapolis has the Most Immigrants from Burma / Myanmar in Indiana with 9,497.
What is the Total Immigrants from Burma / Myanmar in the State of Indiana?
Total Immigrants from Burma / Myanmar in Indiana is 16,289.
What is the Total Immigrants from Burma / Myanmar in the United States?
Total Immigrants from Burma / Myanmar in the United States is 157,000.