Cities with the Most Immigrants from Burma / Myanmar in Minnesota
RELATED REPORTS & OPTIONS
Burma / Myanmar
Minnesota
Compare Cities
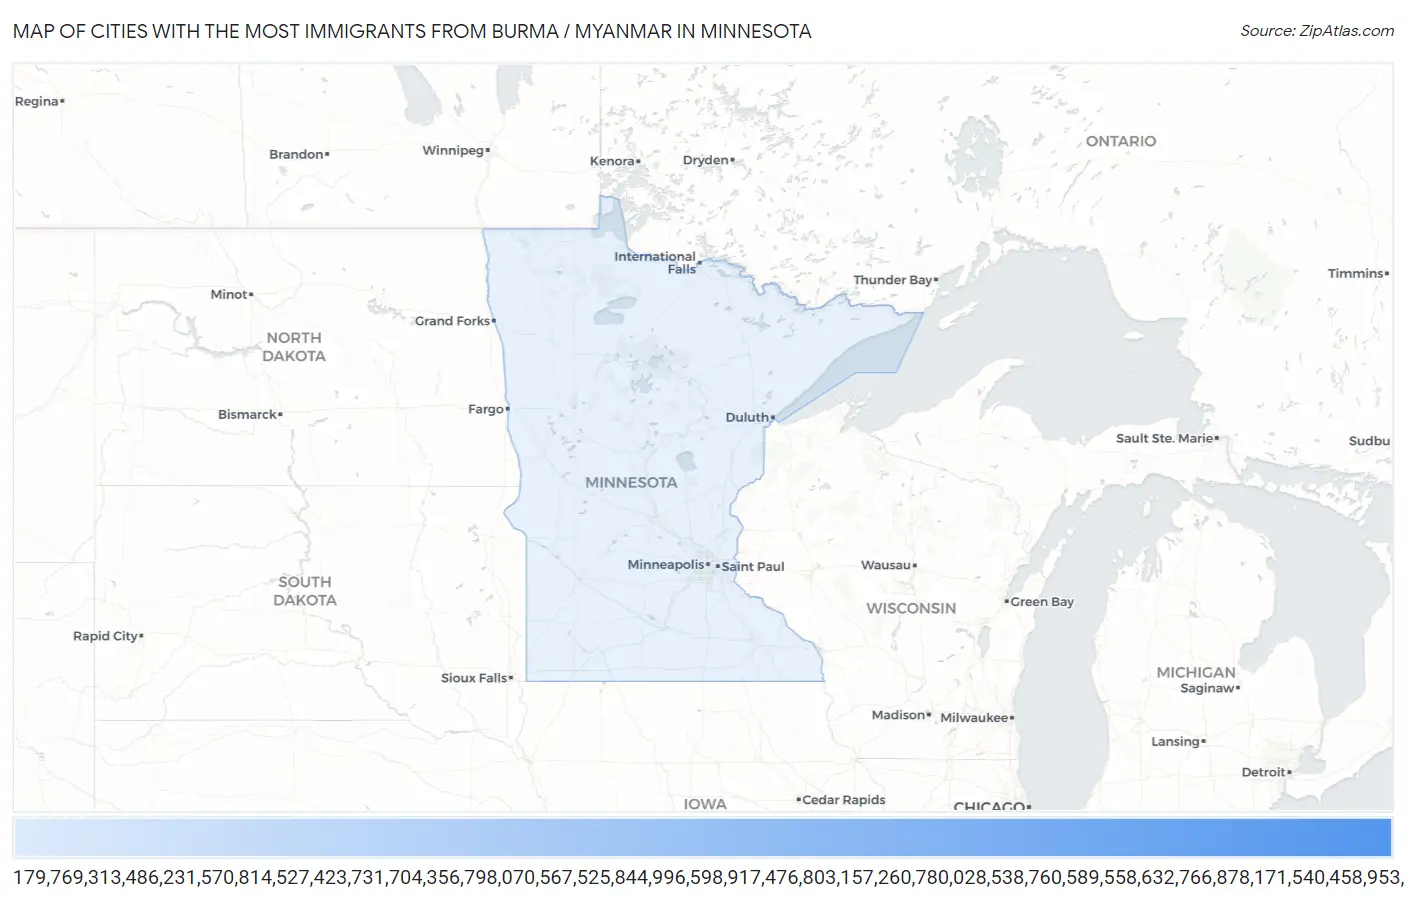
Map of Cities with the Most Immigrants from Burma / Myanmar in Minnesota
0
6,000
Cities with the Most Immigrants from Burma / Myanmar in Minnesota
| City | Burma / Myanmar | vs State | vs National | |
| 1. | St Paul | 5,735 | 8,637(66.40%)#-1 | 157,000(3.65%)#0 |
| 2. | Austin | 410 | 8,637(4.75%)#0 | 157,000(0.26%)#1 |
| 3. | Eagan | 353 | 8,637(4.09%)#1 | 157,000(0.22%)#2 |
| 4. | Maplewood | 239 | 8,637(2.77%)#2 | 157,000(0.15%)#3 |
| 5. | North St Paul | 235 | 8,637(2.72%)#3 | 157,000(0.15%)#4 |
| 6. | Roseville | 228 | 8,637(2.64%)#4 | 157,000(0.15%)#5 |
| 7. | Marshall | 219 | 8,637(2.54%)#5 | 157,000(0.14%)#6 |
| 8. | Rochester | 213 | 8,637(2.47%)#6 | 157,000(0.14%)#7 |
| 9. | Albert Lea | 191 | 8,637(2.21%)#7 | 157,000(0.12%)#8 |
| 10. | Burnsville | 168 | 8,637(1.95%)#8 | 157,000(0.11%)#9 |
| 11. | Willmar | 135 | 8,637(1.56%)#9 | 157,000(0.09%)#10 |
| 12. | Clarks Grove | 90 | 8,637(1.04%)#10 | 157,000(0.06%)#11 |
| 13. | Worthington | 64 | 8,637(0.74%)#11 | 157,000(0.04%)#12 |
| 14. | Edina | 43 | 8,637(0.50%)#12 | 157,000(0.03%)#13 |
| 15. | Apple Valley | 40 | 8,637(0.46%)#13 | 157,000(0.03%)#14 |
| 16. | Adrian | 38 | 8,637(0.44%)#14 | 157,000(0.02%)#15 |
| 17. | Crystal | 29 | 8,637(0.34%)#15 | 157,000(0.02%)#16 |
| 18. | Fulda | 26 | 8,637(0.30%)#16 | 157,000(0.02%)#17 |
| 19. | Mahtomedi | 21 | 8,637(0.24%)#17 | 157,000(0.01%)#18 |
| 20. | Falcon Heights | 21 | 8,637(0.24%)#18 | 157,000(0.01%)#19 |
| 21. | White Bear Lake | 17 | 8,637(0.20%)#19 | 157,000(0.01%)#20 |
| 22. | Cottage Grove | 16 | 8,637(0.19%)#20 | 157,000(0.01%)#21 |
| 23. | Brewster | 15 | 8,637(0.17%)#21 | 157,000(0.01%)#22 |
| 24. | Minneapolis | 13 | 8,637(0.15%)#22 | 157,000(0.01%)#23 |
| 25. | Walnut Grove | 9 | 8,637(0.10%)#23 | 157,000(0.01%)#24 |
| 26. | Hector | 6 | 8,637(0.07%)#24 | 157,000(0.00%)#25 |
| 27. | Shoreview | 5 | 8,637(0.06%)#25 | 157,000(0.00%)#26 |
| 28. | Stacy | 5 | 8,637(0.06%)#26 | 157,000(0.00%)#27 |
| 29. | White Earth | 4 | 8,637(0.05%)#27 | 157,000(0.00%)#28 |
| 30. | St Louis Park | 3 | 8,637(0.03%)#28 | 157,000(0.00%)#29 |
| 31. | Lilydale | 3 | 8,637(0.03%)#29 | 157,000(0.00%)#30 |
| 32. | Jeffers | 2 | 8,637(0.02%)#30 | 157,000(0.00%)#31 |
| 33. | Hampton | 1 | 8,637(0.01%)#31 | 157,000(0.00%)#32 |
| 34. | Round Lake | 1 | 8,637(0.01%)#32 | 157,000(0.00%)#33 |
Common Questions
What are the Top 10 Cities with the Most Immigrants from Burma / Myanmar in Minnesota?
Top 10 Cities with the Most Immigrants from Burma / Myanmar in Minnesota are:
#1
5,735
#2
410
#3
353
#4
239
#5
235
#6
228
#7
219
#8
213
#9
191
#10
168
What city has the Most Immigrants from Burma / Myanmar in Minnesota?
St Paul has the Most Immigrants from Burma / Myanmar in Minnesota with 5,735.
What is the Total Immigrants from Burma / Myanmar in the State of Minnesota?
Total Immigrants from Burma / Myanmar in Minnesota is 8,637.
What is the Total Immigrants from Burma / Myanmar in the United States?
Total Immigrants from Burma / Myanmar in the United States is 157,000.