Cities with the Highest Percentage of Immigrants from Mexico in Nevada
RELATED REPORTS & OPTIONS
Mexico
Nevada
Compare Cities
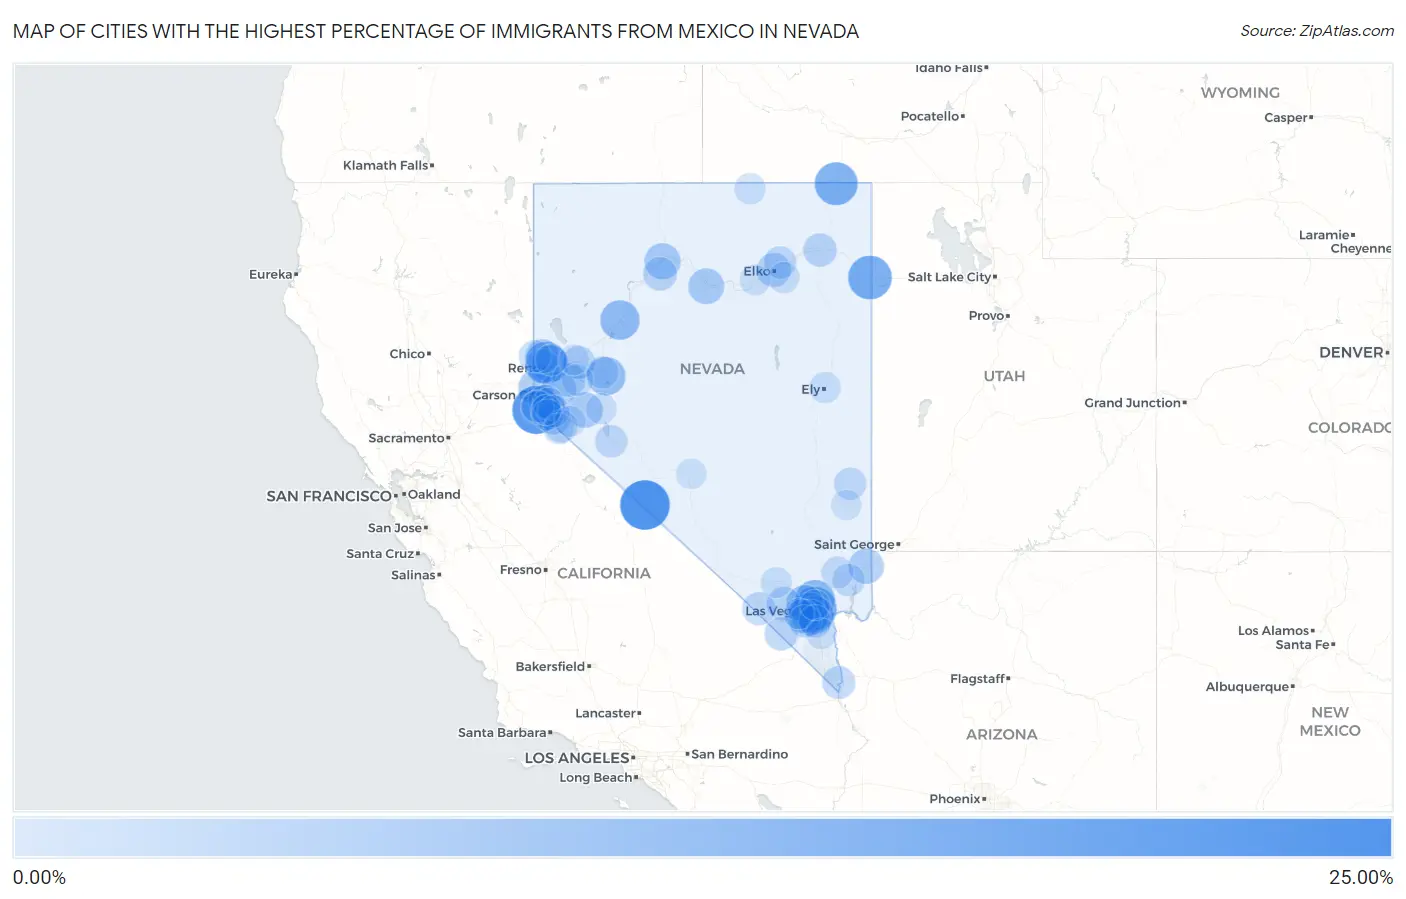
Map of Cities with the Highest Percentage of Immigrants from Mexico in Nevada
0.00%
25.00%
Cities with the Highest Percentage of Immigrants from Mexico in Nevada
| City | Mexico | vs State | vs National | |
| 1. | Dyer | 24.78% | 7.03%(+17.8)#-1 | 3.25%(+21.5)#0 |
| 2. | Stateline | 22.60% | 7.03%(+15.6)#0 | 3.25%(+19.3)#1 |
| 3. | West Wendover | 17.11% | 7.03%(+10.1)#1 | 3.25%(+13.9)#2 |
| 4. | Sunrise Manor | 16.61% | 7.03%(+9.58)#2 | 3.25%(+13.4)#3 |
| 5. | Jackpot | 16.13% | 7.03%(+9.10)#3 | 3.25%(+12.9)#4 |
| 6. | Amargosa Valley | 15.20% | 7.03%(+8.17)#4 | 3.25%(+12.0)#5 |
| 7. | Sun Valley | 14.39% | 7.03%(+7.36)#5 | 3.25%(+11.1)#6 |
| 8. | North Las Vegas | 12.30% | 7.03%(+5.27)#6 | 3.25%(+9.05)#7 |
| 9. | Winchester | 12.29% | 7.03%(+5.26)#7 | 3.25%(+9.04)#8 |
| 10. | Lovelock | 11.40% | 7.03%(+4.37)#8 | 3.25%(+8.15)#9 |
| 11. | Fallon Station | 10.34% | 7.03%(+3.31)#9 | 3.25%(+7.09)#10 |
| 12. | Whitney | 9.75% | 7.03%(+2.72)#10 | 3.25%(+6.50)#11 |
| 13. | Las Vegas | 8.68% | 7.03%(+1.65)#11 | 3.25%(+5.42)#12 |
| 14. | Sparks | 8.25% | 7.03%(+1.22)#12 | 3.25%(+4.99)#13 |
| 15. | Paradise | 7.56% | 7.03%(+0.535)#13 | 3.25%(+4.31)#14 |
| 16. | Winnemucca | 7.43% | 7.03%(+0.404)#14 | 3.25%(+4.18)#15 |
| 17. | Carson | 7.19% | 7.03%(+0.164)#15 | 3.25%(+3.94)#16 |
| 18. | Battle Mountain | 6.93% | 7.03%(-0.103)#16 | 3.25%(+3.67)#17 |
| 19. | Incline Village | 6.88% | 7.03%(-0.154)#17 | 3.25%(+3.62)#18 |
| 20. | Yerington | 6.56% | 7.03%(-0.466)#18 | 3.25%(+3.31)#19 |
| 21. | Gardnerville | 6.28% | 7.03%(-0.750)#19 | 3.25%(+3.03)#20 |
| 22. | Mesquite | 6.20% | 7.03%(-0.829)#20 | 3.25%(+2.95)#21 |
| 23. | Dayton | 5.55% | 7.03%(-1.48)#21 | 3.25%(+2.29)#22 |
| 24. | Reno | 5.44% | 7.03%(-1.59)#22 | 3.25%(+2.19)#23 |
| 25. | Elko | 4.90% | 7.03%(-2.13)#23 | 3.25%(+1.65)#24 |
| 26. | Lemmon Valley | 4.86% | 7.03%(-2.16)#24 | 3.25%(+1.61)#25 |
| 27. | Mount Charleston | 4.64% | 7.03%(-2.39)#25 | 3.25%(+1.39)#26 |
| 28. | Carter Springs | 4.44% | 7.03%(-2.58)#26 | 3.25%(+1.19)#27 |
| 29. | Spring Valley | 4.42% | 7.03%(-2.60)#27 | 3.25%(+1.17)#28 |
| 30. | Grass Valley | 4.29% | 7.03%(-2.74)#28 | 3.25%(+1.03)#29 |
| 31. | Sandy Valley | 4.08% | 7.03%(-2.95)#29 | 3.25%(+0.823)#30 |
| 32. | Stagecoach | 4.04% | 7.03%(-2.99)#30 | 3.25%(+0.792)#31 |
| 33. | Wells | 3.97% | 7.03%(-3.06)#31 | 3.25%(+0.722)#32 |
| 34. | Laughlin | 3.59% | 7.03%(-3.44)#32 | 3.25%(+0.340)#33 |
| 35. | Fernley | 3.57% | 7.03%(-3.46)#33 | 3.25%(+0.317)#34 |
| 36. | Pahrump | 3.46% | 7.03%(-3.57)#34 | 3.25%(+0.204)#35 |
| 37. | Indian Hills | 3.34% | 7.03%(-3.69)#35 | 3.25%(+0.090)#36 |
| 38. | Round Hill Village | 3.21% | 7.03%(-3.82)#36 | 3.25%(-0.047)#37 |
| 39. | Topaz Ranch Estates | 3.01% | 7.03%(-4.02)#37 | 3.25%(-0.243)#38 |
| 40. | Osino | 2.85% | 7.03%(-4.17)#38 | 3.25%(-0.398)#39 |
| 41. | Hawthorne | 2.85% | 7.03%(-4.18)#39 | 3.25%(-0.404)#40 |
| 42. | Enterprise | 2.82% | 7.03%(-4.21)#40 | 3.25%(-0.428)#41 |
| 43. | Henderson | 2.77% | 7.03%(-4.26)#41 | 3.25%(-0.484)#42 |
| 44. | Pioche | 2.61% | 7.03%(-4.42)#42 | 3.25%(-0.642)#43 |
| 45. | Cold Springs | 2.58% | 7.03%(-4.45)#43 | 3.25%(-0.668)#44 |
| 46. | Moapa Valley | 2.56% | 7.03%(-4.47)#44 | 3.25%(-0.690)#45 |
| 47. | Fallon | 2.40% | 7.03%(-4.63)#45 | 3.25%(-0.850)#46 |
| 48. | Zephyr Cove | 2.35% | 7.03%(-4.67)#46 | 3.25%(-0.897)#47 |
| 49. | Johnson Lane | 2.28% | 7.03%(-4.75)#47 | 3.25%(-0.975)#48 |
| 50. | Moapa Town | 2.19% | 7.03%(-4.84)#48 | 3.25%(-1.06)#49 |
| 51. | Fish Springs | 2.00% | 7.03%(-5.03)#49 | 3.25%(-1.25)#50 |
| 52. | Silver Springs | 1.78% | 7.03%(-5.25)#50 | 3.25%(-1.47)#51 |
| 53. | Spanish Springs | 1.45% | 7.03%(-5.58)#51 | 3.25%(-1.80)#52 |
| 54. | Ely | 1.42% | 7.03%(-5.61)#52 | 3.25%(-1.84)#53 |
| 55. | Spring Creek | 1.36% | 7.03%(-5.67)#53 | 3.25%(-1.89)#54 |
| 56. | Gardnerville Ranchos | 1.23% | 7.03%(-5.80)#54 | 3.25%(-2.02)#55 |
| 57. | Owyhee | 1.09% | 7.03%(-5.94)#55 | 3.25%(-2.16)#56 |
| 58. | Indian Springs | 1.08% | 7.03%(-5.95)#56 | 3.25%(-2.18)#57 |
| 59. | Topaz Lake | 1.00% | 7.03%(-6.03)#57 | 3.25%(-2.26)#58 |
| 60. | Smith Valley | 0.97% | 7.03%(-6.06)#58 | 3.25%(-2.28)#59 |
| 61. | Summerlin South | 0.85% | 7.03%(-6.18)#59 | 3.25%(-2.40)#60 |
| 62. | Schurz | 0.78% | 7.03%(-6.25)#60 | 3.25%(-2.47)#61 |
| 63. | Carlin | 0.68% | 7.03%(-6.35)#61 | 3.25%(-2.58)#62 |
| 64. | Wadsworth | 0.56% | 7.03%(-6.47)#62 | 3.25%(-2.69)#63 |
| 65. | Boulder City | 0.48% | 7.03%(-6.55)#63 | 3.25%(-2.77)#64 |
| 66. | Caliente | 0.24% | 7.03%(-6.79)#64 | 3.25%(-3.01)#65 |
| 67. | Tonopah | 0.23% | 7.03%(-6.80)#65 | 3.25%(-3.03)#66 |
| 68. | Nellis Afb | 0.12% | 7.03%(-6.91)#66 | 3.25%(-3.14)#67 |
| 69. | Minden | 0.096% | 7.03%(-6.93)#67 | 3.25%(-3.16)#68 |
1
Common Questions
What are the Top 10 Cities with the Highest Percentage of Immigrants from Mexico in Nevada?
Top 10 Cities with the Highest Percentage of Immigrants from Mexico in Nevada are:
#1
24.78%
#2
22.60%
#3
17.11%
#4
16.61%
#5
16.13%
#6
14.39%
#7
12.30%
#8
12.29%
#9
11.40%
#10
10.34%
What city has the Highest Percentage of Immigrants from Mexico in Nevada?
Dyer has the Highest Percentage of Immigrants from Mexico in Nevada with 24.78%.
What is the Percentage of Immigrants from Mexico in the State of Nevada?
Percentage of Immigrants from Mexico in Nevada is 7.03%.
What is the Percentage of Immigrants from Mexico in the United States?
Percentage of Immigrants from Mexico in the United States is 3.25%.