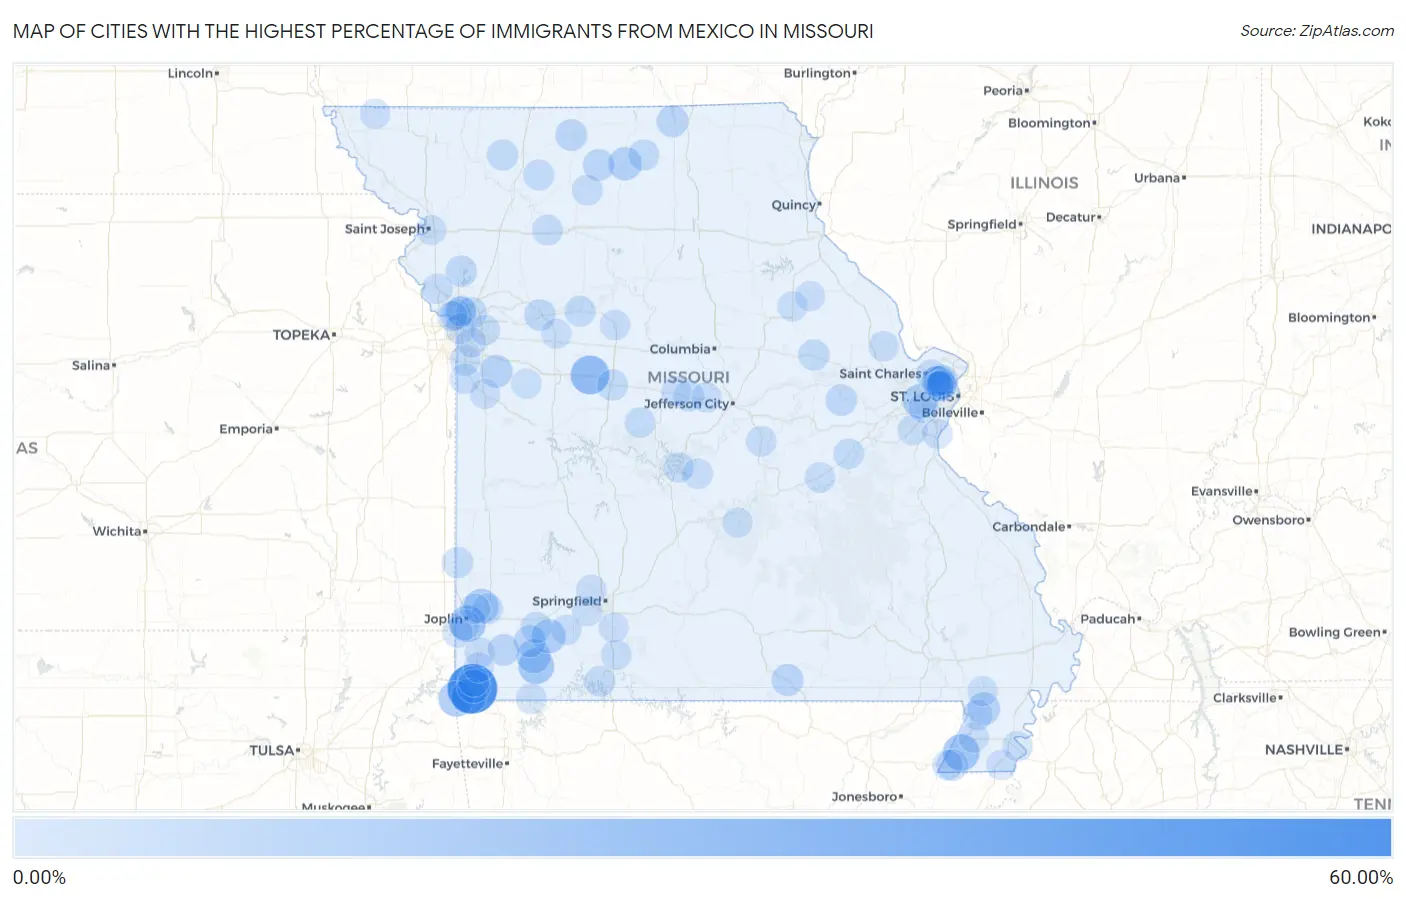
Cities with the Highest Percentage of Immigrants from Mexico in Missouri
RELATED REPORTS & OPTIONS
Mexico
Missouri
Compare Cities
Map of Cities with the Highest Percentage of Immigrants from Mexico in Missouri
0.00%
60.00%
Cities with the Highest Percentage of Immigrants from Mexico in Missouri
| City | Mexico | vs State | vs National | |
| 1. | Ginger Blue | 59.29% | 0.63%(+58.7)#-1 | 3.25%(+56.0)#0 |
| 2. | La Monte | 25.95% | 0.63%(+25.3)#0 | 3.25%(+22.7)#1 |
| 3. | Senath | 19.91% | 0.63%(+19.3)#1 | 3.25%(+16.7)#2 |
| 4. | Dennis Acres | 19.23% | 0.63%(+18.6)#2 | 3.25%(+16.0)#3 |
| 5. | Southwest City | 17.21% | 0.63%(+16.6)#3 | 3.25%(+14.0)#4 |
| 6. | Butterfield | 17.03% | 0.63%(+16.4)#4 | 3.25%(+13.8)#5 |
| 7. | Noel | 16.06% | 0.63%(+15.4)#5 | 3.25%(+12.8)#6 |
| 8. | Brooklyn Heights | 14.16% | 0.63%(+13.5)#6 | 3.25%(+10.9)#7 |
| 9. | Winchester | 13.10% | 0.63%(+12.5)#7 | 3.25%(+9.85)#8 |
| 10. | Purdy | 12.30% | 0.63%(+11.7)#8 | 3.25%(+9.05)#9 |
| 11. | Verona | 12.13% | 0.63%(+11.5)#9 | 3.25%(+8.88)#10 |
| 12. | Milan | 10.46% | 0.63%(+9.83)#10 | 3.25%(+7.21)#11 |
| 13. | Lanagan | 10.39% | 0.63%(+9.77)#11 | 3.25%(+7.14)#12 |
| 14. | Baldwin Park | 8.70% | 0.63%(+8.07)#12 | 3.25%(+5.44)#13 |
| 15. | Clarkton | 8.41% | 0.63%(+7.78)#13 | 3.25%(+5.16)#14 |
| 16. | Breckenridge Hills | 7.79% | 0.63%(+7.17)#14 | 3.25%(+4.54)#15 |
| 17. | Brandsville | 6.56% | 0.63%(+5.93)#15 | 3.25%(+3.31)#16 |
| 18. | Monett | 6.55% | 0.63%(+5.92)#16 | 3.25%(+3.30)#17 |
| 19. | Princeton | 5.62% | 0.63%(+4.99)#17 | 3.25%(+2.37)#18 |
| 20. | Stark City | 5.56% | 0.63%(+4.93)#18 | 3.25%(+2.30)#19 |
| 21. | Osgood | 5.56% | 0.63%(+4.93)#19 | 3.25%(+2.30)#20 |
| 22. | Livonia | 5.56% | 0.63%(+4.93)#20 | 3.25%(+2.30)#21 |
| 23. | Oaks | 5.46% | 0.63%(+4.84)#21 | 3.25%(+2.21)#22 |
| 24. | Lexington | 5.25% | 0.63%(+4.62)#22 | 3.25%(+2.00)#23 |
| 25. | Arbyrd | 4.67% | 0.63%(+4.05)#23 | 3.25%(+1.42)#24 |
| 26. | Trimble | 4.64% | 0.63%(+4.01)#24 | 3.25%(+1.38)#25 |
| 27. | New Haven | 4.61% | 0.63%(+3.98)#25 | 3.25%(+1.36)#26 |
| 28. | New Florence | 4.40% | 0.63%(+3.77)#26 | 3.25%(+1.15)#27 |
| 29. | Sedalia | 4.36% | 0.63%(+3.73)#27 | 3.25%(+1.11)#28 |
| 30. | Freistatt | 4.31% | 0.63%(+3.69)#28 | 3.25%(+1.06)#29 |
| 31. | New Hampton | 4.10% | 0.63%(+3.47)#29 | 3.25%(+0.849)#30 |
| 32. | Mindenmines | 3.88% | 0.63%(+3.25)#30 | 3.25%(+0.624)#31 |
| 33. | Green City | 3.86% | 0.63%(+3.23)#31 | 3.25%(+0.607)#32 |
| 34. | Northmoor | 3.69% | 0.63%(+3.07)#32 | 3.25%(+0.442)#33 |
| 35. | Claycomo | 3.53% | 0.63%(+2.90)#33 | 3.25%(+0.274)#34 |
| 36. | Edmundson | 3.51% | 0.63%(+2.89)#34 | 3.25%(+0.261)#35 |
| 37. | Waverly | 3.51% | 0.63%(+2.88)#35 | 3.25%(+0.259)#36 |
| 38. | Gilman City | 3.40% | 0.63%(+2.77)#36 | 3.25%(+0.146)#37 |
| 39. | Bridgeton | 3.40% | 0.63%(+2.77)#37 | 3.25%(+0.145)#38 |
| 40. | Carthage | 3.23% | 0.63%(+2.60)#38 | 3.25%(-0.024)#39 |
| 41. | California | 3.14% | 0.63%(+2.51)#39 | 3.25%(-0.110)#40 |
| 42. | Anderson | 3.05% | 0.63%(+2.42)#40 | 3.25%(-0.206)#41 |
| 43. | Vinita Park | 2.91% | 0.63%(+2.28)#41 | 3.25%(-0.344)#42 |
| 44. | Stover | 2.73% | 0.63%(+2.10)#42 | 3.25%(-0.527)#43 |
| 45. | Grandview | 2.71% | 0.63%(+2.09)#43 | 3.25%(-0.540)#44 |
| 46. | Oak Grove Village | 2.71% | 0.63%(+2.08)#44 | 3.25%(-0.542)#45 |
| 47. | Indian Point | 2.68% | 0.63%(+2.06)#45 | 3.25%(-0.567)#46 |
| 48. | Laredo | 2.59% | 0.63%(+1.96)#46 | 3.25%(-0.666)#47 |
| 49. | Breckenridge | 2.53% | 0.63%(+1.90)#47 | 3.25%(-0.723)#48 |
| 50. | Valley Park | 2.47% | 0.63%(+1.84)#48 | 3.25%(-0.784)#49 |
| 51. | Cuba | 2.43% | 0.63%(+1.80)#49 | 3.25%(-0.825)#50 |
| 52. | Freeburg | 2.33% | 0.63%(+1.70)#50 | 3.25%(-0.926)#51 |
| 53. | Seligman | 2.32% | 0.63%(+1.69)#51 | 3.25%(-0.934)#52 |
| 54. | Riverview Estates | 2.25% | 0.63%(+1.62)#52 | 3.25%(-1.00)#53 |
| 55. | Marshall | 2.14% | 0.63%(+1.51)#53 | 3.25%(-1.11)#54 |
| 56. | Kansas City | 2.10% | 0.63%(+1.47)#54 | 3.25%(-1.16)#55 |
| 57. | Brumley | 2.08% | 0.63%(+1.46)#55 | 3.25%(-1.17)#56 |
| 58. | Cardwell | 2.08% | 0.63%(+1.45)#56 | 3.25%(-1.17)#57 |
| 59. | Blue Summit | 2.05% | 0.63%(+1.42)#57 | 3.25%(-1.21)#58 |
| 60. | Woodson Terrace | 2.00% | 0.63%(+1.38)#58 | 3.25%(-1.25)#59 |
| 61. | Bel Ridge | 1.82% | 0.63%(+1.20)#59 | 3.25%(-1.43)#60 |
| 62. | Osage Beach | 1.77% | 0.63%(+1.15)#60 | 3.25%(-1.48)#61 |
| 63. | Platte City | 1.76% | 0.63%(+1.13)#61 | 3.25%(-1.49)#62 |
| 64. | St Ann | 1.75% | 0.63%(+1.12)#62 | 3.25%(-1.50)#63 |
| 65. | Marionville | 1.72% | 0.63%(+1.10)#63 | 3.25%(-1.53)#64 |
| 66. | Kinloch | 1.72% | 0.63%(+1.09)#64 | 3.25%(-1.53)#65 |
| 67. | Holcomb | 1.70% | 0.63%(+1.07)#65 | 3.25%(-1.55)#66 |
| 68. | Saddlebrooke | 1.59% | 0.63%(+0.966)#66 | 3.25%(-1.66)#67 |
| 69. | Gladstone | 1.57% | 0.63%(+0.938)#67 | 3.25%(-1.69)#68 |
| 70. | Riverside | 1.54% | 0.63%(+0.917)#68 | 3.25%(-1.71)#69 |
| 71. | Independence | 1.53% | 0.63%(+0.902)#69 | 3.25%(-1.72)#70 |
| 72. | Fountain N Lakes | 1.52% | 0.63%(+0.888)#70 | 3.25%(-1.74)#71 |
| 73. | Centertown | 1.51% | 0.63%(+0.884)#71 | 3.25%(-1.74)#72 |
| 74. | Neosho | 1.50% | 0.63%(+0.873)#72 | 3.25%(-1.75)#73 |
| 75. | Willard | 1.48% | 0.63%(+0.856)#73 | 3.25%(-1.77)#74 |
| 76. | Cooter | 1.46% | 0.63%(+0.831)#74 | 3.25%(-1.79)#75 |
| 77. | Caruthersville | 1.45% | 0.63%(+0.827)#75 | 3.25%(-1.80)#76 |
| 78. | Harrisonville | 1.44% | 0.63%(+0.810)#76 | 3.25%(-1.82)#77 |
| 79. | Lake St. Clair | 1.42% | 0.63%(+0.793)#77 | 3.25%(-1.83)#78 |
| 80. | Malden | 1.40% | 0.63%(+0.772)#78 | 3.25%(-1.85)#79 |
| 81. | Clarksburg | 1.37% | 0.63%(+0.739)#79 | 3.25%(-1.89)#80 |
| 82. | Scotsdale | 1.36% | 0.63%(+0.734)#80 | 3.25%(-1.89)#81 |
| 83. | Imperial | 1.36% | 0.63%(+0.729)#81 | 3.25%(-1.90)#82 |
| 84. | Laddonia | 1.34% | 0.63%(+0.715)#82 | 3.25%(-1.91)#83 |
| 85. | Shoal Creek Drive | 1.34% | 0.63%(+0.711)#83 | 3.25%(-1.91)#84 |
| 86. | Goodman | 1.33% | 0.63%(+0.699)#84 | 3.25%(-1.93)#85 |
| 87. | Loma Linda | 1.32% | 0.63%(+0.692)#85 | 3.25%(-1.93)#86 |
| 88. | Kennett | 1.25% | 0.63%(+0.625)#86 | 3.25%(-2.00)#87 |
| 89. | Holden | 1.20% | 0.63%(+0.569)#87 | 3.25%(-2.06)#88 |
| 90. | Fort Leonard Wood | 1.17% | 0.63%(+0.545)#88 | 3.25%(-2.08)#89 |
| 91. | St Joseph | 1.16% | 0.63%(+0.533)#89 | 3.25%(-2.09)#90 |
| 92. | Ozark | 1.14% | 0.63%(+0.510)#90 | 3.25%(-2.11)#91 |
| 93. | Carterville | 1.08% | 0.63%(+0.450)#91 | 3.25%(-2.18)#92 |
| 94. | Westboro | 1.04% | 0.63%(+0.415)#92 | 3.25%(-2.21)#93 |
| 95. | Raytown | 1.04% | 0.63%(+0.411)#93 | 3.25%(-2.21)#94 |
| 96. | Vandalia | 1.03% | 0.63%(+0.408)#94 | 3.25%(-2.22)#95 |
| 97. | Charlack | 1.03% | 0.63%(+0.408)#95 | 3.25%(-2.22)#96 |
| 98. | Higginsville | 1.03% | 0.63%(+0.399)#96 | 3.25%(-2.23)#97 |
| 99. | Overland | 1.02% | 0.63%(+0.390)#97 | 3.25%(-2.24)#98 |
| 100. | Republic | 1.01% | 0.63%(+0.388)#98 | 3.25%(-2.24)#99 |
Common Questions
What are the Top 10 Cities with the Highest Percentage of Immigrants from Mexico in Missouri?
Top 10 Cities with the Highest Percentage of Immigrants from Mexico in Missouri are:
#1
59.29%
#2
25.95%
#3
19.91%
#4
19.23%
#5
17.21%
#6
17.03%
#7
16.06%
#8
14.16%
#9
13.10%
#10
12.30%
What city has the Highest Percentage of Immigrants from Mexico in Missouri?
Ginger Blue has the Highest Percentage of Immigrants from Mexico in Missouri with 59.29%.
What is the Percentage of Immigrants from Mexico in the State of Missouri?
Percentage of Immigrants from Mexico in Missouri is 0.63%.
What is the Percentage of Immigrants from Mexico in the United States?
Percentage of Immigrants from Mexico in the United States is 3.25%.