Cities with the Highest Percentage of Immigrants from Dominican Republic in New Jersey
RELATED REPORTS & OPTIONS
Dominican Republic
New Jersey
Compare Cities
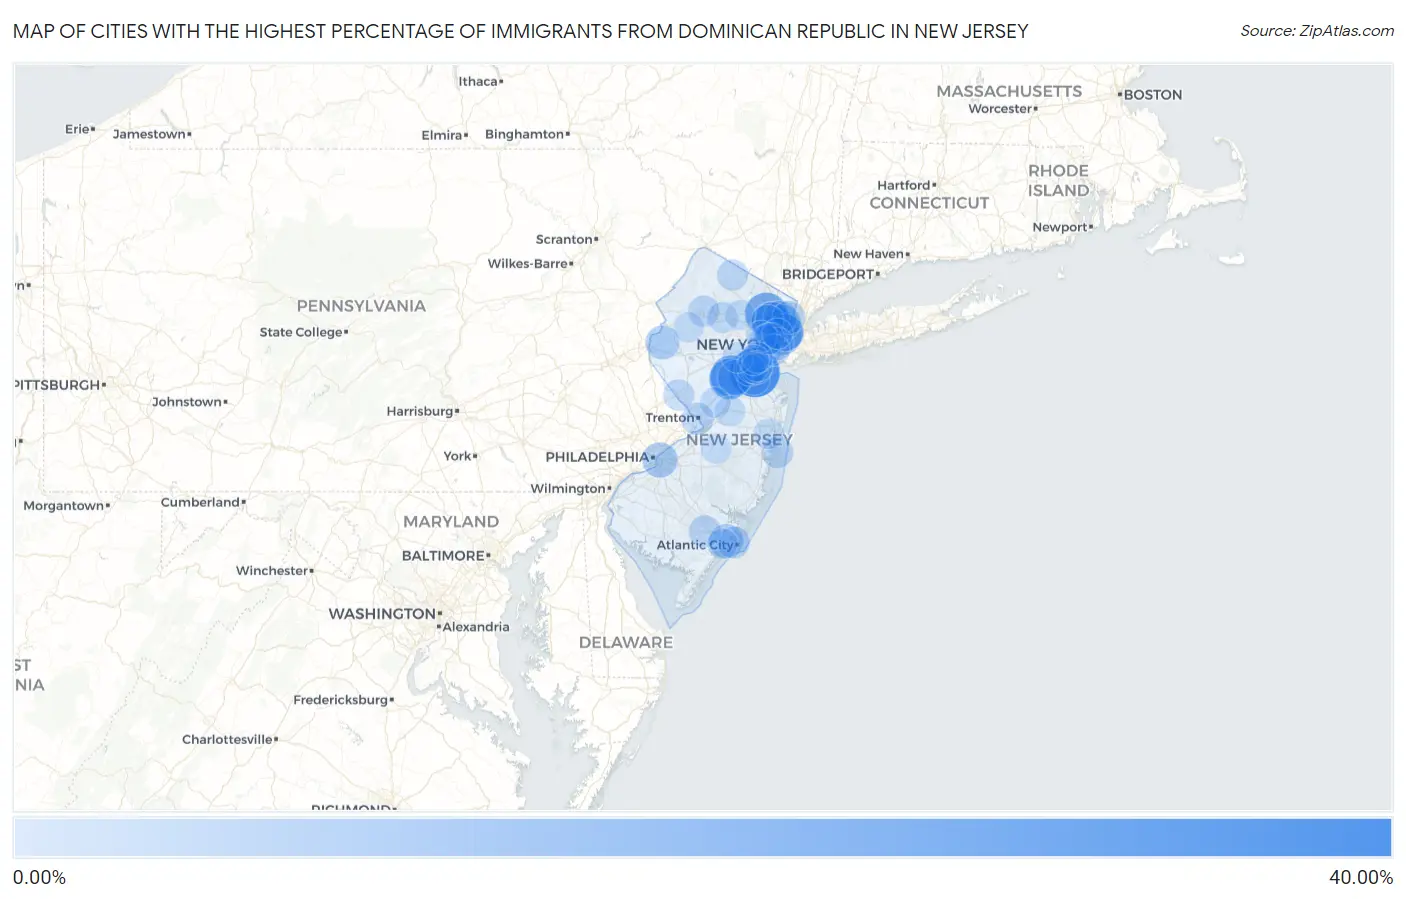
Map of Cities with the Highest Percentage of Immigrants from Dominican Republic in New Jersey
0.00%
40.00%
Cities with the Highest Percentage of Immigrants from Dominican Republic in New Jersey
| City | Dominican Republic | vs State | vs National | |
| 1. | Perth Amboy | 30.42% | 2.26%(+28.2)#-1 | 0.37%(+30.1)#0 |
| 2. | Paterson | 19.54% | 2.26%(+17.3)#0 | 0.37%(+19.2)#1 |
| 3. | East Franklin | 18.55% | 2.26%(+16.3)#1 | 0.37%(+18.2)#2 |
| 4. | Voorhees | 17.35% | 2.26%(+15.1)#2 | 0.37%(+17.0)#3 |
| 5. | Keasbey | 16.58% | 2.26%(+14.3)#3 | 0.37%(+16.2)#4 |
| 6. | Passaic | 16.03% | 2.26%(+13.8)#4 | 0.37%(+15.7)#5 |
| 7. | Union City | 12.11% | 2.26%(+9.85)#5 | 0.37%(+11.7)#6 |
| 8. | Guttenberg | 12.10% | 2.26%(+9.83)#6 | 0.37%(+11.7)#7 |
| 9. | West New York | 10.93% | 2.26%(+8.67)#7 | 0.37%(+10.6)#8 |
| 10. | Prospect Park Borough | 10.38% | 2.26%(+8.12)#8 | 0.37%(+10.0)#9 |
| 11. | Ridgefield Park | 9.85% | 2.26%(+7.59)#9 | 0.37%(+9.49)#10 |
| 12. | Camden | 8.66% | 2.26%(+6.40)#10 | 0.37%(+8.29)#11 |
| 13. | New Brunswick | 8.22% | 2.26%(+5.96)#11 | 0.37%(+7.85)#12 |
| 14. | Bogota Borough | 7.86% | 2.26%(+5.60)#12 | 0.37%(+7.49)#13 |
| 15. | Pleasantville | 7.68% | 2.26%(+5.42)#13 | 0.37%(+7.31)#14 |
| 16. | Garfield | 7.26% | 2.26%(+5.00)#14 | 0.37%(+6.90)#15 |
| 17. | New Village | 6.96% | 2.26%(+4.70)#15 | 0.37%(+6.59)#16 |
| 18. | Haledon Borough | 6.66% | 2.26%(+4.40)#16 | 0.37%(+6.29)#17 |
| 19. | Elizabeth | 6.44% | 2.26%(+4.18)#17 | 0.37%(+6.07)#18 |
| 20. | Hackensack | 6.30% | 2.26%(+4.04)#18 | 0.37%(+5.94)#19 |
| 21. | Woodlynne Borough | 6.06% | 2.26%(+3.80)#19 | 0.37%(+5.69)#20 |
| 22. | Englewood | 5.63% | 2.26%(+3.37)#20 | 0.37%(+5.26)#21 |
| 23. | Fairview Borough | 5.34% | 2.26%(+3.08)#21 | 0.37%(+4.97)#22 |
| 24. | Little Ferry Borough | 5.31% | 2.26%(+3.05)#22 | 0.37%(+4.94)#23 |
| 25. | Elmwood Park Borough | 5.17% | 2.26%(+2.91)#23 | 0.37%(+4.80)#24 |
| 26. | Clifton | 5.12% | 2.26%(+2.86)#24 | 0.37%(+4.75)#25 |
| 27. | Newtonville | 4.95% | 2.26%(+2.69)#25 | 0.37%(+4.58)#26 |
| 28. | South Toms River Borough | 4.86% | 2.26%(+2.60)#26 | 0.37%(+4.49)#27 |
| 29. | Wharton Borough | 4.41% | 2.26%(+2.15)#27 | 0.37%(+4.04)#28 |
| 30. | Atlantic City | 4.39% | 2.26%(+2.13)#28 | 0.37%(+4.02)#29 |
| 31. | Ampere North | 4.38% | 2.26%(+2.12)#29 | 0.37%(+4.01)#30 |
| 32. | Trenton | 4.33% | 2.26%(+2.07)#30 | 0.37%(+3.96)#31 |
| 33. | Mays Landing | 4.22% | 2.26%(+1.96)#31 | 0.37%(+3.85)#32 |
| 34. | Jersey City | 4.17% | 2.26%(+1.90)#32 | 0.37%(+3.80)#33 |
| 35. | Newark | 4.13% | 2.26%(+1.87)#33 | 0.37%(+3.76)#34 |
| 36. | South Amboy | 4.10% | 2.26%(+1.84)#34 | 0.37%(+3.73)#35 |
| 37. | Moonachie Borough | 4.07% | 2.26%(+1.81)#35 | 0.37%(+3.70)#36 |
| 38. | Lodi Borough | 4.05% | 2.26%(+1.79)#36 | 0.37%(+3.69)#37 |
| 39. | Silver Lake Cdp Essex County | 4.04% | 2.26%(+1.78)#37 | 0.37%(+3.67)#38 |
| 40. | Hasbrouck Heights Borough | 3.83% | 2.26%(+1.57)#38 | 0.37%(+3.46)#39 |
| 41. | Kearny | 3.81% | 2.26%(+1.55)#39 | 0.37%(+3.45)#40 |
| 42. | Hopelawn | 3.78% | 2.26%(+1.52)#40 | 0.37%(+3.41)#41 |
| 43. | Watsessing | 3.67% | 2.26%(+1.41)#41 | 0.37%(+3.30)#42 |
| 44. | Bayonne | 3.59% | 2.26%(+1.33)#42 | 0.37%(+3.22)#43 |
| 45. | Cliffside Park Borough | 3.50% | 2.26%(+1.24)#43 | 0.37%(+3.13)#44 |
| 46. | Dover Beaches North | 3.48% | 2.26%(+1.22)#44 | 0.37%(+3.11)#45 |
| 47. | Hawthorne Borough | 3.45% | 2.26%(+1.19)#45 | 0.37%(+3.08)#46 |
| 48. | Byram Center | 3.45% | 2.26%(+1.19)#46 | 0.37%(+3.08)#47 |
| 49. | Fords | 3.42% | 2.26%(+1.16)#47 | 0.37%(+3.05)#48 |
| 50. | Rockaway Borough | 3.40% | 2.26%(+1.14)#48 | 0.37%(+3.03)#49 |
| 51. | Bergenfield Borough | 3.20% | 2.26%(+0.943)#49 | 0.37%(+2.83)#50 |
| 52. | Roselle Borough | 3.19% | 2.26%(+0.931)#50 | 0.37%(+2.82)#51 |
| 53. | Carteret Borough | 3.17% | 2.26%(+0.911)#51 | 0.37%(+2.80)#52 |
| 54. | Absecon Highlands | 3.04% | 2.26%(+0.775)#52 | 0.37%(+2.67)#53 |
| 55. | Highland Lakes | 2.98% | 2.26%(+0.723)#53 | 0.37%(+2.61)#54 |
| 56. | Lambertville | 2.91% | 2.26%(+0.647)#54 | 0.37%(+2.54)#55 |
| 57. | New Milford Borough | 2.88% | 2.26%(+0.617)#55 | 0.37%(+2.51)#56 |
| 58. | Woodbridge | 2.88% | 2.26%(+0.616)#56 | 0.37%(+2.51)#57 |
| 59. | East Rutherford Borough | 2.84% | 2.26%(+0.584)#57 | 0.37%(+2.47)#58 |
| 60. | Point Pleasant Beach Borough | 2.84% | 2.26%(+0.581)#58 | 0.37%(+2.47)#59 |
| 61. | East Orange | 2.68% | 2.26%(+0.421)#59 | 0.37%(+2.31)#60 |
| 62. | Dover | 2.66% | 2.26%(+0.404)#60 | 0.37%(+2.30)#61 |
| 63. | Victory Gardens Borough | 2.61% | 2.26%(+0.352)#61 | 0.37%(+2.24)#62 |
| 64. | Sayreville Borough | 2.61% | 2.26%(+0.352)#62 | 0.37%(+2.24)#63 |
| 65. | Harrison | 2.60% | 2.26%(+0.336)#63 | 0.37%(+2.23)#64 |
| 66. | Lindenwold Borough | 2.57% | 2.26%(+0.313)#64 | 0.37%(+2.20)#65 |
| 67. | Carlstadt Borough | 2.26% | 2.26%(-0.005)#65 | 0.37%(+1.89)#66 |
| 68. | Sewaren | 2.23% | 2.26%(-0.034)#66 | 0.37%(+1.86)#67 |
| 69. | Princeton Junction | 2.23% | 2.26%(-0.035)#67 | 0.37%(+1.86)#68 |
| 70. | Ramtown | 2.20% | 2.26%(-0.062)#68 | 0.37%(+1.83)#69 |
| 71. | Plainfield | 2.18% | 2.26%(-0.082)#69 | 0.37%(+1.81)#70 |
| 72. | Wallington Borough | 2.04% | 2.26%(-0.216)#70 | 0.37%(+1.67)#71 |
| 73. | Butler Borough | 2.04% | 2.26%(-0.222)#71 | 0.37%(+1.67)#72 |
| 74. | North Arlington Borough | 2.04% | 2.26%(-0.224)#72 | 0.37%(+1.67)#73 |
| 75. | Twin Rivers | 2.00% | 2.26%(-0.259)#73 | 0.37%(+1.63)#74 |
| 76. | Keyport Borough | 1.96% | 2.26%(-0.299)#74 | 0.37%(+1.59)#75 |
| 77. | Bedminster | 1.95% | 2.26%(-0.312)#75 | 0.37%(+1.58)#76 |
| 78. | Demarest Borough | 1.91% | 2.26%(-0.354)#76 | 0.37%(+1.54)#77 |
| 79. | Woodland Park Borough | 1.89% | 2.26%(-0.372)#77 | 0.37%(+1.52)#78 |
| 80. | Maywood Borough | 1.86% | 2.26%(-0.398)#78 | 0.37%(+1.49)#79 |
| 81. | Lakehurst Borough | 1.85% | 2.26%(-0.413)#79 | 0.37%(+1.48)#80 |
| 82. | Port Reading | 1.83% | 2.26%(-0.429)#80 | 0.37%(+1.46)#81 |
| 83. | Secaucus | 1.81% | 2.26%(-0.453)#81 | 0.37%(+1.44)#82 |
| 84. | Beattystown | 1.77% | 2.26%(-0.494)#82 | 0.37%(+1.40)#83 |
| 85. | Linden | 1.75% | 2.26%(-0.512)#83 | 0.37%(+1.38)#84 |
| 86. | Dumont Borough | 1.74% | 2.26%(-0.523)#84 | 0.37%(+1.37)#85 |
| 87. | Wood Ridge Borough | 1.72% | 2.26%(-0.536)#85 | 0.37%(+1.35)#86 |
| 88. | Boonton | 1.69% | 2.26%(-0.575)#86 | 0.37%(+1.32)#87 |
| 89. | Rahway | 1.65% | 2.26%(-0.612)#87 | 0.37%(+1.28)#88 |
| 90. | North Plainfield Borough | 1.64% | 2.26%(-0.617)#88 | 0.37%(+1.27)#89 |
| 91. | Raritan Borough | 1.61% | 2.26%(-0.646)#89 | 0.37%(+1.24)#90 |
| 92. | Palisades Park Borough | 1.58% | 2.26%(-0.679)#90 | 0.37%(+1.21)#91 |
| 93. | Northfield | 1.55% | 2.26%(-0.707)#91 | 0.37%(+1.18)#92 |
| 94. | Fort Dix | 1.54% | 2.26%(-0.718)#92 | 0.37%(+1.17)#93 |
| 95. | Mckee | 1.52% | 2.26%(-0.744)#93 | 0.37%(+1.15)#94 |
| 96. | Highland Park Borough | 1.48% | 2.26%(-0.780)#94 | 0.37%(+1.11)#95 |
| 97. | Keansburg Borough | 1.48% | 2.26%(-0.785)#95 | 0.37%(+1.11)#96 |
| 98. | Ridgefield Borough | 1.47% | 2.26%(-0.795)#96 | 0.37%(+1.10)#97 |
| 99. | Ringwood Borough | 1.46% | 2.26%(-0.798)#97 | 0.37%(+1.09)#98 |
| 100. | Fort Lee Borough | 1.41% | 2.26%(-0.851)#98 | 0.37%(+1.04)#99 |
Common Questions
What are the Top 10 Cities with the Highest Percentage of Immigrants from Dominican Republic in New Jersey?
Top 10 Cities with the Highest Percentage of Immigrants from Dominican Republic in New Jersey are:
#1
30.42%
#2
19.54%
#3
18.55%
#4
17.35%
#5
16.03%
#6
12.11%
#7
12.10%
#8
10.93%
#9
9.85%
#10
8.66%
What city has the Highest Percentage of Immigrants from Dominican Republic in New Jersey?
Perth Amboy has the Highest Percentage of Immigrants from Dominican Republic in New Jersey with 30.42%.
What is the Percentage of Immigrants from Dominican Republic in the State of New Jersey?
Percentage of Immigrants from Dominican Republic in New Jersey is 2.26%.
What is the Percentage of Immigrants from Dominican Republic in the United States?
Percentage of Immigrants from Dominican Republic in the United States is 0.37%.