Cities with the Most Immigrants from Latin America in Kansas
RELATED REPORTS & OPTIONS
Latin America
Kansas
Compare Cities
Map of Cities with the Most Immigrants from Latin America in Kansas
0
25,000
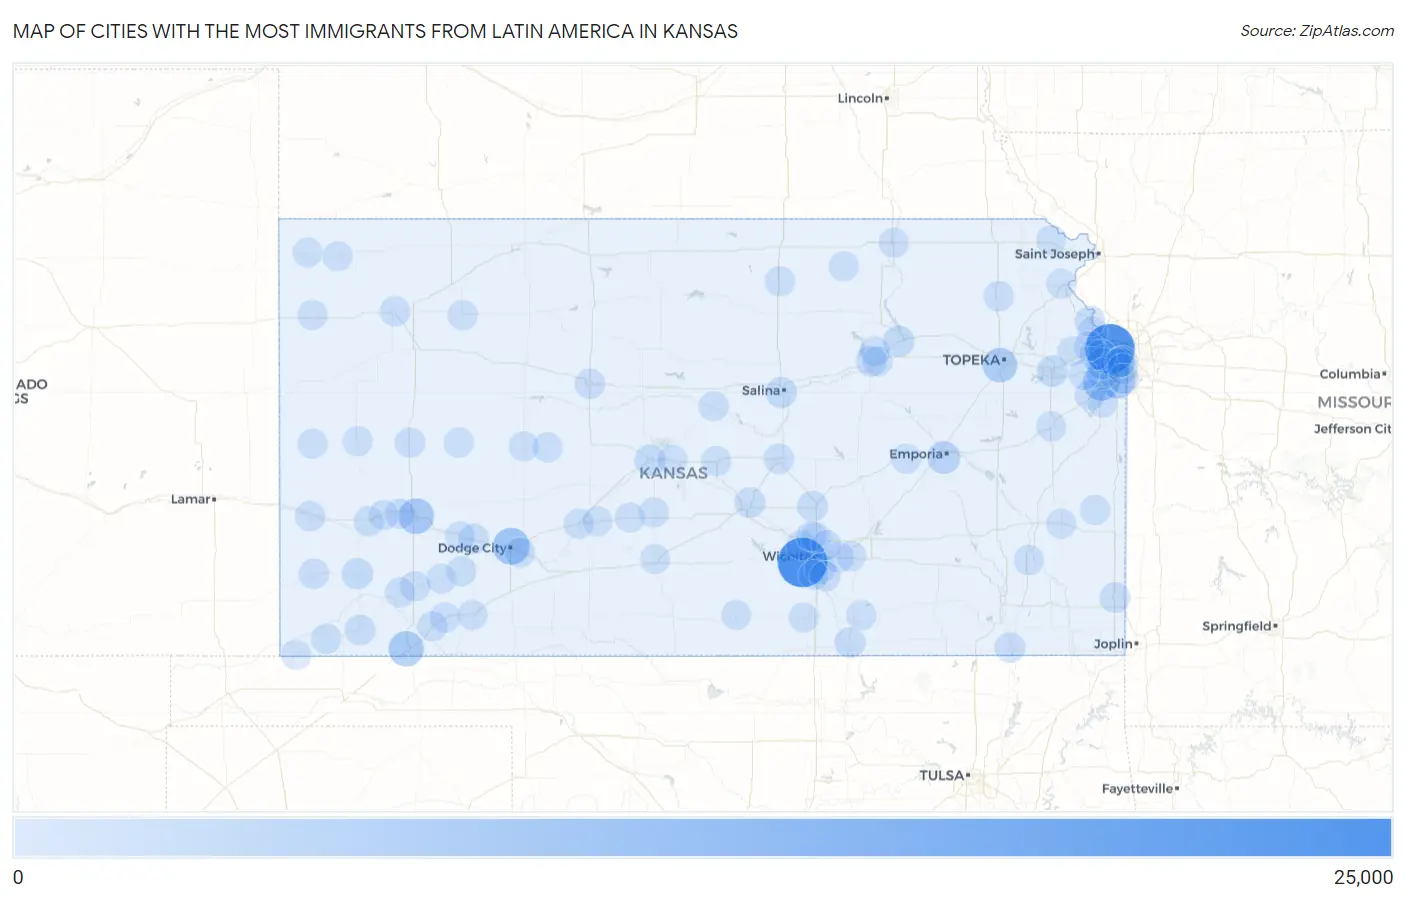
Cities with the Most Immigrants from Latin America in Kansas
| City | Latin America | vs State | vs National | |
| 1. | Wichita | 20,134 | 108,917(18.49%)#1 | 22,649,518(0.09%)#152 |
| 2. | Kansas City | 20,068 | 108,917(18.43%)#2 | 22,649,518(0.09%)#154 |
| 3. | Dodge City | 6,725 | 108,917(6.17%)#3 | 22,649,518(0.03%)#505 |
| 4. | Olathe | 6,333 | 108,917(5.81%)#4 | 22,649,518(0.03%)#534 |
| 5. | Garden City | 5,502 | 108,917(5.05%)#5 | 22,649,518(0.02%)#612 |
| 6. | Liberal | 5,070 | 108,917(4.65%)#6 | 22,649,518(0.02%)#671 |
| 7. | Overland Park | 4,512 | 108,917(4.14%)#7 | 22,649,518(0.02%)#729 |
| 8. | Topeka | 4,454 | 108,917(4.09%)#8 | 22,649,518(0.02%)#733 |
| 9. | Emporia | 2,747 | 108,917(2.52%)#9 | 22,649,518(0.01%)#1,071 |
| 10. | Lenexa | 1,569 | 108,917(1.44%)#10 | 22,649,518(0.01%)#1,573 |
| 11. | Shawnee | 1,533 | 108,917(1.41%)#11 | 22,649,518(0.01%)#1,592 |
| 12. | Lawrence | 1,235 | 108,917(1.13%)#12 | 22,649,518(0.01%)#1,868 |
| 13. | Manhattan | 1,176 | 108,917(1.08%)#13 | 22,649,518(0.01%)#1,933 |
| 14. | Ulysses | 1,154 | 108,917(1.06%)#14 | 22,649,518(0.01%)#1,958 |
| 15. | Salina | 1,107 | 108,917(1.02%)#15 | 22,649,518(0.00%)#2,004 |
| 16. | Great Bend | 863 | 108,917(0.79%)#16 | 22,649,518(0.00%)#2,342 |
| 17. | Junction City | 688 | 108,917(0.63%)#17 | 22,649,518(0.00%)#2,713 |
| 18. | Arkansas City | 677 | 108,917(0.62%)#18 | 22,649,518(0.00%)#2,737 |
| 19. | Hutchinson | 645 | 108,917(0.59%)#19 | 22,649,518(0.00%)#2,803 |
| 20. | Pittsburg | 598 | 108,917(0.55%)#20 | 22,649,518(0.00%)#2,932 |
| 21. | Hugoton | 558 | 108,917(0.51%)#21 | 22,649,518(0.00%)#3,074 |
| 22. | Newton | 528 | 108,917(0.48%)#22 | 22,649,518(0.00%)#3,187 |
| 23. | Gardner | 499 | 108,917(0.46%)#23 | 22,649,518(0.00%)#3,281 |
| 24. | Oaklawn Sunview | 453 | 108,917(0.42%)#24 | 22,649,518(0.00%)#3,462 |
| 25. | Andover | 437 | 108,917(0.40%)#25 | 22,649,518(0.00%)#3,546 |
| 26. | Mcpherson | 412 | 108,917(0.38%)#26 | 22,649,518(0.00%)#3,665 |
| 27. | Merriam | 411 | 108,917(0.38%)#27 | 22,649,518(0.00%)#3,676 |
| 28. | Derby | 401 | 108,917(0.37%)#28 | 22,649,518(0.00%)#3,707 |
| 29. | Sublette | 348 | 108,917(0.32%)#29 | 22,649,518(0.00%)#4,029 |
| 30. | Johnson City | 323 | 108,917(0.30%)#30 | 22,649,518(0.00%)#4,187 |
| 31. | Plains | 300 | 108,917(0.28%)#31 | 22,649,518(0.00%)#4,331 |
| 32. | Coffeyville | 296 | 108,917(0.27%)#32 | 22,649,518(0.00%)#4,359 |
| 33. | Scott City | 293 | 108,917(0.27%)#33 | 22,649,518(0.00%)#4,384 |
| 34. | Leavenworth | 279 | 108,917(0.26%)#34 | 22,649,518(0.00%)#4,477 |
| 35. | Holton | 276 | 108,917(0.25%)#35 | 22,649,518(0.00%)#4,507 |
| 36. | Park City | 269 | 108,917(0.25%)#36 | 22,649,518(0.00%)#4,557 |
| 37. | Bonner Springs | 261 | 108,917(0.24%)#37 | 22,649,518(0.00%)#4,620 |
| 38. | Edwardsville | 259 | 108,917(0.24%)#38 | 22,649,518(0.00%)#4,633 |
| 39. | Roeland Park | 254 | 108,917(0.23%)#39 | 22,649,518(0.00%)#4,670 |
| 40. | Colby | 249 | 108,917(0.23%)#40 | 22,649,518(0.00%)#4,716 |
| 41. | Hays | 244 | 108,917(0.22%)#41 | 22,649,518(0.00%)#4,754 |
| 42. | Wilroads Gardens | 227 | 108,917(0.21%)#42 | 22,649,518(0.00%)#4,934 |
| 43. | Syracuse | 219 | 108,917(0.20%)#43 | 22,649,518(0.00%)#5,012 |
| 44. | Holcomb | 211 | 108,917(0.19%)#44 | 22,649,518(0.00%)#5,107 |
| 45. | Rolla | 211 | 108,917(0.19%)#45 | 22,649,518(0.00%)#5,112 |
| 46. | Lyons | 196 | 108,917(0.18%)#46 | 22,649,518(0.00%)#5,281 |
| 47. | Montezuma | 187 | 108,917(0.17%)#47 | 22,649,518(0.00%)#5,409 |
| 48. | Lakin | 178 | 108,917(0.16%)#48 | 22,649,518(0.00%)#5,528 |
| 49. | Cimarron | 175 | 108,917(0.16%)#49 | 22,649,518(0.00%)#5,583 |
| 50. | Prairie Village | 171 | 108,917(0.16%)#50 | 22,649,518(0.00%)#5,628 |
| 51. | Leawood | 169 | 108,917(0.16%)#51 | 22,649,518(0.00%)#5,670 |
| 52. | Satanta | 165 | 108,917(0.15%)#52 | 22,649,518(0.00%)#5,760 |
| 53. | De Soto | 163 | 108,917(0.15%)#53 | 22,649,518(0.00%)#5,786 |
| 54. | Deerfield | 162 | 108,917(0.15%)#54 | 22,649,518(0.00%)#5,808 |
| 55. | Maize | 156 | 108,917(0.14%)#55 | 22,649,518(0.00%)#5,889 |
| 56. | Augusta | 154 | 108,917(0.14%)#56 | 22,649,518(0.00%)#5,913 |
| 57. | Leoti | 153 | 108,917(0.14%)#57 | 22,649,518(0.00%)#5,935 |
| 58. | Fort Riley | 146 | 108,917(0.13%)#58 | 22,649,518(0.00%)#6,058 |
| 59. | Kinsley | 140 | 108,917(0.13%)#59 | 22,649,518(0.00%)#6,176 |
| 60. | Lansing | 131 | 108,917(0.12%)#60 | 22,649,518(0.00%)#6,323 |
| 61. | Moran | 131 | 108,917(0.12%)#61 | 22,649,518(0.00%)#6,335 |
| 62. | Chanute | 119 | 108,917(0.11%)#62 | 22,649,518(0.00%)#6,582 |
| 63. | Ottawa | 116 | 108,917(0.11%)#63 | 22,649,518(0.00%)#6,647 |
| 64. | Goodland | 114 | 108,917(0.10%)#64 | 22,649,518(0.00%)#6,698 |
| 65. | Tribune | 111 | 108,917(0.10%)#65 | 22,649,518(0.00%)#6,769 |
| 66. | Ness City | 109 | 108,917(0.10%)#66 | 22,649,518(0.00%)#6,815 |
| 67. | Kismet | 108 | 108,917(0.10%)#67 | 22,649,518(0.00%)#6,842 |
| 68. | St John | 106 | 108,917(0.10%)#68 | 22,649,518(0.00%)#6,891 |
| 69. | Atchison | 98 | 108,917(0.09%)#69 | 22,649,518(0.00%)#7,074 |
| 70. | Mission | 98 | 108,917(0.09%)#70 | 22,649,518(0.00%)#7,075 |
| 71. | Valley Center | 98 | 108,917(0.09%)#71 | 22,649,518(0.00%)#7,078 |
| 72. | Tonganoxie | 95 | 108,917(0.09%)#72 | 22,649,518(0.00%)#7,152 |
| 73. | Concordia | 92 | 108,917(0.08%)#73 | 22,649,518(0.00%)#7,243 |
| 74. | Bel Aire | 91 | 108,917(0.08%)#74 | 22,649,518(0.00%)#7,273 |
| 75. | Winfield | 88 | 108,917(0.08%)#75 | 22,649,518(0.00%)#7,369 |
| 76. | Macksville | 80 | 108,917(0.07%)#76 | 22,649,518(0.00%)#7,670 |
| 77. | Mapleton | 80 | 108,917(0.07%)#77 | 22,649,518(0.00%)#7,671 |
| 78. | Grandview Plaza | 74 | 108,917(0.07%)#78 | 22,649,518(0.00%)#7,851 |
| 79. | Harper | 74 | 108,917(0.07%)#79 | 22,649,518(0.00%)#7,859 |
| 80. | Lewis | 73 | 108,917(0.07%)#80 | 22,649,518(0.00%)#7,904 |
| 81. | Copeland | 70 | 108,917(0.06%)#81 | 22,649,518(0.00%)#8,007 |
| 82. | Wellington | 69 | 108,917(0.06%)#82 | 22,649,518(0.00%)#8,020 |
| 83. | Spring Hill | 64 | 108,917(0.06%)#83 | 22,649,518(0.00%)#8,223 |
| 84. | Bazine | 63 | 108,917(0.06%)#84 | 22,649,518(0.00%)#8,284 |
| 85. | Meade | 57 | 108,917(0.05%)#85 | 22,649,518(0.00%)#8,535 |
| 86. | Haysville | 56 | 108,917(0.05%)#86 | 22,649,518(0.00%)#8,550 |
| 87. | Pratt | 55 | 108,917(0.05%)#87 | 22,649,518(0.00%)#8,607 |
| 88. | St Francis | 54 | 108,917(0.05%)#88 | 22,649,518(0.00%)#8,700 |
| 89. | Basehor | 49 | 108,917(0.04%)#89 | 22,649,518(0.00%)#8,948 |
| 90. | Hoxie | 49 | 108,917(0.04%)#90 | 22,649,518(0.00%)#8,984 |
| 91. | Marysville | 48 | 108,917(0.04%)#91 | 22,649,518(0.00%)#9,030 |
| 92. | Ellsworth | 48 | 108,917(0.04%)#92 | 22,649,518(0.00%)#9,032 |
| 93. | Dighton | 47 | 108,917(0.04%)#93 | 22,649,518(0.00%)#9,132 |
| 94. | Bird City | 47 | 108,917(0.04%)#94 | 22,649,518(0.00%)#9,136 |
| 95. | Ellinwood | 45 | 108,917(0.04%)#95 | 22,649,518(0.00%)#9,233 |
| 96. | Elkhart | 44 | 108,917(0.04%)#96 | 22,649,518(0.00%)#9,309 |
| 97. | Linn | 43 | 108,917(0.04%)#97 | 22,649,518(0.00%)#9,373 |
| 98. | Ingalls | 42 | 108,917(0.04%)#98 | 22,649,518(0.00%)#9,438 |
| 99. | Cottonwood Falls | 41 | 108,917(0.04%)#99 | 22,649,518(0.00%)#9,509 |
| 100. | Highland | 40 | 108,917(0.04%)#100 | 22,649,518(0.00%)#9,562 |
Common Questions
What are the Top 10 Cities with the Most Immigrants from Latin America in Kansas?
Top 10 Cities with the Most Immigrants from Latin America in Kansas are:
#1
20,134
#2
20,068
#3
6,725
#4
6,333
#5
5,502
#6
5,070
#7
4,512
#8
4,454
#9
2,747
#10
1,569
What city has the Most Immigrants from Latin America in Kansas?
Wichita has the Most Immigrants from Latin America in Kansas with 20,134.
What is the Total Immigrants from Latin America in the State of Kansas?
Total Immigrants from Latin America in Kansas is 108,917.
What is the Total Immigrants from Latin America in the United States?
Total Immigrants from Latin America in the United States is 22,649,518.