Cities with the Most Immigrants from Latin America in West Virginia
RELATED REPORTS & OPTIONS
Latin America
West Virginia
Compare Cities
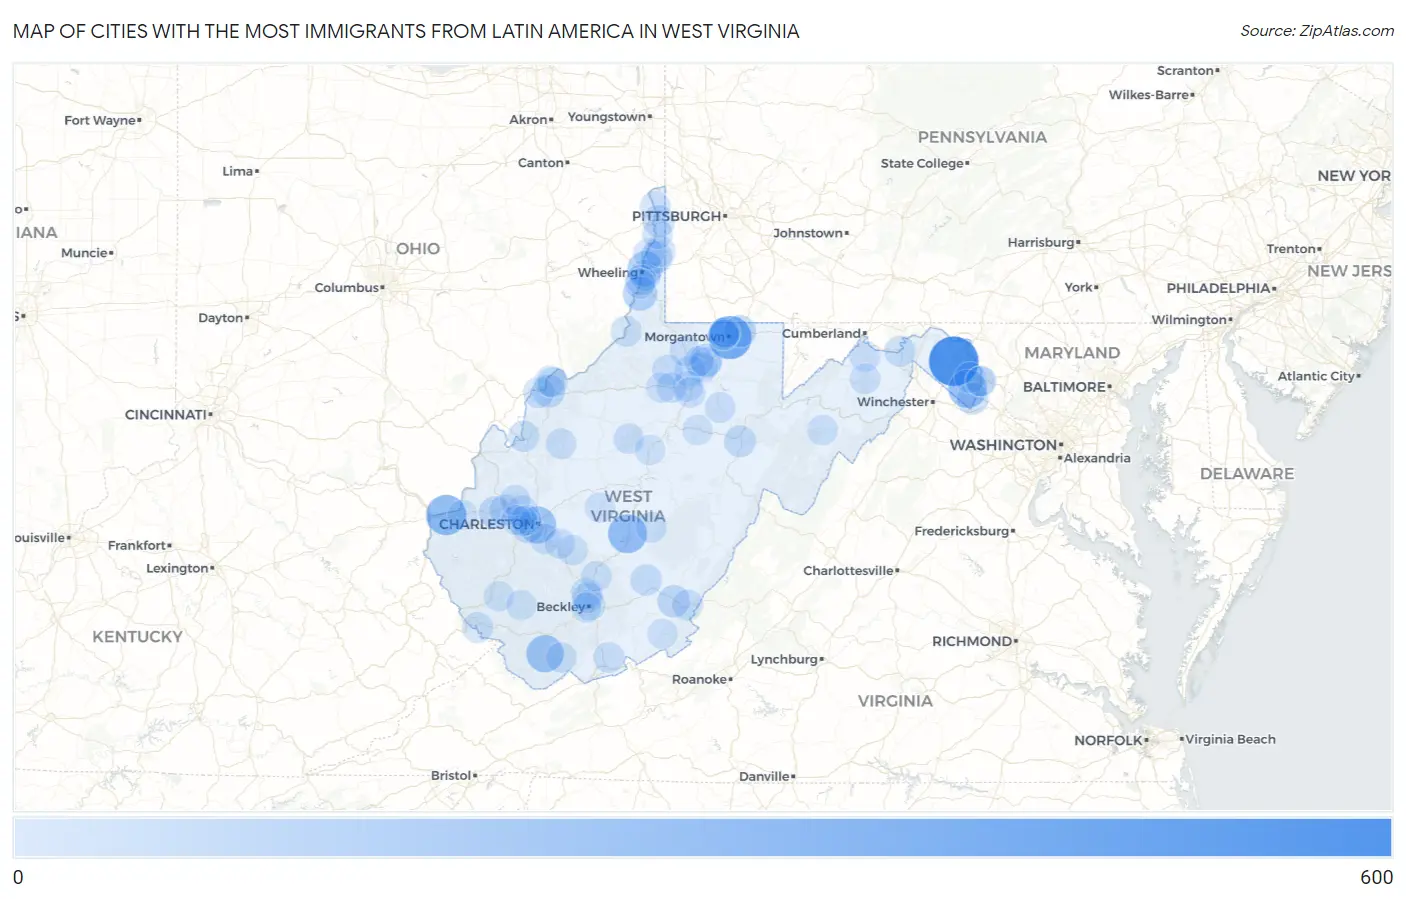
Map of Cities with the Most Immigrants from Latin America in West Virginia
0
600
Cities with the Most Immigrants from Latin America in West Virginia
| City | Latin America | vs State | vs National | |
| 1. | Martinsburg | 507 | 7,890(6.43%)#1 | 22,649,518(0.00%)#3,256 |
| 2. | Morgantown | 334 | 7,890(4.23%)#2 | 22,649,518(0.00%)#4,110 |
| 3. | Huntington | 258 | 7,890(3.27%)#3 | 22,649,518(0.00%)#4,637 |
| 4. | Summersville | 223 | 7,890(2.83%)#4 | 22,649,518(0.00%)#4,973 |
| 5. | Ranson Corporation | 221 | 7,890(2.80%)#5 | 22,649,518(0.00%)#4,993 |
| 6. | Charles Town | 205 | 7,890(2.60%)#6 | 22,649,518(0.00%)#5,177 |
| 7. | Welch | 180 | 7,890(2.28%)#7 | 22,649,518(0.00%)#5,490 |
| 8. | Charleston | 179 | 7,890(2.27%)#8 | 22,649,518(0.00%)#5,496 |
| 9. | Wheeling | 124 | 7,890(1.57%)#9 | 22,649,518(0.00%)#6,460 |
| 10. | Moundsville | 100 | 7,890(1.27%)#10 | 22,649,518(0.00%)#7,026 |
| 11. | Parkersburg | 60 | 7,890(0.76%)#11 | 22,649,518(0.00%)#8,374 |
| 12. | Fairmont | 56 | 7,890(0.71%)#12 | 22,649,518(0.00%)#8,548 |
| 13. | Hurricane | 54 | 7,890(0.68%)#13 | 22,649,518(0.00%)#8,664 |
| 14. | Lewisburg | 53 | 7,890(0.67%)#14 | 22,649,518(0.00%)#8,734 |
| 15. | West Liberty | 53 | 7,890(0.67%)#15 | 22,649,518(0.00%)#8,755 |
| 16. | Cheat Lake | 52 | 7,890(0.66%)#16 | 22,649,518(0.00%)#8,782 |
| 17. | Weirton | 45 | 7,890(0.57%)#17 | 22,649,518(0.00%)#9,202 |
| 18. | Elkins | 43 | 7,890(0.54%)#18 | 22,649,518(0.00%)#9,333 |
| 19. | Shannondale | 40 | 7,890(0.51%)#19 | 22,649,518(0.00%)#9,542 |
| 20. | South Charleston | 36 | 7,890(0.46%)#20 | 22,649,518(0.00%)#9,794 |
| 21. | Crooked Creek | 34 | 7,890(0.43%)#21 | 22,649,518(0.00%)#10,004 |
| 22. | Rupert | 33 | 7,890(0.42%)#22 | 22,649,518(0.00%)#10,071 |
| 23. | Cross Lanes | 32 | 7,890(0.41%)#23 | 22,649,518(0.00%)#10,111 |
| 24. | Shinnston | 32 | 7,890(0.41%)#24 | 22,649,518(0.00%)#10,150 |
| 25. | Granville | 32 | 7,890(0.41%)#25 | 22,649,518(0.00%)#10,164 |
| 26. | Teays Valley | 28 | 7,890(0.35%)#26 | 22,649,518(0.00%)#10,476 |
| 27. | Bethlehem | 28 | 7,890(0.35%)#27 | 22,649,518(0.00%)#10,510 |
| 28. | Bradley | 28 | 7,890(0.35%)#28 | 22,649,518(0.00%)#10,530 |
| 29. | Institute | 25 | 7,890(0.32%)#29 | 22,649,518(0.00%)#10,891 |
| 30. | Ravenswood | 23 | 7,890(0.29%)#30 | 22,649,518(0.00%)#11,071 |
| 31. | Blennerhassett | 23 | 7,890(0.29%)#31 | 22,649,518(0.00%)#11,073 |
| 32. | Paw Paw | 23 | 7,890(0.29%)#32 | 22,649,518(0.00%)#11,160 |
| 33. | White Sulphur Springs | 20 | 7,890(0.25%)#33 | 22,649,518(0.00%)#11,477 |
| 34. | Shenandoah Junction | 20 | 7,890(0.25%)#34 | 22,649,518(0.00%)#11,518 |
| 35. | Athens | 20 | 7,890(0.25%)#35 | 22,649,518(0.00%)#11,525 |
| 36. | Bethany | 19 | 7,890(0.24%)#36 | 22,649,518(0.00%)#11,655 |
| 37. | Matewan | 19 | 7,890(0.24%)#37 | 22,649,518(0.00%)#11,681 |
| 38. | Vienna | 18 | 7,890(0.23%)#38 | 22,649,518(0.00%)#11,710 |
| 39. | New Martinsville | 18 | 7,890(0.23%)#39 | 22,649,518(0.00%)#11,725 |
| 40. | Windsor Heights | 18 | 7,890(0.23%)#40 | 22,649,518(0.00%)#11,839 |
| 41. | Beckley | 17 | 7,890(0.22%)#41 | 22,649,518(0.00%)#11,881 |
| 42. | Philippi | 14 | 7,890(0.18%)#42 | 22,649,518(0.00%)#12,421 |
| 43. | Craigsville | 14 | 7,890(0.18%)#43 | 22,649,518(0.00%)#12,442 |
| 44. | Wallace | 14 | 7,890(0.18%)#44 | 22,649,518(0.00%)#12,526 |
| 45. | Prosperity | 13 | 7,890(0.16%)#45 | 22,649,518(0.00%)#12,614 |
| 46. | Glenville | 12 | 7,890(0.15%)#46 | 22,649,518(0.00%)#12,844 |
| 47. | Westover | 11 | 7,890(0.14%)#47 | 22,649,518(0.00%)#12,970 |
| 48. | Pleasant Valley | 11 | 7,890(0.14%)#48 | 22,649,518(0.00%)#12,976 |
| 49. | Fort Ashby | 11 | 7,890(0.14%)#49 | 22,649,518(0.00%)#13,050 |
| 50. | White Hall | 11 | 7,890(0.14%)#50 | 22,649,518(0.00%)#13,065 |
| 51. | Clarksburg | 10 | 7,890(0.13%)#51 | 22,649,518(0.00%)#13,161 |
| 52. | Oak Hill | 10 | 7,890(0.13%)#52 | 22,649,518(0.00%)#13,168 |
| 53. | Petersburg | 10 | 7,890(0.13%)#53 | 22,649,518(0.00%)#13,201 |
| 54. | Romney | 10 | 7,890(0.13%)#54 | 22,649,518(0.00%)#13,233 |
| 55. | Salem | 10 | 7,890(0.13%)#55 | 22,649,518(0.00%)#13,240 |
| 56. | Montgomery | 10 | 7,890(0.13%)#56 | 22,649,518(0.00%)#13,252 |
| 57. | Star City | 9 | 7,890(0.11%)#57 | 22,649,518(0.00%)#13,438 |
| 58. | Mannington | 9 | 7,890(0.11%)#58 | 22,649,518(0.00%)#13,456 |
| 59. | Benwood | 9 | 7,890(0.11%)#59 | 22,649,518(0.00%)#13,486 |
| 60. | Reedy | 9 | 7,890(0.11%)#60 | 22,649,518(0.00%)#13,605 |
| 61. | Wolf Summit | 9 | 7,890(0.11%)#61 | 22,649,518(0.00%)#13,607 |
| 62. | Hooverson Heights | 8 | 7,890(0.10%)#62 | 22,649,518(0.00%)#13,690 |
| 63. | Bancroft | 8 | 7,890(0.10%)#63 | 22,649,518(0.00%)#13,859 |
| 64. | Dunbar | 7 | 7,890(0.09%)#64 | 22,649,518(0.00%)#13,927 |
| 65. | Stonewood | 7 | 7,890(0.09%)#65 | 22,649,518(0.00%)#13,964 |
| 66. | New Cumberland | 7 | 7,890(0.09%)#66 | 22,649,518(0.00%)#14,050 |
| 67. | Northfork | 7 | 7,890(0.09%)#67 | 22,649,518(0.00%)#14,169 |
| 68. | Marmet | 5 | 7,890(0.06%)#68 | 22,649,518(0.00%)#14,628 |
| 69. | East Bank | 5 | 7,890(0.06%)#69 | 22,649,518(0.00%)#14,720 |
| 70. | Jefferson | 5 | 7,890(0.06%)#70 | 22,649,518(0.00%)#14,751 |
| 71. | Buckhannon | 4 | 7,890(0.05%)#71 | 22,649,518(0.00%)#14,908 |
| 72. | Barboursville | 4 | 7,890(0.05%)#72 | 22,649,518(0.00%)#14,911 |
| 73. | Mcmechen | 4 | 7,890(0.05%)#73 | 22,649,518(0.00%)#14,965 |
| 74. | North Hills | 4 | 7,890(0.05%)#74 | 22,649,518(0.00%)#15,049 |
| 75. | Logan | 3 | 7,890(0.04%)#75 | 22,649,518(0.00%)#15,338 |
| 76. | Mabscott | 3 | 7,890(0.04%)#76 | 22,649,518(0.00%)#15,377 |
| 77. | Clay | 3 | 7,890(0.04%)#77 | 22,649,518(0.00%)#15,558 |
| 78. | Burnsville | 3 | 7,890(0.04%)#78 | 22,649,518(0.00%)#15,559 |
| 79. | Union | 3 | 7,890(0.04%)#79 | 22,649,518(0.00%)#15,569 |
| 80. | Robinette | 2 | 7,890(0.03%)#80 | 22,649,518(0.00%)#15,992 |
| 81. | St Albans | 1 | 7,890(0.01%)#81 | 22,649,518(0.00%)#16,246 |
| 82. | Bolivar | 1 | 7,890(0.01%)#82 | 22,649,518(0.00%)#16,332 |
| 83. | Monongah | 1 | 7,890(0.01%)#83 | 22,649,518(0.00%)#16,351 |
| 84. | Harpers Ferry | 1 | 7,890(0.01%)#84 | 22,649,518(0.00%)#16,528 |
1
2Common Questions
What are the Top 10 Cities with the Most Immigrants from Latin America in West Virginia?
Top 10 Cities with the Most Immigrants from Latin America in West Virginia are:
#1
507
#2
334
#3
258
#4
223
#5
205
#6
180
#7
179
#8
124
#9
100
#10
60
What city has the Most Immigrants from Latin America in West Virginia?
Martinsburg has the Most Immigrants from Latin America in West Virginia with 507.
What is the Total Immigrants from Latin America in the State of West Virginia?
Total Immigrants from Latin America in West Virginia is 7,890.
What is the Total Immigrants from Latin America in the United States?
Total Immigrants from Latin America in the United States is 22,649,518.