Cities with the Most Immigrants from Latin America in Minnesota
RELATED REPORTS & OPTIONS
Latin America
Minnesota
Compare Cities
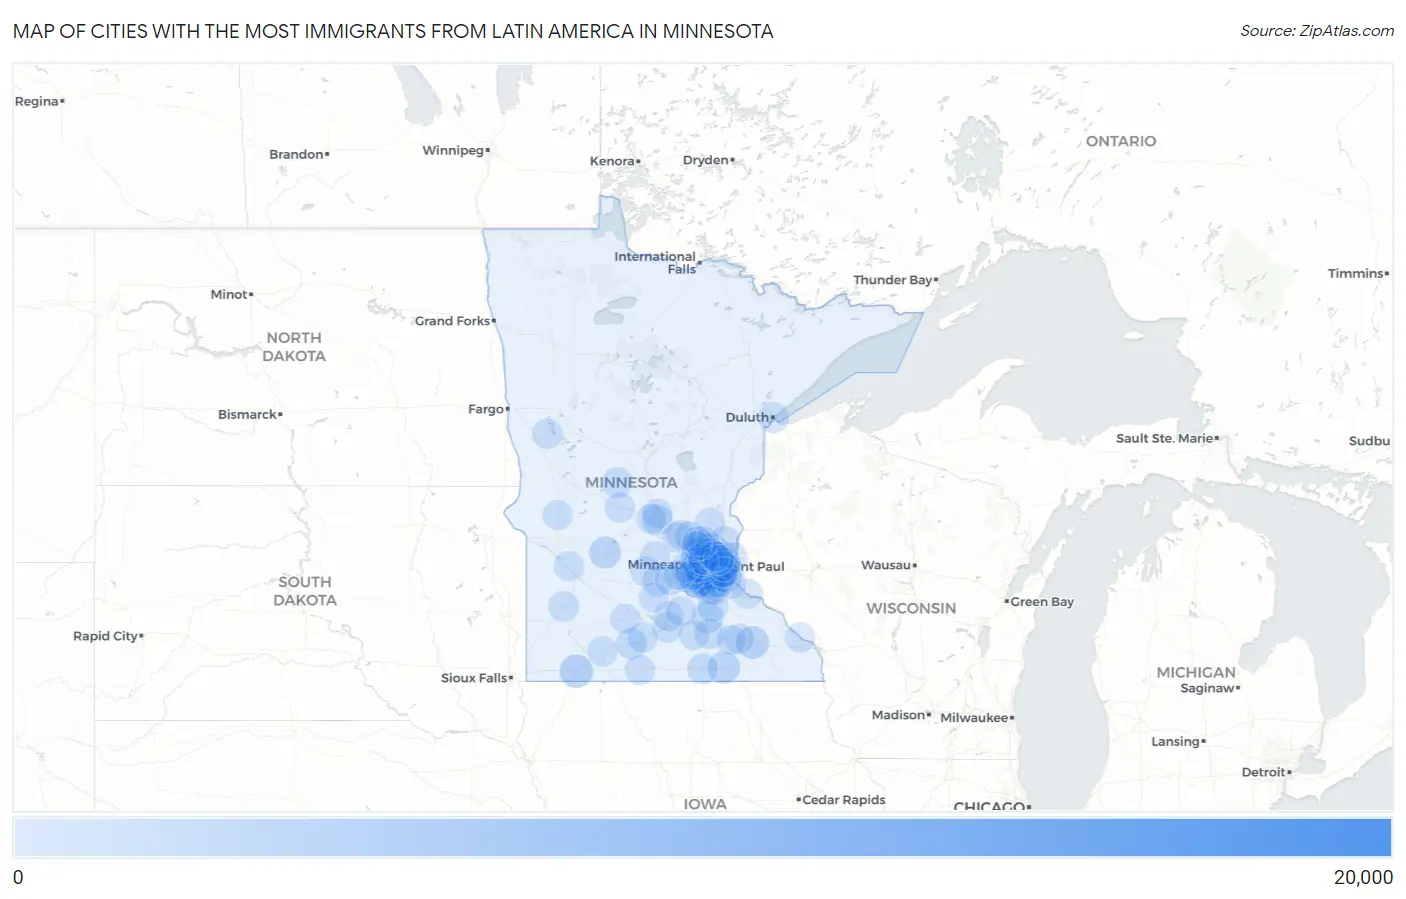
Map of Cities with the Most Immigrants from Latin America in Minnesota
0
20,000
Cities with the Most Immigrants from Latin America in Minnesota
| City | Latin America | vs State | vs National | |
| 1. | Minneapolis | 16,095 | 110,576(14.56%)#1 | 22,649,518(0.07%)#199 |
| 2. | St Paul | 9,369 | 110,576(8.47%)#2 | 22,649,518(0.04%)#355 |
| 3. | Bloomington | 3,186 | 110,576(2.88%)#3 | 22,649,518(0.01%)#953 |
| 4. | Richfield | 2,939 | 110,576(2.66%)#4 | 22,649,518(0.01%)#1,020 |
| 5. | Burnsville | 2,810 | 110,576(2.54%)#5 | 22,649,518(0.01%)#1,055 |
| 6. | Worthington | 2,580 | 110,576(2.33%)#6 | 22,649,518(0.01%)#1,119 |
| 7. | Brooklyn Park | 2,495 | 110,576(2.26%)#7 | 22,649,518(0.01%)#1,146 |
| 8. | Brooklyn Center | 2,272 | 110,576(2.05%)#8 | 22,649,518(0.01%)#1,222 |
| 9. | Rochester | 2,245 | 110,576(2.03%)#9 | 22,649,518(0.01%)#1,231 |
| 10. | Austin | 1,932 | 110,576(1.75%)#10 | 22,649,518(0.01%)#1,380 |
| 11. | Eden Prairie | 1,931 | 110,576(1.75%)#11 | 22,649,518(0.01%)#1,381 |
| 12. | Shakopee | 1,867 | 110,576(1.69%)#12 | 22,649,518(0.01%)#1,418 |
| 13. | Fridley | 1,856 | 110,576(1.68%)#13 | 22,649,518(0.01%)#1,421 |
| 14. | Columbia Heights | 1,719 | 110,576(1.55%)#14 | 22,649,518(0.01%)#1,490 |
| 15. | Maplewood | 1,708 | 110,576(1.54%)#15 | 22,649,518(0.01%)#1,497 |
| 16. | Apple Valley | 1,654 | 110,576(1.50%)#16 | 22,649,518(0.01%)#1,525 |
| 17. | Willmar | 1,647 | 110,576(1.49%)#17 | 22,649,518(0.01%)#1,528 |
| 18. | Woodbury | 1,389 | 110,576(1.26%)#18 | 22,649,518(0.01%)#1,717 |
| 19. | Blaine | 1,352 | 110,576(1.22%)#19 | 22,649,518(0.01%)#1,748 |
| 20. | Inver Grove Heights | 1,351 | 110,576(1.22%)#20 | 22,649,518(0.01%)#1,749 |
| 21. | Plymouth | 1,294 | 110,576(1.17%)#21 | 22,649,518(0.01%)#1,803 |
| 22. | Lakeville | 1,276 | 110,576(1.15%)#22 | 22,649,518(0.01%)#1,822 |
| 23. | Faribault | 1,192 | 110,576(1.08%)#23 | 22,649,518(0.01%)#1,925 |
| 24. | Eagan | 1,164 | 110,576(1.05%)#24 | 22,649,518(0.01%)#1,946 |
| 25. | West St Paul | 963 | 110,576(0.87%)#25 | 22,649,518(0.00%)#2,194 |
| 26. | St James | 953 | 110,576(0.86%)#26 | 22,649,518(0.00%)#2,217 |
| 27. | South St Paul | 946 | 110,576(0.86%)#27 | 22,649,518(0.00%)#2,227 |
| 28. | Coon Rapids | 788 | 110,576(0.71%)#28 | 22,649,518(0.00%)#2,489 |
| 29. | St Louis Park | 777 | 110,576(0.70%)#29 | 22,649,518(0.00%)#2,511 |
| 30. | St Cloud | 732 | 110,576(0.66%)#30 | 22,649,518(0.00%)#2,612 |
| 31. | New Hope | 704 | 110,576(0.64%)#31 | 22,649,518(0.00%)#2,676 |
| 32. | Albert Lea | 690 | 110,576(0.62%)#32 | 22,649,518(0.00%)#2,708 |
| 33. | Cottage Grove | 684 | 110,576(0.62%)#33 | 22,649,518(0.00%)#2,720 |
| 34. | Northfield | 663 | 110,576(0.60%)#34 | 22,649,518(0.00%)#2,762 |
| 35. | Long Prairie | 654 | 110,576(0.59%)#35 | 22,649,518(0.00%)#2,783 |
| 36. | Chaska | 651 | 110,576(0.59%)#36 | 22,649,518(0.00%)#2,790 |
| 37. | New Brighton | 625 | 110,576(0.57%)#37 | 22,649,518(0.00%)#2,857 |
| 38. | White Bear Lake | 602 | 110,576(0.54%)#38 | 22,649,518(0.00%)#2,921 |
| 39. | Monticello | 587 | 110,576(0.53%)#39 | 22,649,518(0.00%)#2,972 |
| 40. | Oakdale | 584 | 110,576(0.53%)#40 | 22,649,518(0.00%)#2,984 |
| 41. | Savage | 583 | 110,576(0.53%)#41 | 22,649,518(0.00%)#2,989 |
| 42. | Owatonna | 547 | 110,576(0.49%)#42 | 22,649,518(0.00%)#3,106 |
| 43. | Duluth | 527 | 110,576(0.48%)#43 | 22,649,518(0.00%)#3,190 |
| 44. | Roseville | 517 | 110,576(0.47%)#44 | 22,649,518(0.00%)#3,214 |
| 45. | Maple Grove | 490 | 110,576(0.44%)#45 | 22,649,518(0.00%)#3,315 |
| 46. | Marshall | 490 | 110,576(0.44%)#46 | 22,649,518(0.00%)#3,316 |
| 47. | Pelican Rapids | 476 | 110,576(0.43%)#47 | 22,649,518(0.00%)#3,383 |
| 48. | Edina | 461 | 110,576(0.42%)#48 | 22,649,518(0.00%)#3,438 |
| 49. | Glencoe | 456 | 110,576(0.41%)#49 | 22,649,518(0.00%)#3,452 |
| 50. | Mankato | 415 | 110,576(0.38%)#50 | 22,649,518(0.00%)#3,644 |
| 51. | Minnetonka | 399 | 110,576(0.36%)#51 | 22,649,518(0.00%)#3,724 |
| 52. | Spring Lake Park | 397 | 110,576(0.36%)#52 | 22,649,518(0.00%)#3,737 |
| 53. | Crystal | 390 | 110,576(0.35%)#53 | 22,649,518(0.00%)#3,774 |
| 54. | Vadnais Heights | 389 | 110,576(0.35%)#54 | 22,649,518(0.00%)#3,780 |
| 55. | Hopkins | 383 | 110,576(0.35%)#55 | 22,649,518(0.00%)#3,804 |
| 56. | Prior Lake | 353 | 110,576(0.32%)#56 | 22,649,518(0.00%)#3,985 |
| 57. | Arden Hills | 353 | 110,576(0.32%)#57 | 22,649,518(0.00%)#3,988 |
| 58. | Stillwater | 347 | 110,576(0.31%)#58 | 22,649,518(0.00%)#4,034 |
| 59. | Rosemount | 329 | 110,576(0.30%)#59 | 22,649,518(0.00%)#4,147 |
| 60. | Forest Lake | 328 | 110,576(0.30%)#60 | 22,649,518(0.00%)#4,150 |
| 61. | Montevideo | 326 | 110,576(0.29%)#61 | 22,649,518(0.00%)#4,163 |
| 62. | Chanhassen | 322 | 110,576(0.29%)#62 | 22,649,518(0.00%)#4,189 |
| 63. | Red Wing | 310 | 110,576(0.28%)#63 | 22,649,518(0.00%)#4,259 |
| 64. | Mounds View | 298 | 110,576(0.27%)#64 | 22,649,518(0.00%)#4,345 |
| 65. | Le Center | 298 | 110,576(0.27%)#65 | 22,649,518(0.00%)#4,348 |
| 66. | Isanti | 276 | 110,576(0.25%)#66 | 22,649,518(0.00%)#4,506 |
| 67. | Windom | 269 | 110,576(0.24%)#67 | 22,649,518(0.00%)#4,560 |
| 68. | Hilltop | 256 | 110,576(0.23%)#68 | 22,649,518(0.00%)#4,657 |
| 69. | Mound | 249 | 110,576(0.23%)#69 | 22,649,518(0.00%)#4,714 |
| 70. | Elk River | 247 | 110,576(0.22%)#70 | 22,649,518(0.00%)#4,725 |
| 71. | Madelia | 240 | 110,576(0.22%)#71 | 22,649,518(0.00%)#4,802 |
| 72. | Farmington | 235 | 110,576(0.21%)#72 | 22,649,518(0.00%)#4,842 |
| 73. | Golden Valley | 235 | 110,576(0.21%)#73 | 22,649,518(0.00%)#4,843 |
| 74. | St Peter | 232 | 110,576(0.21%)#74 | 22,649,518(0.00%)#4,878 |
| 75. | Hastings | 224 | 110,576(0.20%)#75 | 22,649,518(0.00%)#4,957 |
| 76. | Sauk Rapids | 224 | 110,576(0.20%)#76 | 22,649,518(0.00%)#4,959 |
| 77. | Waite Park | 223 | 110,576(0.20%)#77 | 22,649,518(0.00%)#4,970 |
| 78. | Andover | 221 | 110,576(0.20%)#78 | 22,649,518(0.00%)#4,988 |
| 79. | Morris | 218 | 110,576(0.20%)#79 | 22,649,518(0.00%)#5,024 |
| 80. | Robbinsdale | 216 | 110,576(0.20%)#80 | 22,649,518(0.00%)#5,041 |
| 81. | Newport | 208 | 110,576(0.19%)#81 | 22,649,518(0.00%)#5,137 |
| 82. | Hutchinson | 206 | 110,576(0.19%)#82 | 22,649,518(0.00%)#5,159 |
| 83. | Waseca | 205 | 110,576(0.19%)#83 | 22,649,518(0.00%)#5,174 |
| 84. | Fairmont | 198 | 110,576(0.18%)#84 | 22,649,518(0.00%)#5,247 |
| 85. | Anoka | 197 | 110,576(0.18%)#85 | 22,649,518(0.00%)#5,258 |
| 86. | Melrose | 197 | 110,576(0.18%)#86 | 22,649,518(0.00%)#5,263 |
| 87. | Gaylord | 194 | 110,576(0.18%)#87 | 22,649,518(0.00%)#5,310 |
| 88. | Sleepy Eye | 190 | 110,576(0.17%)#88 | 22,649,518(0.00%)#5,360 |
| 89. | Landfall | 179 | 110,576(0.16%)#89 | 22,649,518(0.00%)#5,513 |
| 90. | Shoreview | 176 | 110,576(0.16%)#90 | 22,649,518(0.00%)#5,549 |
| 91. | Big Lake | 176 | 110,576(0.16%)#91 | 22,649,518(0.00%)#5,552 |
| 92. | Ramsey | 172 | 110,576(0.16%)#92 | 22,649,518(0.00%)#5,615 |
| 93. | Little Canada | 171 | 110,576(0.15%)#93 | 22,649,518(0.00%)#5,633 |
| 94. | Norwood Young America | 171 | 110,576(0.15%)#94 | 22,649,518(0.00%)#5,640 |
| 95. | Dayton | 164 | 110,576(0.15%)#95 | 22,649,518(0.00%)#5,768 |
| 96. | Kasson | 164 | 110,576(0.15%)#96 | 22,649,518(0.00%)#5,769 |
| 97. | Cokato | 150 | 110,576(0.14%)#97 | 22,649,518(0.00%)#5,989 |
| 98. | Waconia | 146 | 110,576(0.13%)#98 | 22,649,518(0.00%)#6,055 |
| 99. | Winona | 141 | 110,576(0.13%)#99 | 22,649,518(0.00%)#6,142 |
| 100. | Dodge Center | 140 | 110,576(0.13%)#100 | 22,649,518(0.00%)#6,169 |
Common Questions
What are the Top 10 Cities with the Most Immigrants from Latin America in Minnesota?
Top 10 Cities with the Most Immigrants from Latin America in Minnesota are:
#1
16,095
#2
9,369
#3
3,186
#4
2,939
#5
2,810
#6
2,580
#7
2,495
#8
2,272
#9
2,245
#10
1,932
What city has the Most Immigrants from Latin America in Minnesota?
Minneapolis has the Most Immigrants from Latin America in Minnesota with 16,095.
What is the Total Immigrants from Latin America in the State of Minnesota?
Total Immigrants from Latin America in Minnesota is 110,576.
What is the Total Immigrants from Latin America in the United States?
Total Immigrants from Latin America in the United States is 22,649,518.