Cities with the Most Immigrants from Latin America in Missouri
RELATED REPORTS & OPTIONS
Latin America
Missouri
Compare Cities
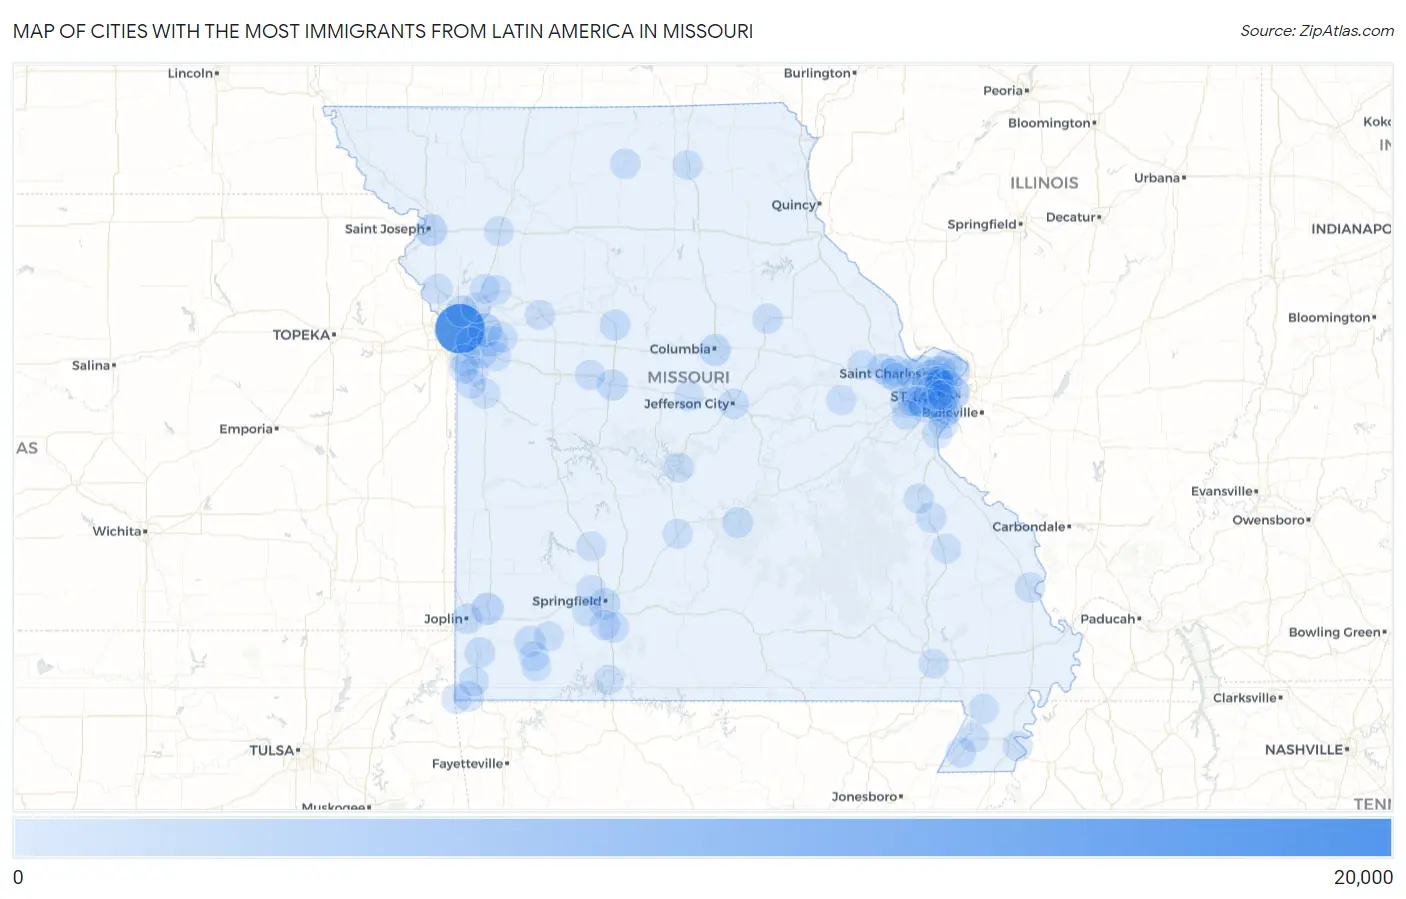
Map of Cities with the Most Immigrants from Latin America in Missouri
0
20,000
Cities with the Most Immigrants from Latin America in Missouri
| City | Latin America | vs State | vs National | |
| 1. | Kansas City | 18,776 | 75,734(24.79%)#1 | 22,649,518(0.08%)#164 |
| 2. | St Louis | 3,717 | 75,734(4.91%)#2 | 22,649,518(0.02%)#844 |
| 3. | Independence | 3,239 | 75,734(4.28%)#3 | 22,649,518(0.01%)#949 |
| 4. | Carthage | 2,039 | 75,734(2.69%)#4 | 22,649,518(0.01%)#1,327 |
| 5. | St Joseph | 1,746 | 75,734(2.31%)#5 | 22,649,518(0.01%)#1,477 |
| 6. | Columbia | 1,574 | 75,734(2.08%)#6 | 22,649,518(0.01%)#1,570 |
| 7. | St Charles | 1,364 | 75,734(1.80%)#7 | 22,649,518(0.01%)#1,743 |
| 8. | Sedalia | 1,235 | 75,734(1.63%)#8 | 22,649,518(0.01%)#1,870 |
| 9. | Grandview | 1,232 | 75,734(1.63%)#9 | 22,649,518(0.01%)#1,872 |
| 10. | Springfield | 1,211 | 75,734(1.60%)#10 | 22,649,518(0.01%)#1,893 |
| 11. | O Fallon | 1,102 | 75,734(1.46%)#11 | 22,649,518(0.00%)#2,015 |
| 12. | Lee S Summit | 1,056 | 75,734(1.39%)#12 | 22,649,518(0.00%)#2,059 |
| 13. | Overland | 1,056 | 75,734(1.39%)#13 | 22,649,518(0.00%)#2,061 |
| 14. | Monett | 903 | 75,734(1.19%)#14 | 22,649,518(0.00%)#2,288 |
| 15. | Gladstone | 898 | 75,734(1.19%)#15 | 22,649,518(0.00%)#2,291 |
| 16. | Marshall | 866 | 75,734(1.14%)#16 | 22,649,518(0.00%)#2,335 |
| 17. | Raytown | 781 | 75,734(1.03%)#17 | 22,649,518(0.00%)#2,503 |
| 18. | Fort Leonard Wood | 740 | 75,734(0.98%)#18 | 22,649,518(0.00%)#2,598 |
| 19. | Neosho | 648 | 75,734(0.86%)#19 | 22,649,518(0.00%)#2,795 |
| 20. | Florissant | 618 | 75,734(0.82%)#20 | 22,649,518(0.00%)#2,876 |
| 21. | Bridgeton | 588 | 75,734(0.78%)#21 | 22,649,518(0.00%)#2,971 |
| 22. | Joplin | 580 | 75,734(0.77%)#22 | 22,649,518(0.00%)#2,998 |
| 23. | Blue Springs | 578 | 75,734(0.76%)#23 | 22,649,518(0.00%)#3,005 |
| 24. | Jefferson City | 541 | 75,734(0.71%)#24 | 22,649,518(0.00%)#3,125 |
| 25. | Chesterfield | 540 | 75,734(0.71%)#25 | 22,649,518(0.00%)#3,131 |
| 26. | Ozark | 489 | 75,734(0.65%)#26 | 22,649,518(0.00%)#3,321 |
| 27. | St Peters | 482 | 75,734(0.64%)#27 | 22,649,518(0.00%)#3,353 |
| 28. | University City | 480 | 75,734(0.63%)#28 | 22,649,518(0.00%)#3,361 |
| 29. | Breckenridge Hills | 417 | 75,734(0.55%)#29 | 22,649,518(0.00%)#3,636 |
| 30. | Milan | 397 | 75,734(0.52%)#30 | 22,649,518(0.00%)#3,742 |
| 31. | Hazelwood | 392 | 75,734(0.52%)#31 | 22,649,518(0.00%)#3,761 |
| 32. | Noel | 392 | 75,734(0.52%)#32 | 22,649,518(0.00%)#3,765 |
| 33. | Maryland Heights | 382 | 75,734(0.50%)#33 | 22,649,518(0.00%)#3,810 |
| 34. | Nixa | 379 | 75,734(0.50%)#34 | 22,649,518(0.00%)#3,830 |
| 35. | Berkeley | 360 | 75,734(0.48%)#35 | 22,649,518(0.00%)#3,954 |
| 36. | Wentzville | 349 | 75,734(0.46%)#36 | 22,649,518(0.00%)#4,017 |
| 37. | Affton | 341 | 75,734(0.45%)#37 | 22,649,518(0.00%)#4,072 |
| 38. | Senath | 318 | 75,734(0.42%)#38 | 22,649,518(0.00%)#4,214 |
| 39. | Cape Girardeau | 296 | 75,734(0.39%)#39 | 22,649,518(0.00%)#4,353 |
| 40. | St Ann | 292 | 75,734(0.39%)#40 | 22,649,518(0.00%)#4,387 |
| 41. | Wildwood | 287 | 75,734(0.38%)#41 | 22,649,518(0.00%)#4,422 |
| 42. | Lake St Louis | 279 | 75,734(0.37%)#42 | 22,649,518(0.00%)#4,479 |
| 43. | Old Jamestown | 276 | 75,734(0.36%)#43 | 22,649,518(0.00%)#4,504 |
| 44. | Southwest City | 271 | 75,734(0.36%)#44 | 22,649,518(0.00%)#4,545 |
| 45. | La Monte | 267 | 75,734(0.35%)#45 | 22,649,518(0.00%)#4,579 |
| 46. | Winchester | 263 | 75,734(0.35%)#46 | 22,649,518(0.00%)#4,606 |
| 47. | Mexico | 257 | 75,734(0.34%)#47 | 22,649,518(0.00%)#4,644 |
| 48. | Lexington | 241 | 75,734(0.32%)#48 | 22,649,518(0.00%)#4,792 |
| 49. | Ballwin | 240 | 75,734(0.32%)#49 | 22,649,518(0.00%)#4,794 |
| 50. | Kirksville | 240 | 75,734(0.32%)#50 | 22,649,518(0.00%)#4,796 |
| 51. | Farmington | 237 | 75,734(0.31%)#51 | 22,649,518(0.00%)#4,825 |
| 52. | Republic | 234 | 75,734(0.31%)#52 | 22,649,518(0.00%)#4,851 |
| 53. | Liberty | 227 | 75,734(0.30%)#53 | 22,649,518(0.00%)#4,928 |
| 54. | Mehlville | 218 | 75,734(0.29%)#54 | 22,649,518(0.00%)#5,014 |
| 55. | Valley Park | 210 | 75,734(0.28%)#55 | 22,649,518(0.00%)#5,116 |
| 56. | Woodson Terrace | 210 | 75,734(0.28%)#56 | 22,649,518(0.00%)#5,118 |
| 57. | Wright City | 209 | 75,734(0.28%)#57 | 22,649,518(0.00%)#5,126 |
| 58. | Oakville | 186 | 75,734(0.25%)#58 | 22,649,518(0.00%)#5,410 |
| 59. | Excelsior Springs | 180 | 75,734(0.24%)#59 | 22,649,518(0.00%)#5,483 |
| 60. | Purdy | 176 | 75,734(0.23%)#60 | 22,649,518(0.00%)#5,566 |
| 61. | Ellisville | 166 | 75,734(0.22%)#61 | 22,649,518(0.00%)#5,721 |
| 62. | Lemay | 165 | 75,734(0.22%)#62 | 22,649,518(0.00%)#5,749 |
| 63. | Anderson | 158 | 75,734(0.21%)#63 | 22,649,518(0.00%)#5,864 |
| 64. | New Haven | 155 | 75,734(0.20%)#64 | 22,649,518(0.00%)#5,904 |
| 65. | Creve Coeur | 150 | 75,734(0.20%)#65 | 22,649,518(0.00%)#5,981 |
| 66. | Raymore | 148 | 75,734(0.20%)#66 | 22,649,518(0.00%)#6,016 |
| 67. | Lebanon | 146 | 75,734(0.19%)#67 | 22,649,518(0.00%)#6,053 |
| 68. | Harrisonville | 144 | 75,734(0.19%)#68 | 22,649,518(0.00%)#6,090 |
| 69. | California | 142 | 75,734(0.19%)#69 | 22,649,518(0.00%)#6,128 |
| 70. | Cameron | 141 | 75,734(0.19%)#70 | 22,649,518(0.00%)#6,145 |
| 71. | St John | 141 | 75,734(0.19%)#71 | 22,649,518(0.00%)#6,147 |
| 72. | Kirkwood | 132 | 75,734(0.17%)#72 | 22,649,518(0.00%)#6,294 |
| 73. | Peculiar | 132 | 75,734(0.17%)#73 | 22,649,518(0.00%)#6,302 |
| 74. | Northwoods | 132 | 75,734(0.17%)#74 | 22,649,518(0.00%)#6,308 |
| 75. | Kennett | 130 | 75,734(0.17%)#75 | 22,649,518(0.00%)#6,338 |
| 76. | Bolivar | 124 | 75,734(0.16%)#76 | 22,649,518(0.00%)#6,463 |
| 77. | Grain Valley | 121 | 75,734(0.16%)#77 | 22,649,518(0.00%)#6,525 |
| 78. | Branson | 121 | 75,734(0.16%)#78 | 22,649,518(0.00%)#6,527 |
| 79. | Bonne Terre | 119 | 75,734(0.16%)#79 | 22,649,518(0.00%)#6,588 |
| 80. | Maplewood | 115 | 75,734(0.15%)#80 | 22,649,518(0.00%)#6,672 |
| 81. | Manchester | 107 | 75,734(0.14%)#81 | 22,649,518(0.00%)#6,848 |
| 82. | Crestwood | 107 | 75,734(0.14%)#82 | 22,649,518(0.00%)#6,852 |
| 83. | Belton | 104 | 75,734(0.14%)#83 | 22,649,518(0.00%)#6,918 |
| 84. | Ladue | 101 | 75,734(0.13%)#84 | 22,649,518(0.00%)#6,998 |
| 85. | Spanish Lake | 99 | 75,734(0.13%)#85 | 22,649,518(0.00%)#7,044 |
| 86. | Dardenne Prairie | 96 | 75,734(0.13%)#86 | 22,649,518(0.00%)#7,126 |
| 87. | Willard | 94 | 75,734(0.12%)#87 | 22,649,518(0.00%)#7,178 |
| 88. | Lake Lotawana | 94 | 75,734(0.12%)#88 | 22,649,518(0.00%)#7,189 |
| 89. | Osage Beach | 92 | 75,734(0.12%)#89 | 22,649,518(0.00%)#7,245 |
| 90. | Clarkton | 92 | 75,734(0.12%)#90 | 22,649,518(0.00%)#7,259 |
| 91. | Kearney | 90 | 75,734(0.12%)#91 | 22,649,518(0.00%)#7,314 |
| 92. | Butterfield | 90 | 75,734(0.12%)#92 | 22,649,518(0.00%)#7,335 |
| 93. | Richmond Heights | 89 | 75,734(0.12%)#93 | 22,649,518(0.00%)#7,341 |
| 94. | Verona | 87 | 75,734(0.11%)#94 | 22,649,518(0.00%)#7,433 |
| 95. | Platte City | 84 | 75,734(0.11%)#95 | 22,649,518(0.00%)#7,509 |
| 96. | Imperial | 82 | 75,734(0.11%)#96 | 22,649,518(0.00%)#7,576 |
| 97. | Eureka | 81 | 75,734(0.11%)#97 | 22,649,518(0.00%)#7,606 |
| 98. | Caruthersville | 80 | 75,734(0.11%)#98 | 22,649,518(0.00%)#7,648 |
| 99. | Fredericktown | 80 | 75,734(0.11%)#99 | 22,649,518(0.00%)#7,651 |
| 100. | Poplar Bluff | 79 | 75,734(0.10%)#100 | 22,649,518(0.00%)#7,673 |
Common Questions
What are the Top 10 Cities with the Most Immigrants from Latin America in Missouri?
Top 10 Cities with the Most Immigrants from Latin America in Missouri are:
#1
18,776
#2
3,717
#3
3,239
#4
2,039
#5
1,746
#6
1,574
#7
1,364
#8
1,235
#9
1,232
#10
1,211
What city has the Most Immigrants from Latin America in Missouri?
Kansas City has the Most Immigrants from Latin America in Missouri with 18,776.
What is the Total Immigrants from Latin America in the State of Missouri?
Total Immigrants from Latin America in Missouri is 75,734.
What is the Total Immigrants from Latin America in the United States?
Total Immigrants from Latin America in the United States is 22,649,518.