Cities with the Most Immigrants from Latin America in New Jersey
RELATED REPORTS & OPTIONS
Latin America
New Jersey
Compare Cities
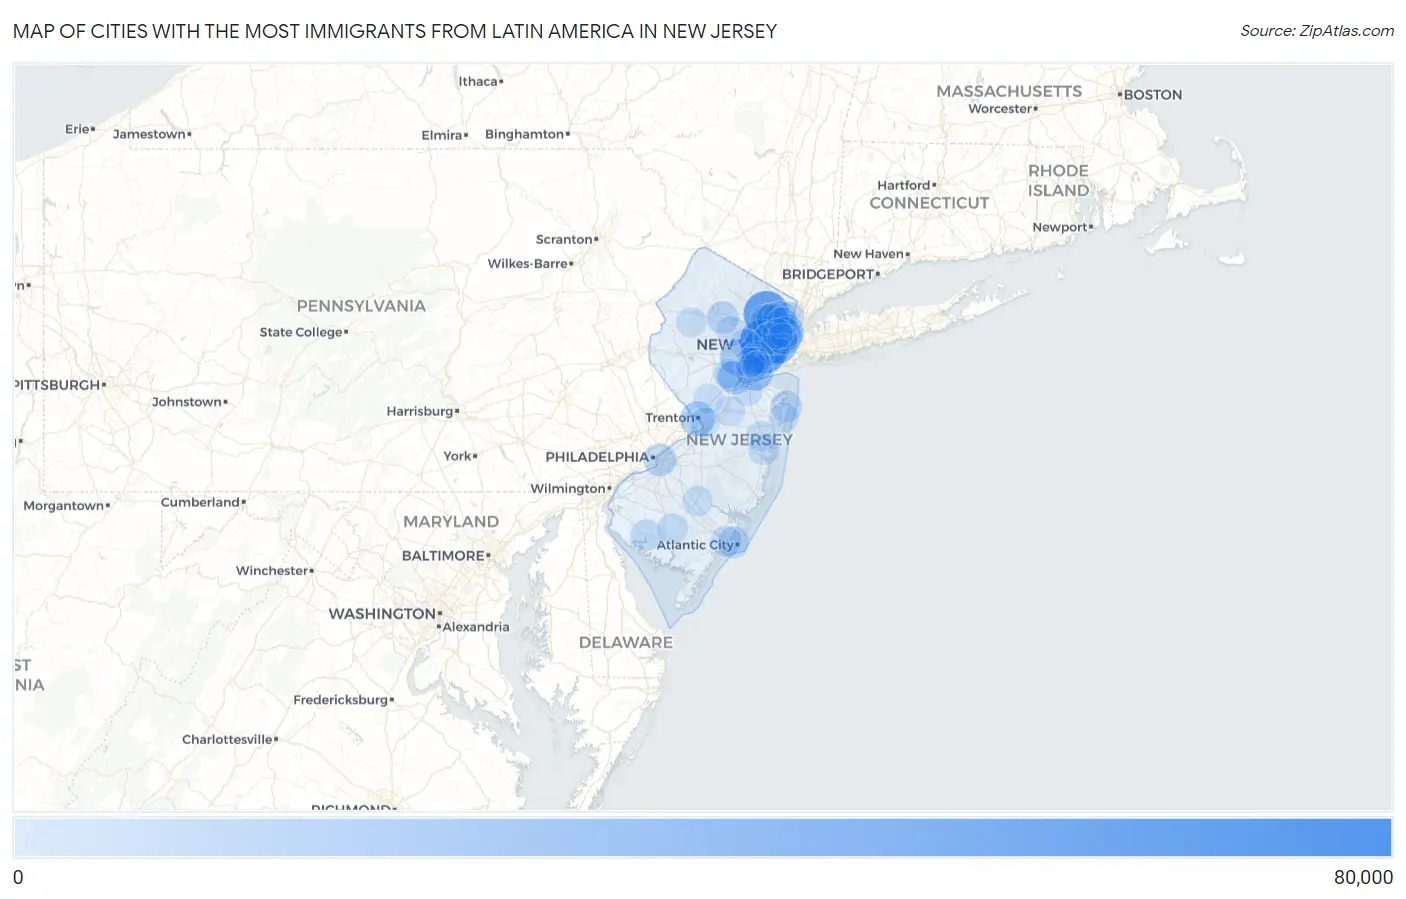
Map of Cities with the Most Immigrants from Latin America in New Jersey
0
80,000
Cities with the Most Immigrants from Latin America in New Jersey
| City | Latin America | vs State | vs National | |
| 1. | Newark | 74,714 | 1,005,395(7.43%)#1 | 22,649,518(0.33%)#19 |
| 2. | Paterson | 58,599 | 1,005,395(5.83%)#2 | 22,649,518(0.26%)#24 |
| 3. | Elizabeth | 57,895 | 1,005,395(5.76%)#3 | 22,649,518(0.26%)#25 |
| 4. | Jersey City | 38,433 | 1,005,395(3.82%)#4 | 22,649,518(0.17%)#62 |
| 5. | Union City | 33,503 | 1,005,395(3.33%)#5 | 22,649,518(0.15%)#77 |
| 6. | Passaic | 26,423 | 1,005,395(2.63%)#6 | 22,649,518(0.12%)#106 |
| 7. | West New York | 26,319 | 1,005,395(2.62%)#7 | 22,649,518(0.12%)#107 |
| 8. | Perth Amboy | 23,983 | 1,005,395(2.39%)#8 | 22,649,518(0.11%)#127 |
| 9. | Plainfield | 19,877 | 1,005,395(1.98%)#9 | 22,649,518(0.09%)#157 |
| 10. | Trenton | 18,405 | 1,005,395(1.83%)#10 | 22,649,518(0.08%)#169 |
| 11. | Clifton | 16,791 | 1,005,395(1.67%)#11 | 22,649,518(0.07%)#191 |
| 12. | East Orange | 16,319 | 1,005,395(1.62%)#12 | 22,649,518(0.07%)#197 |
| 13. | New Brunswick | 14,722 | 1,005,395(1.46%)#13 | 22,649,518(0.06%)#227 |
| 14. | Kearny | 13,085 | 1,005,395(1.30%)#14 | 22,649,518(0.06%)#252 |
| 15. | Hackensack | 11,007 | 1,005,395(1.09%)#15 | 22,649,518(0.05%)#306 |
| 16. | Camden | 10,826 | 1,005,395(1.08%)#16 | 22,649,518(0.05%)#307 |
| 17. | Linden | 9,087 | 1,005,395(0.90%)#17 | 22,649,518(0.04%)#367 |
| 18. | Bayonne | 8,822 | 1,005,395(0.88%)#18 | 22,649,518(0.04%)#379 |
| 19. | Dover | 8,648 | 1,005,395(0.86%)#19 | 22,649,518(0.04%)#387 |
| 20. | North Plainfield Borough | 7,530 | 1,005,395(0.75%)#20 | 22,649,518(0.03%)#448 |
| 21. | Garfield | 7,182 | 1,005,395(0.71%)#21 | 22,649,518(0.03%)#474 |
| 22. | Englewood | 7,066 | 1,005,395(0.70%)#22 | 22,649,518(0.03%)#481 |
| 23. | Atlantic City | 6,501 | 1,005,395(0.65%)#23 | 22,649,518(0.03%)#519 |
| 24. | Roselle Borough | 6,361 | 1,005,395(0.63%)#24 | 22,649,518(0.03%)#529 |
| 25. | Long Branch | 6,024 | 1,005,395(0.60%)#25 | 22,649,518(0.03%)#557 |
| 26. | Lodi Borough | 5,937 | 1,005,395(0.59%)#26 | 22,649,518(0.03%)#564 |
| 27. | Cliffside Park Borough | 5,783 | 1,005,395(0.58%)#27 | 22,649,518(0.03%)#577 |
| 28. | Bridgeton | 5,687 | 1,005,395(0.57%)#28 | 22,649,518(0.03%)#591 |
| 29. | Harrison | 5,565 | 1,005,395(0.55%)#29 | 22,649,518(0.02%)#609 |
| 30. | Pleasantville | 5,130 | 1,005,395(0.51%)#30 | 22,649,518(0.02%)#664 |
| 31. | Fairview Borough | 4,899 | 1,005,395(0.49%)#31 | 22,649,518(0.02%)#685 |
| 32. | Guttenberg | 4,827 | 1,005,395(0.48%)#32 | 22,649,518(0.02%)#695 |
| 33. | Bergenfield Borough | 4,499 | 1,005,395(0.45%)#33 | 22,649,518(0.02%)#730 |
| 34. | Vineland | 4,337 | 1,005,395(0.43%)#34 | 22,649,518(0.02%)#750 |
| 35. | Sayreville Borough | 4,137 | 1,005,395(0.41%)#35 | 22,649,518(0.02%)#777 |
| 36. | Rahway | 3,617 | 1,005,395(0.36%)#36 | 22,649,518(0.02%)#866 |
| 37. | Ridgefield Park | 3,579 | 1,005,395(0.36%)#37 | 22,649,518(0.02%)#876 |
| 38. | East Franklin | 3,404 | 1,005,395(0.34%)#38 | 22,649,518(0.02%)#908 |
| 39. | Lindenwold Borough | 3,332 | 1,005,395(0.33%)#39 | 22,649,518(0.01%)#922 |
| 40. | Bound Brook Borough | 3,253 | 1,005,395(0.32%)#40 | 22,649,518(0.01%)#946 |
| 41. | Toms River | 3,110 | 1,005,395(0.31%)#41 | 22,649,518(0.01%)#970 |
| 42. | Lakewood | 3,093 | 1,005,395(0.31%)#42 | 22,649,518(0.01%)#973 |
| 43. | Carteret Borough | 3,008 | 1,005,395(0.30%)#43 | 22,649,518(0.01%)#1,000 |
| 44. | Elmwood Park Borough | 3,008 | 1,005,395(0.30%)#44 | 22,649,518(0.01%)#1,001 |
| 45. | Freehold Borough | 2,915 | 1,005,395(0.29%)#45 | 22,649,518(0.01%)#1,027 |
| 46. | Morristown | 2,815 | 1,005,395(0.28%)#46 | 22,649,518(0.01%)#1,053 |
| 47. | Fort Lee Borough | 2,581 | 1,005,395(0.26%)#47 | 22,649,518(0.01%)#1,117 |
| 48. | Roselle Park Borough | 2,566 | 1,005,395(0.26%)#48 | 22,649,518(0.01%)#1,122 |
| 49. | South River Borough | 2,476 | 1,005,395(0.25%)#49 | 22,649,518(0.01%)#1,155 |
| 50. | Hoboken | 2,282 | 1,005,395(0.23%)#50 | 22,649,518(0.01%)#1,214 |
| 51. | North Arlington Borough | 2,275 | 1,005,395(0.23%)#51 | 22,649,518(0.01%)#1,219 |
| 52. | Fair Lawn Borough | 2,251 | 1,005,395(0.22%)#52 | 22,649,518(0.01%)#1,230 |
| 53. | Palisades Park Borough | 2,213 | 1,005,395(0.22%)#53 | 22,649,518(0.01%)#1,241 |
| 54. | Secaucus | 2,160 | 1,005,395(0.21%)#54 | 22,649,518(0.01%)#1,270 |
| 55. | Woodbridge | 2,155 | 1,005,395(0.21%)#55 | 22,649,518(0.01%)#1,273 |
| 56. | Hawthorne Borough | 2,110 | 1,005,395(0.21%)#56 | 22,649,518(0.01%)#1,297 |
| 57. | Bogota Borough | 2,097 | 1,005,395(0.21%)#57 | 22,649,518(0.01%)#1,302 |
| 58. | South Plainfield Borough | 2,065 | 1,005,395(0.21%)#58 | 22,649,518(0.01%)#1,315 |
| 59. | Little Ferry Borough | 2,037 | 1,005,395(0.20%)#59 | 22,649,518(0.01%)#1,330 |
| 60. | Prospect Park Borough | 1,996 | 1,005,395(0.20%)#60 | 22,649,518(0.01%)#1,343 |
| 61. | Dunellen Borough | 1,975 | 1,005,395(0.20%)#61 | 22,649,518(0.01%)#1,356 |
| 62. | Wharton Borough | 1,972 | 1,005,395(0.20%)#62 | 22,649,518(0.01%)#1,358 |
| 63. | Haledon Borough | 1,924 | 1,005,395(0.19%)#63 | 22,649,518(0.01%)#1,384 |
| 64. | Asbury Park | 1,831 | 1,005,395(0.18%)#64 | 22,649,518(0.01%)#1,428 |
| 65. | Twin Rivers | 1,802 | 1,005,395(0.18%)#65 | 22,649,518(0.01%)#1,448 |
| 66. | Summit | 1,763 | 1,005,395(0.18%)#66 | 22,649,518(0.01%)#1,466 |
| 67. | Dumont Borough | 1,742 | 1,005,395(0.17%)#67 | 22,649,518(0.01%)#1,480 |
| 68. | Red Bank Borough | 1,733 | 1,005,395(0.17%)#68 | 22,649,518(0.01%)#1,482 |
| 69. | New Milford Borough | 1,669 | 1,005,395(0.17%)#69 | 22,649,518(0.01%)#1,516 |
| 70. | Somerville Borough | 1,580 | 1,005,395(0.16%)#70 | 22,649,518(0.01%)#1,564 |
| 71. | Hasbrouck Heights Borough | 1,559 | 1,005,395(0.16%)#71 | 22,649,518(0.01%)#1,579 |
| 72. | East Newark Borough | 1,507 | 1,005,395(0.15%)#72 | 22,649,518(0.01%)#1,615 |
| 73. | Middlesex Borough | 1,501 | 1,005,395(0.15%)#73 | 22,649,518(0.01%)#1,621 |
| 74. | Ampere North | 1,497 | 1,005,395(0.15%)#74 | 22,649,518(0.01%)#1,624 |
| 75. | Rutherford Borough | 1,482 | 1,005,395(0.15%)#75 | 22,649,518(0.01%)#1,631 |
| 76. | Fords | 1,393 | 1,005,395(0.14%)#76 | 22,649,518(0.01%)#1,715 |
| 77. | Old Bridge | 1,384 | 1,005,395(0.14%)#77 | 22,649,518(0.01%)#1,727 |
| 78. | Silver Lake Cdp Essex County | 1,376 | 1,005,395(0.14%)#78 | 22,649,518(0.01%)#1,734 |
| 79. | Ridgefield Borough | 1,327 | 1,005,395(0.13%)#79 | 22,649,518(0.01%)#1,774 |
| 80. | Highland Park Borough | 1,287 | 1,005,395(0.13%)#80 | 22,649,518(0.01%)#1,817 |
| 81. | Somerset | 1,274 | 1,005,395(0.13%)#81 | 22,649,518(0.01%)#1,824 |
| 82. | Paramus Borough | 1,268 | 1,005,395(0.13%)#82 | 22,649,518(0.01%)#1,831 |
| 83. | Watsessing | 1,267 | 1,005,395(0.13%)#83 | 22,649,518(0.01%)#1,833 |
| 84. | Avenel | 1,192 | 1,005,395(0.12%)#84 | 22,649,518(0.01%)#1,926 |
| 85. | Hammonton | 1,154 | 1,005,395(0.11%)#85 | 22,649,518(0.01%)#1,957 |
| 86. | Union | 1,151 | 1,005,395(0.11%)#86 | 22,649,518(0.01%)#1,961 |
| 87. | Parsippany | 1,133 | 1,005,395(0.11%)#87 | 22,649,518(0.01%)#1,977 |
| 88. | Madison Borough | 1,131 | 1,005,395(0.11%)#88 | 22,649,518(0.00%)#1,979 |
| 89. | Moonachie Borough | 1,088 | 1,005,395(0.11%)#89 | 22,649,518(0.00%)#2,031 |
| 90. | Raritan Borough | 1,083 | 1,005,395(0.11%)#90 | 22,649,518(0.00%)#2,036 |
| 91. | Totowa Borough | 1,075 | 1,005,395(0.11%)#91 | 22,649,518(0.00%)#2,041 |
| 92. | Princeton | 1,049 | 1,005,395(0.10%)#92 | 22,649,518(0.00%)#2,076 |
| 93. | Sicklerville | 1,048 | 1,005,395(0.10%)#93 | 22,649,518(0.00%)#2,079 |
| 94. | Hackettstown | 1,048 | 1,005,395(0.10%)#94 | 22,649,518(0.00%)#2,080 |
| 95. | Leonia Borough | 1,044 | 1,005,395(0.10%)#95 | 22,649,518(0.00%)#2,082 |
| 96. | Colonia | 1,029 | 1,005,395(0.10%)#96 | 22,649,518(0.00%)#2,096 |
| 97. | White Horse | 1,006 | 1,005,395(0.10%)#97 | 22,649,518(0.00%)#2,133 |
| 98. | Eatontown Borough | 983 | 1,005,395(0.10%)#98 | 22,649,518(0.00%)#2,165 |
| 99. | Flemington Borough | 977 | 1,005,395(0.10%)#99 | 22,649,518(0.00%)#2,176 |
| 100. | Port Reading | 974 | 1,005,395(0.10%)#100 | 22,649,518(0.00%)#2,183 |
Common Questions
What are the Top 10 Cities with the Most Immigrants from Latin America in New Jersey?
Top 10 Cities with the Most Immigrants from Latin America in New Jersey are:
#1
74,714
#2
58,599
#3
57,895
#4
38,433
#5
33,503
#6
26,423
#7
26,319
#8
23,983
#9
19,877
#10
18,405
What city has the Most Immigrants from Latin America in New Jersey?
Newark has the Most Immigrants from Latin America in New Jersey with 74,714.
What is the Total Immigrants from Latin America in the State of New Jersey?
Total Immigrants from Latin America in New Jersey is 1,005,395.
What is the Total Immigrants from Latin America in the United States?
Total Immigrants from Latin America in the United States is 22,649,518.