Cities with the Most Immigrants from England in Oklahoma
RELATED REPORTS & OPTIONS
England
Oklahoma
Compare Cities
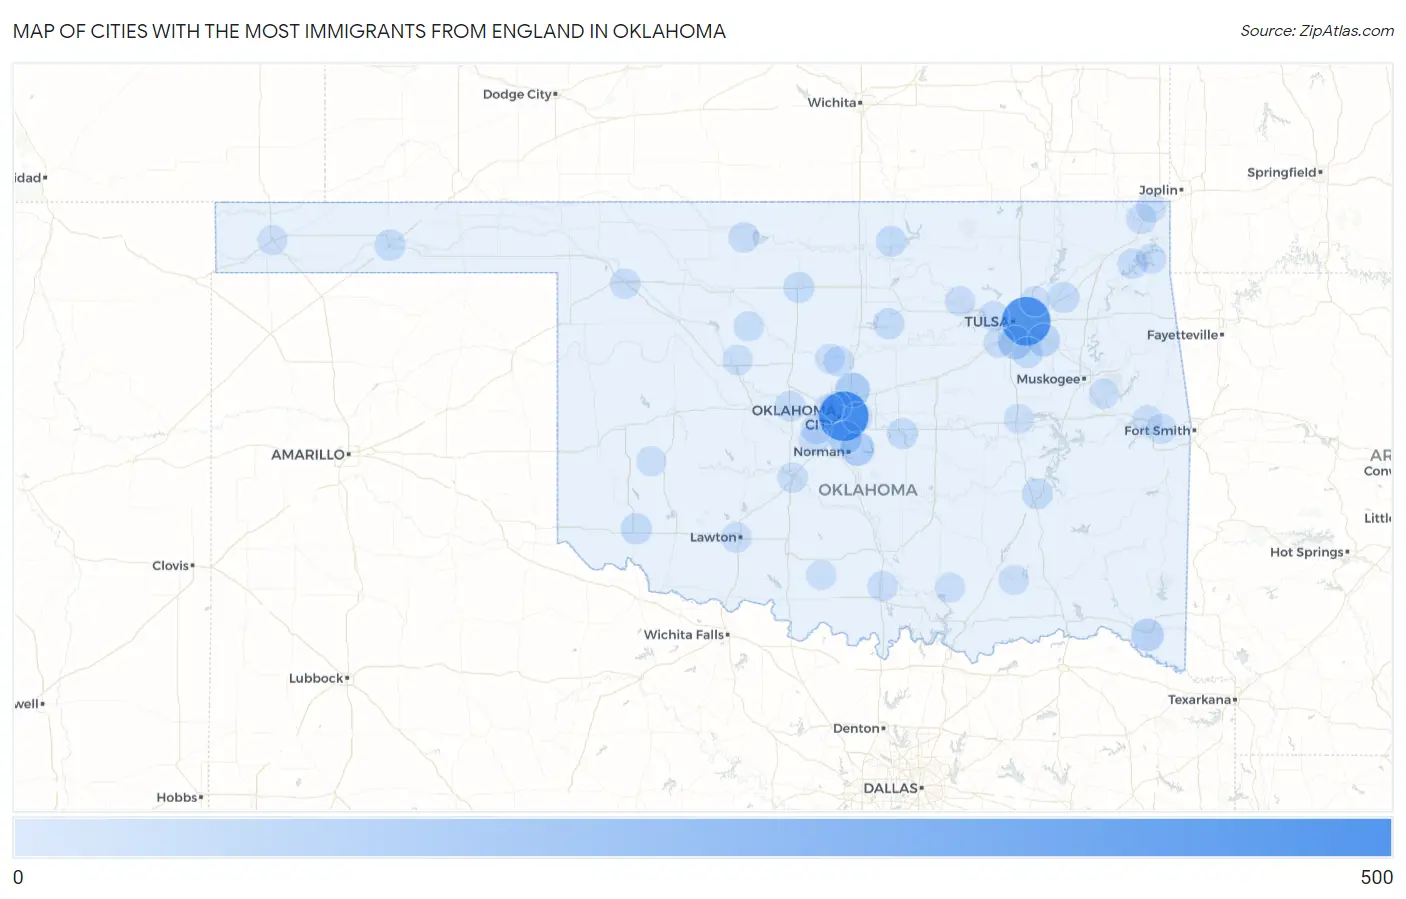
Map of Cities with the Most Immigrants from England in Oklahoma
0
500
Cities with the Most Immigrants from England in Oklahoma
| City | England | vs State | vs National | |
| 1. | Oklahoma City | 427 | 1,922(22.22%)#1 | 318,896(0.13%)#60 |
| 2. | Tulsa | 406 | 1,922(21.12%)#2 | 318,896(0.13%)#69 |
| 3. | Edmond | 99 | 1,922(5.15%)#3 | 318,896(0.03%)#511 |
| 4. | Norman | 86 | 1,922(4.47%)#4 | 318,896(0.03%)#586 |
| 5. | Moore | 78 | 1,922(4.06%)#5 | 318,896(0.02%)#663 |
| 6. | Jenks | 73 | 1,922(3.80%)#6 | 318,896(0.02%)#720 |
| 7. | Idabel | 54 | 1,922(2.81%)#7 | 318,896(0.02%)#992 |
| 8. | Broken Arrow | 51 | 1,922(2.65%)#8 | 318,896(0.02%)#1,037 |
| 9. | Altus | 28 | 1,922(1.46%)#9 | 318,896(0.01%)#1,784 |
| 10. | Claremore | 23 | 1,922(1.20%)#10 | 318,896(0.01%)#2,049 |
| 11. | Stillwater | 22 | 1,922(1.14%)#11 | 318,896(0.01%)#2,098 |
| 12. | Mcalester | 21 | 1,922(1.09%)#12 | 318,896(0.01%)#2,193 |
| 13. | Guymon | 21 | 1,922(1.09%)#13 | 318,896(0.01%)#2,200 |
| 14. | Shawnee | 20 | 1,922(1.04%)#14 | 318,896(0.01%)#2,256 |
| 15. | Bixby | 20 | 1,922(1.04%)#15 | 318,896(0.01%)#2,258 |
| 16. | Enid | 19 | 1,922(0.99%)#16 | 318,896(0.01%)#2,321 |
| 17. | Ponca City | 19 | 1,922(0.99%)#17 | 318,896(0.01%)#2,335 |
| 18. | El Reno | 16 | 1,922(0.83%)#18 | 318,896(0.01%)#2,637 |
| 19. | Mustang | 14 | 1,922(0.73%)#19 | 318,896(0.00%)#2,830 |
| 20. | Cherokee | 11 | 1,922(0.57%)#20 | 318,896(0.00%)#3,319 |
| 21. | Taylor Ferry | 10 | 1,922(0.52%)#21 | 318,896(0.00%)#3,491 |
| 22. | Lawton | 8 | 1,922(0.42%)#22 | 318,896(0.00%)#3,686 |
| 23. | Ardmore | 8 | 1,922(0.42%)#23 | 318,896(0.00%)#3,702 |
| 24. | Tuttle | 8 | 1,922(0.42%)#24 | 318,896(0.00%)#3,753 |
| 25. | Watonga | 8 | 1,922(0.42%)#25 | 318,896(0.00%)#3,798 |
| 26. | Rocky Point | 8 | 1,922(0.42%)#26 | 318,896(0.00%)#3,841 |
| 27. | Sand Springs | 7 | 1,922(0.36%)#27 | 318,896(0.00%)#3,865 |
| 28. | Woodward | 7 | 1,922(0.36%)#28 | 318,896(0.00%)#3,884 |
| 29. | Cleora | 7 | 1,922(0.36%)#29 | 318,896(0.00%)#3,981 |
| 30. | Midwest City | 6 | 1,922(0.31%)#30 | 318,896(0.00%)#4,016 |
| 31. | Owasso | 6 | 1,922(0.31%)#31 | 318,896(0.00%)#4,024 |
| 32. | Sapulpa | 6 | 1,922(0.31%)#32 | 318,896(0.00%)#4,040 |
| 33. | Chickasha | 6 | 1,922(0.31%)#33 | 318,896(0.00%)#4,051 |
| 34. | Miami | 6 | 1,922(0.31%)#34 | 318,896(0.00%)#4,061 |
| 35. | Nichols Hills | 5 | 1,922(0.26%)#35 | 318,896(0.00%)#4,251 |
| 36. | Okeene | 5 | 1,922(0.26%)#36 | 318,896(0.00%)#4,332 |
| 37. | Grove | 4 | 1,922(0.21%)#37 | 318,896(0.00%)#4,394 |
| 38. | Cleveland | 4 | 1,922(0.21%)#38 | 318,896(0.00%)#4,402 |
| 39. | Cedar Valley | 4 | 1,922(0.21%)#39 | 318,896(0.00%)#4,508 |
| 40. | Sand Hill | 3 | 1,922(0.16%)#40 | 318,896(0.00%)#4,717 |
| 41. | Lane | 3 | 1,922(0.16%)#41 | 318,896(0.00%)#4,719 |
| 42. | Sallisaw | 2 | 1,922(0.10%)#42 | 318,896(0.00%)#4,740 |
| 43. | Sentinel | 2 | 1,922(0.10%)#43 | 318,896(0.00%)#4,837 |
| 44. | Quapaw | 2 | 1,922(0.10%)#44 | 318,896(0.00%)#4,850 |
| 45. | Dewar | 2 | 1,922(0.10%)#45 | 318,896(0.00%)#4,866 |
| 46. | Gans | 2 | 1,922(0.10%)#46 | 318,896(0.00%)#4,924 |
| 47. | Warr Acres | 1 | 1,922(0.05%)#47 | 318,896(0.00%)#4,977 |
| 48. | Boise City | 1 | 1,922(0.05%)#48 | 318,896(0.00%)#5,012 |
| 49. | Milburn | 1 | 1,922(0.05%)#49 | 318,896(0.00%)#5,069 |
| 50. | Cimarron City | 1 | 1,922(0.05%)#50 | 318,896(0.00%)#5,083 |
| 51. | Loco | 1 | 1,922(0.05%)#51 | 318,896(0.00%)#5,095 |
Common Questions
What are the Top 10 Cities with the Most Immigrants from England in Oklahoma?
Top 10 Cities with the Most Immigrants from England in Oklahoma are:
#1
427
#2
406
#3
99
#4
86
#5
78
#6
73
#7
54
#8
51
#9
28
#10
23
What city has the Most Immigrants from England in Oklahoma?
Oklahoma City has the Most Immigrants from England in Oklahoma with 427.
What is the Total Immigrants from England in the State of Oklahoma?
Total Immigrants from England in Oklahoma is 1,922.
What is the Total Immigrants from England in the United States?
Total Immigrants from England in the United States is 318,896.