Cities with the Most Immigrants from England in Virginia
RELATED REPORTS & OPTIONS
England
Virginia
Compare Cities
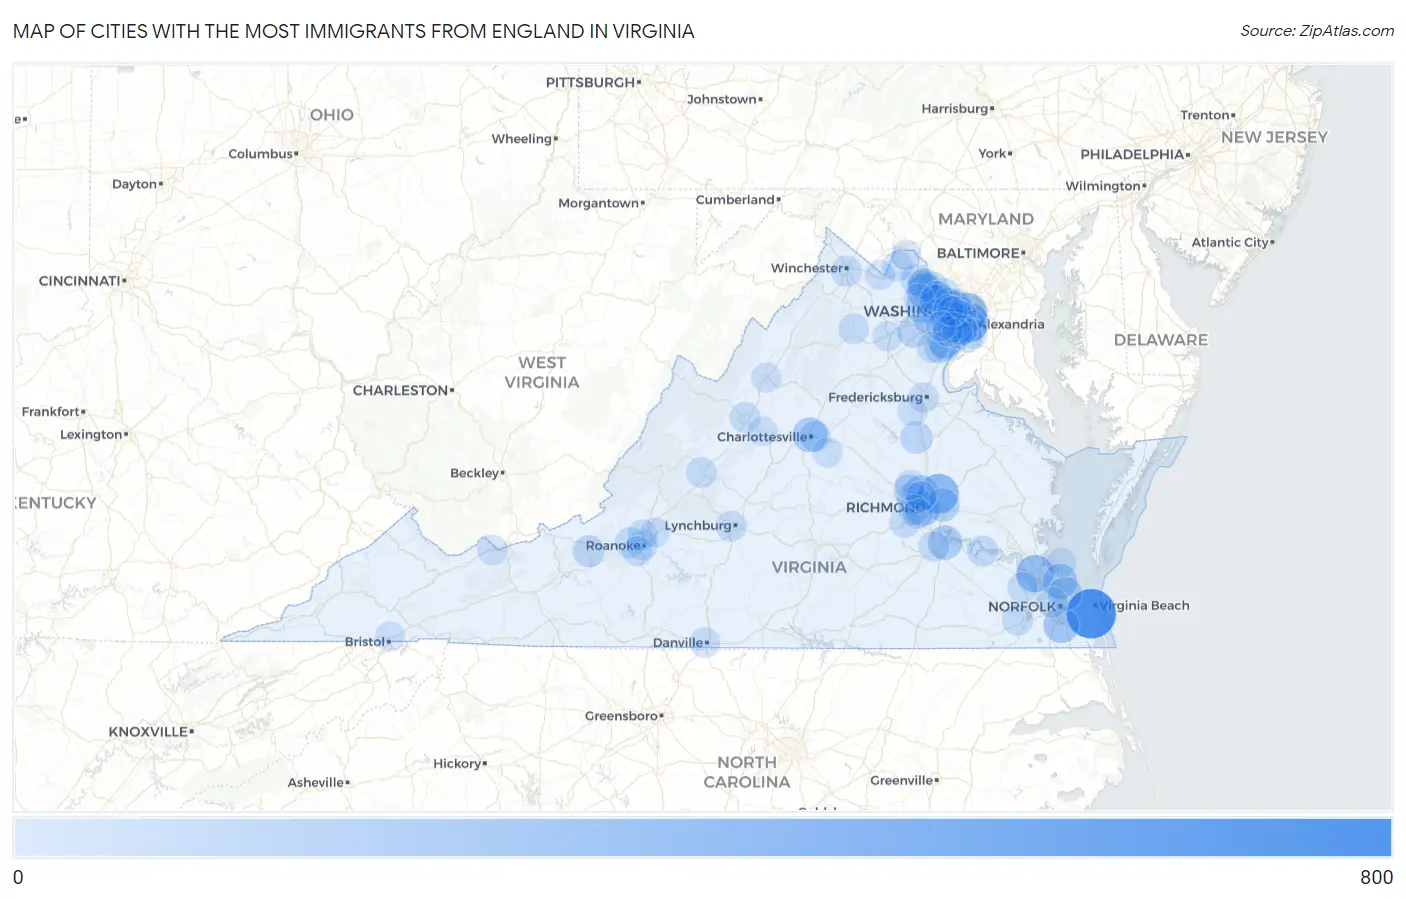
Map of Cities with the Most Immigrants from England in Virginia
0
800
Cities with the Most Immigrants from England in Virginia
| City | England | vs State | vs National | |
| 1. | Virginia Beach | 627 | 9,842(6.37%)#1 | 318,896(0.20%)#32 |
| 2. | Mechanicsville | 315 | 9,842(3.20%)#2 | 318,896(0.10%)#98 |
| 3. | Alexandria | 306 | 9,842(3.11%)#3 | 318,896(0.10%)#101 |
| 4. | Arlington | 292 | 9,842(2.97%)#4 | 318,896(0.09%)#109 |
| 5. | Newport News | 237 | 9,842(2.41%)#5 | 318,896(0.07%)#148 |
| 6. | Reston | 225 | 9,842(2.29%)#6 | 318,896(0.07%)#159 |
| 7. | Chesapeake | 188 | 9,842(1.91%)#7 | 318,896(0.06%)#205 |
| 8. | Ashburn | 182 | 9,842(1.85%)#8 | 318,896(0.06%)#219 |
| 9. | Richmond | 169 | 9,842(1.72%)#9 | 318,896(0.05%)#245 |
| 10. | Charlottesville | 158 | 9,842(1.61%)#10 | 318,896(0.05%)#264 |
| 11. | Hampton | 154 | 9,842(1.56%)#11 | 318,896(0.05%)#273 |
| 12. | Laurel | 142 | 9,842(1.44%)#12 | 318,896(0.04%)#303 |
| 13. | Hopewell | 137 | 9,842(1.39%)#13 | 318,896(0.04%)#321 |
| 14. | Lake Ridge | 136 | 9,842(1.38%)#14 | 318,896(0.04%)#322 |
| 15. | Norfolk | 130 | 9,842(1.32%)#15 | 318,896(0.04%)#336 |
| 16. | Tysons | 118 | 9,842(1.20%)#16 | 318,896(0.04%)#403 |
| 17. | Highland Springs | 118 | 9,842(1.20%)#17 | 318,896(0.04%)#406 |
| 18. | Franklin Farm | 90 | 9,842(0.91%)#18 | 318,896(0.03%)#564 |
| 19. | Linton Hall | 88 | 9,842(0.89%)#19 | 318,896(0.03%)#576 |
| 20. | Midlothian | 78 | 9,842(0.79%)#20 | 318,896(0.02%)#670 |
| 21. | Lake Land Or | 76 | 9,842(0.77%)#21 | 318,896(0.02%)#693 |
| 22. | Oakton | 71 | 9,842(0.72%)#22 | 318,896(0.02%)#746 |
| 23. | Tuckahoe | 69 | 9,842(0.70%)#23 | 318,896(0.02%)#762 |
| 24. | Annandale | 68 | 9,842(0.69%)#24 | 318,896(0.02%)#772 |
| 25. | Countryside | 65 | 9,842(0.66%)#25 | 318,896(0.02%)#816 |
| 26. | Wolf Trap | 63 | 9,842(0.64%)#26 | 318,896(0.02%)#838 |
| 27. | Falls Church | 63 | 9,842(0.64%)#27 | 318,896(0.02%)#839 |
| 28. | Blacksburg | 59 | 9,842(0.60%)#28 | 318,896(0.02%)#896 |
| 29. | Huntington | 55 | 9,842(0.56%)#29 | 318,896(0.02%)#975 |
| 30. | Franconia | 54 | 9,842(0.55%)#30 | 318,896(0.02%)#990 |
| 31. | Dale City | 53 | 9,842(0.54%)#31 | 318,896(0.02%)#998 |
| 32. | South Riding | 51 | 9,842(0.52%)#32 | 318,896(0.02%)#1,045 |
| 33. | Woodburn | 51 | 9,842(0.52%)#33 | 318,896(0.02%)#1,053 |
| 34. | Belmont | 51 | 9,842(0.52%)#34 | 318,896(0.02%)#1,054 |
| 35. | Leesburg | 50 | 9,842(0.51%)#35 | 318,896(0.02%)#1,067 |
| 36. | Mclean | 49 | 9,842(0.50%)#36 | 318,896(0.02%)#1,088 |
| 37. | Short Pump | 49 | 9,842(0.50%)#37 | 318,896(0.02%)#1,095 |
| 38. | Fair Oaks | 48 | 9,842(0.49%)#38 | 318,896(0.02%)#1,118 |
| 39. | Lansdowne | 48 | 9,842(0.49%)#39 | 318,896(0.02%)#1,129 |
| 40. | Braddock | 47 | 9,842(0.48%)#40 | 318,896(0.01%)#1,155 |
| 41. | Winchester | 46 | 9,842(0.47%)#41 | 318,896(0.01%)#1,174 |
| 42. | Pantops | 43 | 9,842(0.44%)#42 | 318,896(0.01%)#1,266 |
| 43. | Suffolk | 41 | 9,842(0.42%)#43 | 318,896(0.01%)#1,296 |
| 44. | Centreville | 41 | 9,842(0.42%)#44 | 318,896(0.01%)#1,298 |
| 45. | Burke | 41 | 9,842(0.42%)#45 | 318,896(0.01%)#1,301 |
| 46. | Springfield | 41 | 9,842(0.42%)#46 | 318,896(0.01%)#1,306 |
| 47. | Staunton | 39 | 9,842(0.40%)#47 | 318,896(0.01%)#1,357 |
| 48. | Great Falls | 39 | 9,842(0.40%)#48 | 318,896(0.01%)#1,361 |
| 49. | Claremont | 39 | 9,842(0.40%)#49 | 318,896(0.01%)#1,374 |
| 50. | Independent Hill | 38 | 9,842(0.39%)#50 | 318,896(0.01%)#1,402 |
| 51. | Portsmouth | 36 | 9,842(0.37%)#51 | 318,896(0.01%)#1,437 |
| 52. | Leesylvania | 36 | 9,842(0.37%)#52 | 318,896(0.01%)#1,447 |
| 53. | Salem | 34 | 9,842(0.35%)#53 | 318,896(0.01%)#1,519 |
| 54. | Colonial Heights | 33 | 9,842(0.34%)#54 | 318,896(0.01%)#1,559 |
| 55. | Brandermill | 33 | 9,842(0.34%)#55 | 318,896(0.01%)#1,565 |
| 56. | Lexington | 33 | 9,842(0.34%)#56 | 318,896(0.01%)#1,570 |
| 57. | Union Mill | 32 | 9,842(0.33%)#57 | 318,896(0.01%)#1,620 |
| 58. | Roanoke | 31 | 9,842(0.31%)#58 | 318,896(0.01%)#1,631 |
| 59. | Hillsboro | 31 | 9,842(0.31%)#59 | 318,896(0.01%)#1,675 |
| 60. | Smithfield | 30 | 9,842(0.30%)#60 | 318,896(0.01%)#1,698 |
| 61. | Flint Hill | 30 | 9,842(0.30%)#61 | 318,896(0.01%)#1,709 |
| 62. | Dranesville | 29 | 9,842(0.29%)#62 | 318,896(0.01%)#1,730 |
| 63. | North Springfield | 29 | 9,842(0.29%)#63 | 318,896(0.01%)#1,742 |
| 64. | Herndon | 27 | 9,842(0.27%)#64 | 318,896(0.01%)#1,824 |
| 65. | Lake Barcroft | 27 | 9,842(0.27%)#65 | 318,896(0.01%)#1,831 |
| 66. | Hollins | 26 | 9,842(0.26%)#66 | 318,896(0.01%)#1,876 |
| 67. | West Falls Church | 25 | 9,842(0.25%)#67 | 318,896(0.01%)#1,917 |
| 68. | Lynchburg | 23 | 9,842(0.23%)#68 | 318,896(0.01%)#2,024 |
| 69. | Brambleton | 23 | 9,842(0.23%)#69 | 318,896(0.01%)#2,045 |
| 70. | Bon Air | 23 | 9,842(0.23%)#70 | 318,896(0.01%)#2,050 |
| 71. | Potomac Mills | 23 | 9,842(0.23%)#71 | 318,896(0.01%)#2,069 |
| 72. | Bluefield | 23 | 9,842(0.23%)#72 | 318,896(0.01%)#2,077 |
| 73. | Danville | 21 | 9,842(0.21%)#73 | 318,896(0.01%)#2,176 |
| 74. | Fredericksburg | 20 | 9,842(0.20%)#74 | 318,896(0.01%)#2,259 |
| 75. | Kings Park West | 20 | 9,842(0.20%)#75 | 318,896(0.01%)#2,277 |
| 76. | Manchester | 19 | 9,842(0.19%)#76 | 318,896(0.01%)#2,364 |
| 77. | Warrenton | 19 | 9,842(0.19%)#77 | 318,896(0.01%)#2,372 |
| 78. | West Springfield | 18 | 9,842(0.18%)#78 | 318,896(0.01%)#2,432 |
| 79. | Mount Vernon | 18 | 9,842(0.18%)#79 | 318,896(0.01%)#2,447 |
| 80. | Wyndham | 18 | 9,842(0.18%)#80 | 318,896(0.01%)#2,450 |
| 81. | Fort Hunt | 17 | 9,842(0.17%)#81 | 318,896(0.01%)#2,548 |
| 82. | Cave Spring | 16 | 9,842(0.16%)#82 | 318,896(0.01%)#2,622 |
| 83. | Kingstowne | 16 | 9,842(0.16%)#83 | 318,896(0.01%)#2,635 |
| 84. | Harrisonburg | 15 | 9,842(0.15%)#84 | 318,896(0.00%)#2,702 |
| 85. | One Loudoun | 15 | 9,842(0.15%)#85 | 318,896(0.00%)#2,783 |
| 86. | Bristol | 14 | 9,842(0.14%)#86 | 318,896(0.00%)#2,838 |
| 87. | Dumbarton | 14 | 9,842(0.14%)#87 | 318,896(0.00%)#2,861 |
| 88. | Spotsylvania Courthouse | 14 | 9,842(0.14%)#88 | 318,896(0.00%)#2,871 |
| 89. | Lovettsville | 14 | 9,842(0.14%)#89 | 318,896(0.00%)#2,899 |
| 90. | Brandy Station | 14 | 9,842(0.14%)#90 | 318,896(0.00%)#2,926 |
| 91. | Vienna | 13 | 9,842(0.13%)#91 | 318,896(0.00%)#2,944 |
| 92. | Lake Monticello | 13 | 9,842(0.13%)#92 | 318,896(0.00%)#2,958 |
| 93. | Shenandoah Retreat | 13 | 9,842(0.13%)#93 | 318,896(0.00%)#3,023 |
| 94. | Waynesboro | 12 | 9,842(0.12%)#94 | 318,896(0.00%)#3,046 |
| 95. | Newington | 12 | 9,842(0.12%)#95 | 318,896(0.00%)#3,068 |
| 96. | Dunn Loring | 12 | 9,842(0.12%)#96 | 318,896(0.00%)#3,087 |
| 97. | South Run | 12 | 9,842(0.12%)#97 | 318,896(0.00%)#3,097 |
| 98. | Laymantown | 12 | 9,842(0.12%)#98 | 318,896(0.00%)#3,144 |
| 99. | Poquoson | 11 | 9,842(0.11%)#99 | 318,896(0.00%)#3,221 |
| 100. | Fairfax Station | 11 | 9,842(0.11%)#100 | 318,896(0.00%)#3,224 |
Common Questions
What are the Top 10 Cities with the Most Immigrants from England in Virginia?
Top 10 Cities with the Most Immigrants from England in Virginia are:
#1
627
#2
315
#3
306
#4
292
#5
237
#6
225
#7
188
#8
182
#9
169
#10
158
What city has the Most Immigrants from England in Virginia?
Virginia Beach has the Most Immigrants from England in Virginia with 627.
What is the Total Immigrants from England in the State of Virginia?
Total Immigrants from England in Virginia is 9,842.
What is the Total Immigrants from England in the United States?
Total Immigrants from England in the United States is 318,896.