Cities with the Most Immigrants from England in Kansas
RELATED REPORTS & OPTIONS
England
Kansas
Compare Cities
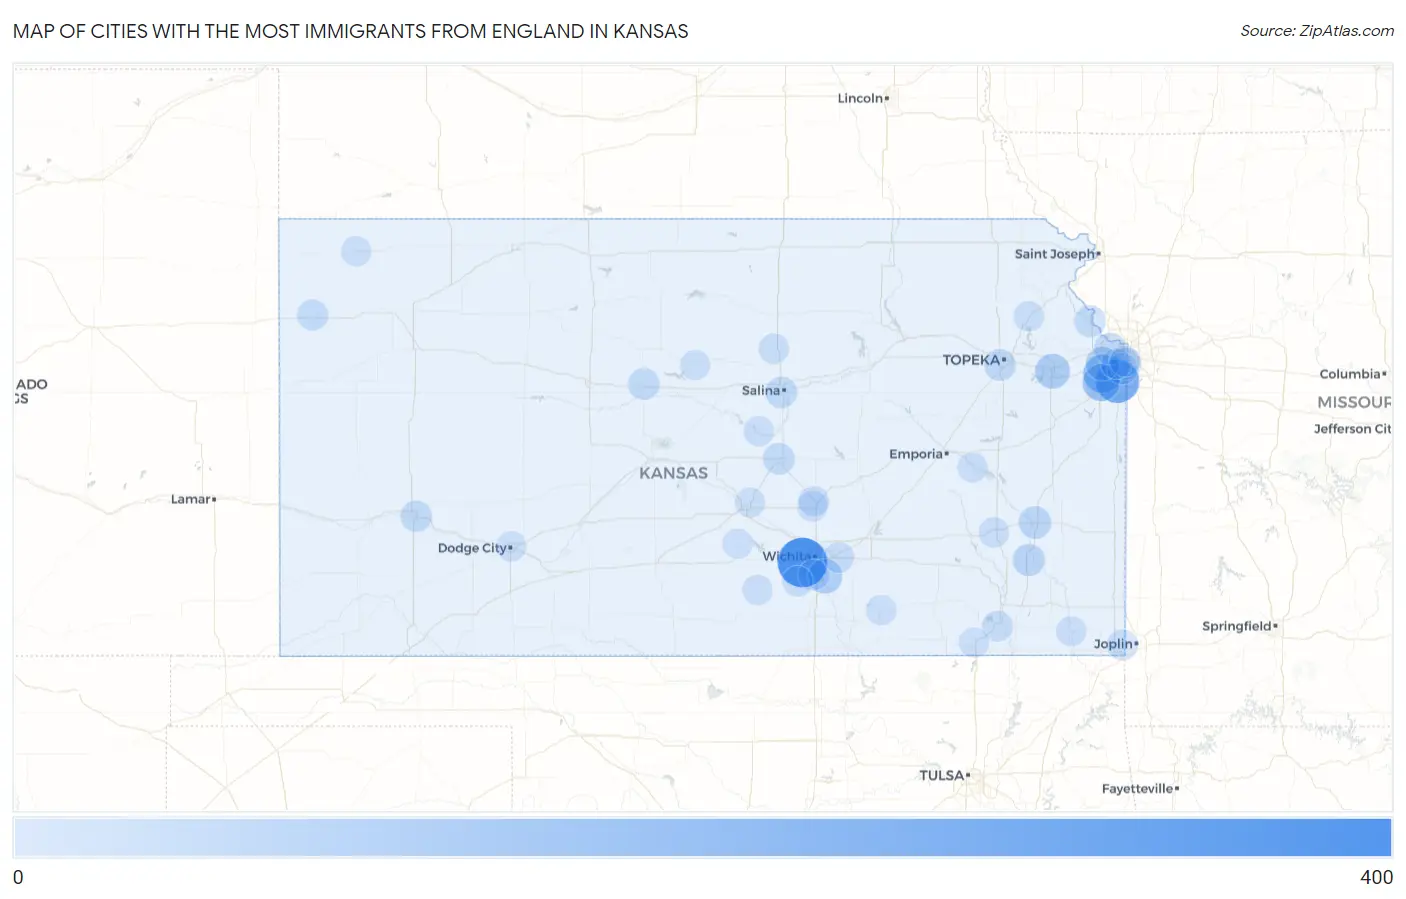
Map of Cities with the Most Immigrants from England in Kansas
0
400
Cities with the Most Immigrants from England in Kansas
| City | England | vs State | vs National | |
| 1. | Wichita | 372 | 1,646(22.60%)#1 | 318,896(0.12%)#76 |
| 2. | Overland Park | 250 | 1,646(15.19%)#2 | 318,896(0.08%)#135 |
| 3. | Lenexa | 153 | 1,646(9.30%)#3 | 318,896(0.05%)#277 |
| 4. | Olathe | 132 | 1,646(8.02%)#4 | 318,896(0.04%)#331 |
| 5. | Lawrence | 86 | 1,646(5.22%)#5 | 318,896(0.03%)#587 |
| 6. | Derby | 81 | 1,646(4.92%)#6 | 318,896(0.03%)#634 |
| 7. | Shawnee | 61 | 1,646(3.71%)#7 | 318,896(0.02%)#863 |
| 8. | Iola | 45 | 1,646(2.73%)#8 | 318,896(0.01%)#1,215 |
| 9. | Chanute | 35 | 1,646(2.13%)#9 | 318,896(0.01%)#1,490 |
| 10. | Mission Hills | 35 | 1,646(2.13%)#10 | 318,896(0.01%)#1,495 |
| 11. | Kansas City | 28 | 1,646(1.70%)#11 | 318,896(0.01%)#1,762 |
| 12. | Topeka | 28 | 1,646(1.70%)#12 | 318,896(0.01%)#1,764 |
| 13. | Leavenworth | 26 | 1,646(1.58%)#13 | 318,896(0.01%)#1,864 |
| 14. | Mcpherson | 26 | 1,646(1.58%)#14 | 318,896(0.01%)#1,880 |
| 15. | Russell | 26 | 1,646(1.58%)#15 | 318,896(0.01%)#1,893 |
| 16. | Salina | 23 | 1,646(1.40%)#16 | 318,896(0.01%)#2,030 |
| 17. | Garden City | 22 | 1,646(1.34%)#17 | 318,896(0.01%)#2,105 |
| 18. | Prairie Village | 20 | 1,646(1.22%)#18 | 318,896(0.01%)#2,262 |
| 19. | Goodland | 18 | 1,646(1.09%)#19 | 318,896(0.01%)#2,495 |
| 20. | Haysville | 15 | 1,646(0.91%)#20 | 318,896(0.00%)#2,753 |
| 21. | Independence | 12 | 1,646(0.73%)#21 | 318,896(0.00%)#3,088 |
| 22. | Clearwater | 12 | 1,646(0.73%)#22 | 318,896(0.00%)#3,130 |
| 23. | Andover | 10 | 1,646(0.61%)#23 | 318,896(0.00%)#3,385 |
| 24. | Galena | 10 | 1,646(0.61%)#24 | 318,896(0.00%)#3,460 |
| 25. | Newton | 8 | 1,646(0.49%)#25 | 318,896(0.00%)#3,709 |
| 26. | Merriam | 6 | 1,646(0.36%)#26 | 318,896(0.00%)#4,063 |
| 27. | Westwood | 5 | 1,646(0.30%)#27 | 318,896(0.00%)#4,300 |
| 28. | North Newton | 4 | 1,646(0.24%)#28 | 318,896(0.00%)#4,429 |
| 29. | Minneapolis | 4 | 1,646(0.24%)#29 | 318,896(0.00%)#4,431 |
| 30. | Yates Center | 4 | 1,646(0.24%)#30 | 318,896(0.00%)#4,462 |
| 31. | Valley Falls | 4 | 1,646(0.24%)#31 | 318,896(0.00%)#4,475 |
| 32. | Dodge City | 3 | 1,646(0.18%)#32 | 318,896(0.00%)#4,533 |
| 33. | Sylvan Grove | 3 | 1,646(0.18%)#33 | 318,896(0.00%)#4,718 |
| 34. | Oswego | 2 | 1,646(0.12%)#34 | 318,896(0.00%)#4,783 |
| 35. | Marquette | 2 | 1,646(0.12%)#35 | 318,896(0.00%)#4,872 |
| 36. | Burden | 2 | 1,646(0.12%)#36 | 318,896(0.00%)#4,898 |
| 37. | Norwich | 2 | 1,646(0.12%)#37 | 318,896(0.00%)#4,910 |
| 38. | Hutchinson | 1 | 1,646(0.06%)#38 | 318,896(0.00%)#4,963 |
| 39. | Pretty Prairie | 1 | 1,646(0.06%)#39 | 318,896(0.00%)#5,031 |
| 40. | Hartford | 1 | 1,646(0.06%)#40 | 318,896(0.00%)#5,045 |
| 41. | Mcdonald | 1 | 1,646(0.06%)#41 | 318,896(0.00%)#5,080 |
| 42. | Havana | 1 | 1,646(0.06%)#42 | 318,896(0.00%)#5,093 |
Common Questions
What are the Top 10 Cities with the Most Immigrants from England in Kansas?
Top 10 Cities with the Most Immigrants from England in Kansas are:
#1
372
#2
250
#3
153
#4
132
#5
86
#6
81
#7
61
#8
45
#9
35
#10
35
What city has the Most Immigrants from England in Kansas?
Wichita has the Most Immigrants from England in Kansas with 372.
What is the Total Immigrants from England in the State of Kansas?
Total Immigrants from England in Kansas is 1,646.
What is the Total Immigrants from England in the United States?
Total Immigrants from England in the United States is 318,896.