Cities with the Most Immigrants from England in Missouri
RELATED REPORTS & OPTIONS
England
Missouri
Compare Cities
Map of Cities with the Most Immigrants from England in Missouri
0
400
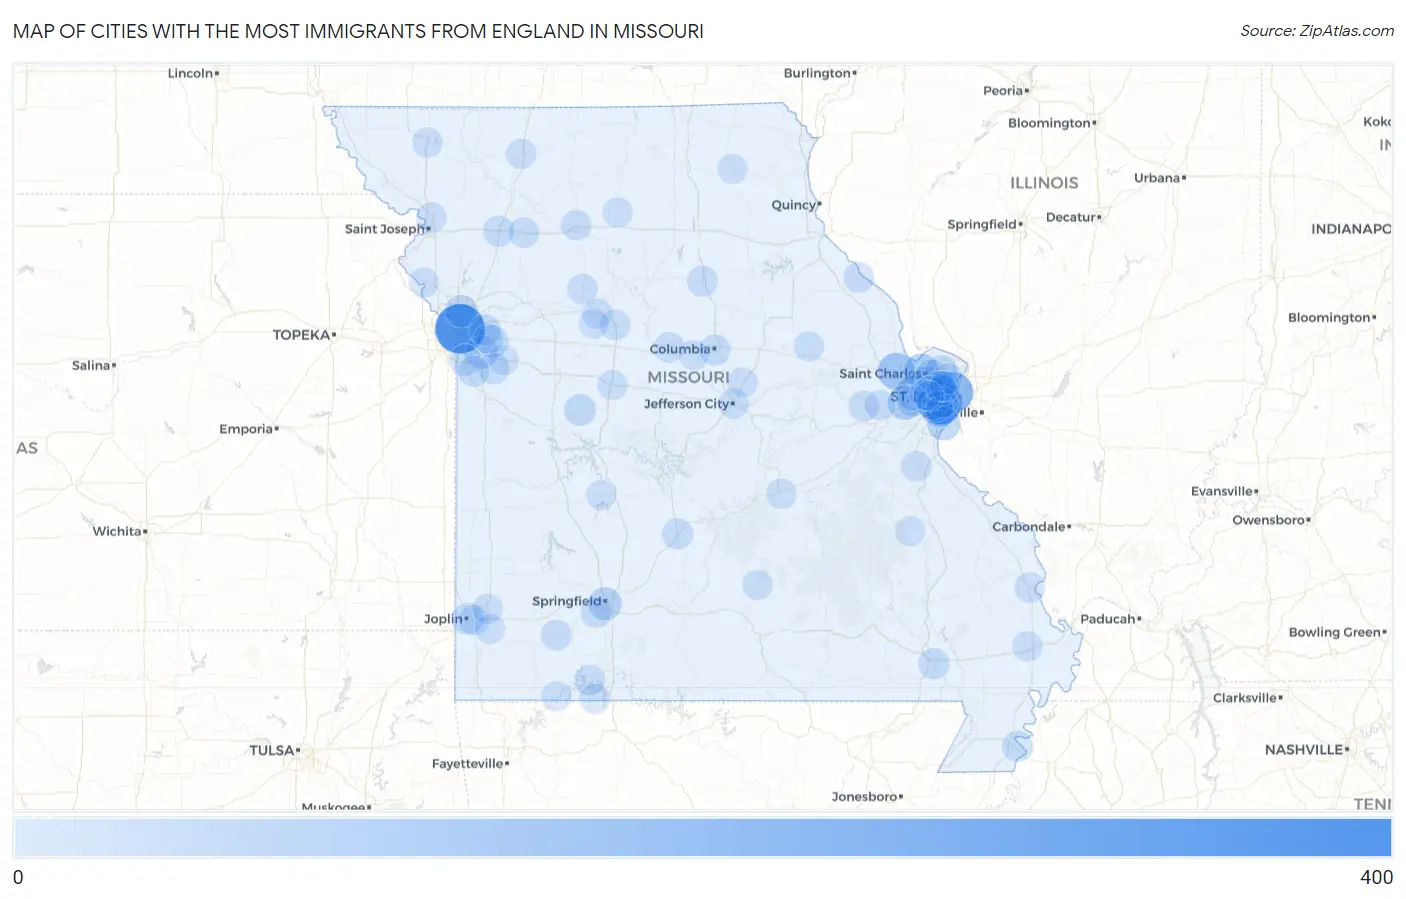
Cities with the Most Immigrants from England in Missouri
| City | England | vs State | vs National | |
| 1. | Kansas City | 326 | 2,796(11.66%)#1 | 318,896(0.10%)#93 |
| 2. | Webster Groves | 232 | 2,796(8.30%)#2 | 318,896(0.07%)#152 |
| 3. | St Louis | 185 | 2,796(6.62%)#3 | 318,896(0.06%)#211 |
| 4. | O Fallon | 111 | 2,796(3.97%)#4 | 318,896(0.03%)#436 |
| 5. | St Charles | 79 | 2,796(2.83%)#5 | 318,896(0.02%)#653 |
| 6. | Chesterfield | 78 | 2,796(2.79%)#6 | 318,896(0.02%)#665 |
| 7. | Wildwood | 72 | 2,796(2.58%)#7 | 318,896(0.02%)#734 |
| 8. | Affton | 69 | 2,796(2.47%)#8 | 318,896(0.02%)#767 |
| 9. | Oakville | 52 | 2,796(1.86%)#9 | 318,896(0.02%)#1,025 |
| 10. | Springfield | 50 | 2,796(1.79%)#10 | 318,896(0.02%)#1,061 |
| 11. | Clayton | 49 | 2,796(1.75%)#11 | 318,896(0.02%)#1,101 |
| 12. | Lee S Summit | 39 | 2,796(1.39%)#12 | 318,896(0.01%)#1,348 |
| 13. | Gladstone | 36 | 2,796(1.29%)#13 | 318,896(0.01%)#1,443 |
| 14. | Maryland Heights | 35 | 2,796(1.25%)#14 | 318,896(0.01%)#1,475 |
| 15. | Blue Springs | 29 | 2,796(1.04%)#15 | 318,896(0.01%)#1,711 |
| 16. | Florissant | 29 | 2,796(1.04%)#16 | 318,896(0.01%)#1,714 |
| 17. | Windsor | 26 | 2,796(0.93%)#17 | 318,896(0.01%)#1,895 |
| 18. | Joplin | 24 | 2,796(0.86%)#18 | 318,896(0.01%)#1,964 |
| 19. | Independence | 23 | 2,796(0.82%)#19 | 318,896(0.01%)#2,020 |
| 20. | Kirkwood | 22 | 2,796(0.79%)#20 | 318,896(0.01%)#2,104 |
| 21. | Grandview | 22 | 2,796(0.79%)#21 | 318,896(0.01%)#2,108 |
| 22. | Bridgeton | 22 | 2,796(0.79%)#22 | 318,896(0.01%)#2,125 |
| 23. | Ellisville | 19 | 2,796(0.68%)#23 | 318,896(0.01%)#2,375 |
| 24. | Poplar Bluff | 18 | 2,796(0.64%)#24 | 318,896(0.01%)#2,441 |
| 25. | Cameron | 18 | 2,796(0.64%)#25 | 318,896(0.01%)#2,467 |
| 26. | Columbia | 17 | 2,796(0.61%)#26 | 318,896(0.01%)#2,522 |
| 27. | Lebanon | 17 | 2,796(0.61%)#27 | 318,896(0.01%)#2,551 |
| 28. | Pleasant Hill | 17 | 2,796(0.61%)#28 | 318,896(0.01%)#2,571 |
| 29. | Raymore | 16 | 2,796(0.57%)#29 | 318,896(0.01%)#2,626 |
| 30. | Green Park | 16 | 2,796(0.57%)#30 | 318,896(0.01%)#2,679 |
| 31. | Lake Timberline | 15 | 2,796(0.54%)#31 | 318,896(0.00%)#2,801 |
| 32. | Caruthersville | 14 | 2,796(0.50%)#32 | 318,896(0.00%)#2,878 |
| 33. | Overland | 13 | 2,796(0.46%)#33 | 318,896(0.00%)#2,946 |
| 34. | De Soto | 13 | 2,796(0.46%)#34 | 318,896(0.00%)#2,976 |
| 35. | Battlefield | 13 | 2,796(0.46%)#35 | 318,896(0.00%)#2,978 |
| 36. | Moberly | 12 | 2,796(0.43%)#36 | 318,896(0.00%)#3,067 |
| 37. | Aurora | 12 | 2,796(0.43%)#37 | 318,896(0.00%)#3,094 |
| 38. | Washington | 11 | 2,796(0.39%)#38 | 318,896(0.00%)#3,208 |
| 39. | Boonville | 11 | 2,796(0.39%)#39 | 318,896(0.00%)#3,247 |
| 40. | Creve Coeur | 10 | 2,796(0.36%)#40 | 318,896(0.00%)#3,373 |
| 41. | Shrewsbury | 10 | 2,796(0.36%)#41 | 318,896(0.00%)#3,429 |
| 42. | University City | 9 | 2,796(0.32%)#42 | 318,896(0.00%)#3,505 |
| 43. | Marshall | 9 | 2,796(0.32%)#43 | 318,896(0.00%)#3,546 |
| 44. | Crestwood | 9 | 2,796(0.32%)#44 | 318,896(0.00%)#3,560 |
| 45. | Chillicothe | 9 | 2,796(0.32%)#45 | 318,896(0.00%)#3,584 |
| 46. | Louisiana | 9 | 2,796(0.32%)#46 | 318,896(0.00%)#3,634 |
| 47. | Hamilton | 9 | 2,796(0.32%)#47 | 318,896(0.00%)#3,661 |
| 48. | Concord | 8 | 2,796(0.29%)#48 | 318,896(0.00%)#3,707 |
| 49. | Ferguson | 7 | 2,796(0.25%)#49 | 318,896(0.00%)#3,869 |
| 50. | Sikeston | 7 | 2,796(0.25%)#50 | 318,896(0.00%)#3,874 |
| 51. | Town And Country | 7 | 2,796(0.25%)#51 | 318,896(0.00%)#3,887 |
| 52. | Kimberling City | 7 | 2,796(0.25%)#52 | 318,896(0.00%)#3,962 |
| 53. | Duquesne | 7 | 2,796(0.25%)#53 | 318,896(0.00%)#3,967 |
| 54. | Cape Girardeau | 6 | 2,796(0.21%)#54 | 318,896(0.00%)#4,023 |
| 55. | Carrollton | 6 | 2,796(0.21%)#55 | 318,896(0.00%)#4,104 |
| 56. | Country Club | 6 | 2,796(0.21%)#56 | 318,896(0.00%)#4,107 |
| 57. | Jefferson City | 5 | 2,796(0.18%)#57 | 318,896(0.00%)#4,196 |
| 58. | Bethany | 5 | 2,796(0.18%)#58 | 318,896(0.00%)#4,266 |
| 59. | Augusta | 5 | 2,796(0.18%)#59 | 318,896(0.00%)#4,354 |
| 60. | Sedalia | 4 | 2,796(0.14%)#60 | 318,896(0.00%)#4,375 |
| 61. | Carthage | 4 | 2,796(0.14%)#61 | 318,896(0.00%)#4,380 |
| 62. | Montgomery City | 4 | 2,796(0.14%)#62 | 318,896(0.00%)#4,411 |
| 63. | Malta Bend | 4 | 2,796(0.14%)#63 | 318,896(0.00%)#4,529 |
| 64. | Rolla | 3 | 2,796(0.11%)#64 | 318,896(0.00%)#4,538 |
| 65. | Maryville | 3 | 2,796(0.11%)#65 | 318,896(0.00%)#4,546 |
| 66. | Houston | 3 | 2,796(0.11%)#66 | 318,896(0.00%)#4,585 |
| 67. | Weston | 3 | 2,796(0.11%)#67 | 318,896(0.00%)#4,606 |
| 68. | New Bloomfield | 3 | 2,796(0.11%)#68 | 318,896(0.00%)#4,669 |
| 69. | Wooldridge | 3 | 2,796(0.11%)#69 | 318,896(0.00%)#4,727 |
| 70. | Vinita Park | 2 | 2,796(0.07%)#70 | 318,896(0.00%)#4,778 |
| 71. | Edina | 2 | 2,796(0.07%)#71 | 318,896(0.00%)#4,809 |
| 72. | Lone Jack | 2 | 2,796(0.07%)#72 | 318,896(0.00%)#4,814 |
| 73. | Diamond | 2 | 2,796(0.07%)#73 | 318,896(0.00%)#4,836 |
| 74. | Greendale | 2 | 2,796(0.07%)#74 | 318,896(0.00%)#4,855 |
| 75. | Iron Mountain Lake | 2 | 2,796(0.07%)#75 | 318,896(0.00%)#4,857 |
| 76. | Hermitage | 2 | 2,796(0.07%)#76 | 318,896(0.00%)#4,875 |
| 77. | Chain O Lakes | 2 | 2,796(0.07%)#77 | 318,896(0.00%)#4,942 |
| 78. | Linneus | 2 | 2,796(0.07%)#78 | 318,896(0.00%)#4,947 |
| 79. | Country Life Acres | 2 | 2,796(0.07%)#79 | 318,896(0.00%)#4,954 |
| 80. | Mount Leonard | 2 | 2,796(0.07%)#80 | 318,896(0.00%)#4,957 |
| 81. | Lake Tapawingo | 1 | 2,796(0.04%)#81 | 318,896(0.00%)#5,022 |
| 82. | Blue Eye | 1 | 2,796(0.04%)#82 | 318,896(0.00%)#5,053 |
Common Questions
What are the Top 10 Cities with the Most Immigrants from England in Missouri?
Top 10 Cities with the Most Immigrants from England in Missouri are:
#1
326
#2
232
#3
185
#4
111
#5
79
#6
78
#7
72
#8
69
#9
52
#10
50
What city has the Most Immigrants from England in Missouri?
Kansas City has the Most Immigrants from England in Missouri with 326.
What is the Total Immigrants from England in the State of Missouri?
Total Immigrants from England in Missouri is 2,796.
What is the Total Immigrants from England in the United States?
Total Immigrants from England in the United States is 318,896.