Royal Lakes, IL
Royal Lakes Map
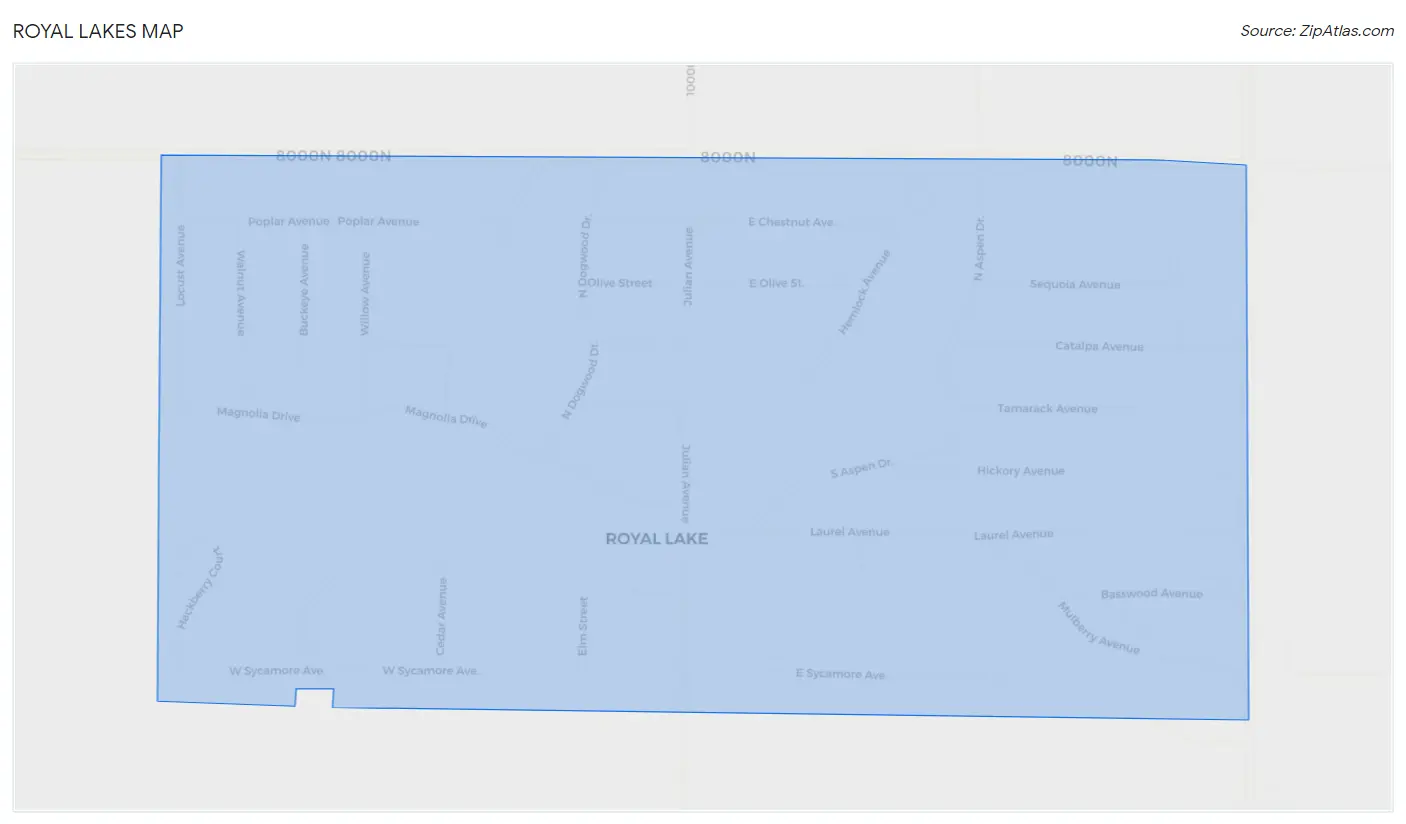
Royal Lakes Overview
273
TOTAL POPULATION
83
MALE POPULATION
190
FEMALE POPULATION
43.68
MALES / 100 FEMALES
228.92
FEMALES / 100 MALES
54.2
MEDIAN AGE
4.9
AVG FAMILY SIZE
2.7
AVG HOUSEHOLD SIZE
$13,380
PER CAPITA INCOME
$38,125
AVG FAMILY INCOME
0.47
INEQUALITY / GINI INDEX
36
LABOR FORCE [ PEOPLE ]
15.2%
PERCENT IN LABOR FORCE
30.6%
UNEMPLOYMENT RATE
Royal Lakes Area Codes
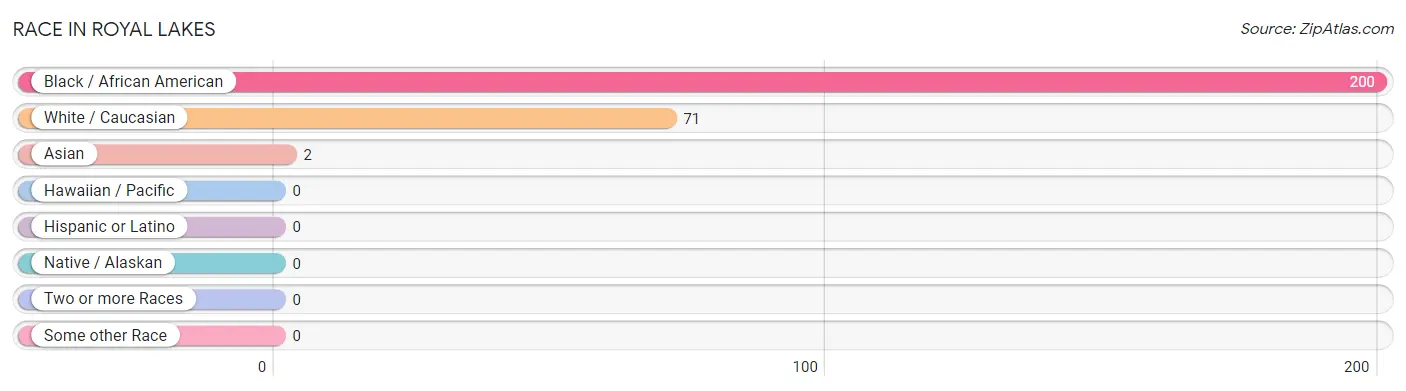
Race in Royal Lakes
The most populous races in Royal Lakes are Black / African American (200 | 73.3%), White / Caucasian (71 | 26.0%), and Asian (2 | 0.7%).
| Race | # Population | % Population |
| Asian | 2 | 0.7% |
| Black / African American | 200 | 73.3% |
| Hawaiian / Pacific | 0 | 0.0% |
| Hispanic or Latino | 0 | 0.0% |
| Native / Alaskan | 0 | 0.0% |
| White / Caucasian | 71 | 26.0% |
| Two or more Races | 0 | 0.0% |
| Some other Race | 0 | 0.0% |
| Total | 273 | 100.0% |
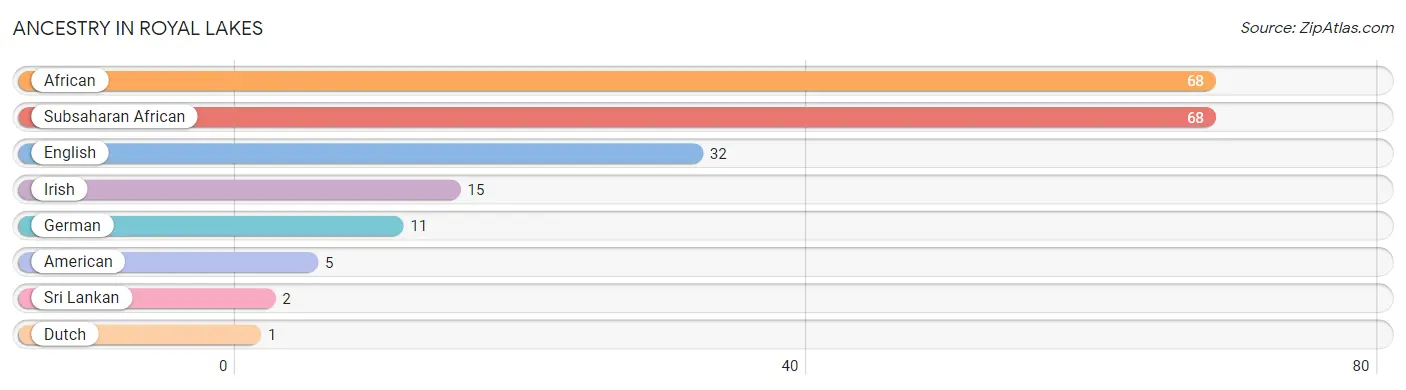
Ancestry in Royal Lakes
The most populous ancestries reported in Royal Lakes are African (68 | 24.9%), Subsaharan African (68 | 24.9%), English (32 | 11.7%), Irish (15 | 5.5%), and German (11 | 4.0%), together accounting for 71.1% of all Royal Lakes residents.
| Ancestry | # Population | % Population |
| African | 68 | 24.9% |
| American | 5 | 1.8% |
| Dutch | 1 | 0.4% |
| English | 32 | 11.7% |
| German | 11 | 4.0% |
| Irish | 15 | 5.5% |
| Sri Lankan | 2 | 0.7% |
| Subsaharan African | 68 | 24.9% | View All 8 Rows |
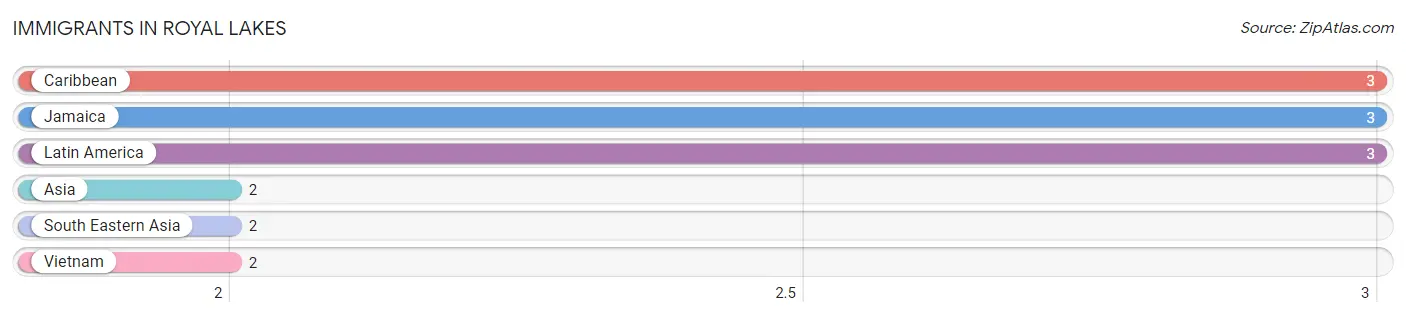
Immigrants in Royal Lakes
The most numerous immigrant groups reported in Royal Lakes came from Caribbean (3 | 1.1%), Jamaica (3 | 1.1%), Latin America (3 | 1.1%), Asia (2 | 0.7%), and South Eastern Asia (2 | 0.7%), together accounting for 4.8% of all Royal Lakes residents.
| Immigration Origin | # Population | % Population |
| Asia | 2 | 0.7% |
| Caribbean | 3 | 1.1% |
| Jamaica | 3 | 1.1% |
| Latin America | 3 | 1.1% |
| South Eastern Asia | 2 | 0.7% |
| Vietnam | 2 | 0.7% | View All 6 Rows |
Sex and Age in Royal Lakes
Sex and Age in Royal Lakes
The most populous age groups in Royal Lakes are 55 to 59 Years (16 | 19.3%) for men and 20 to 24 Years (38 | 20.0%) for women.
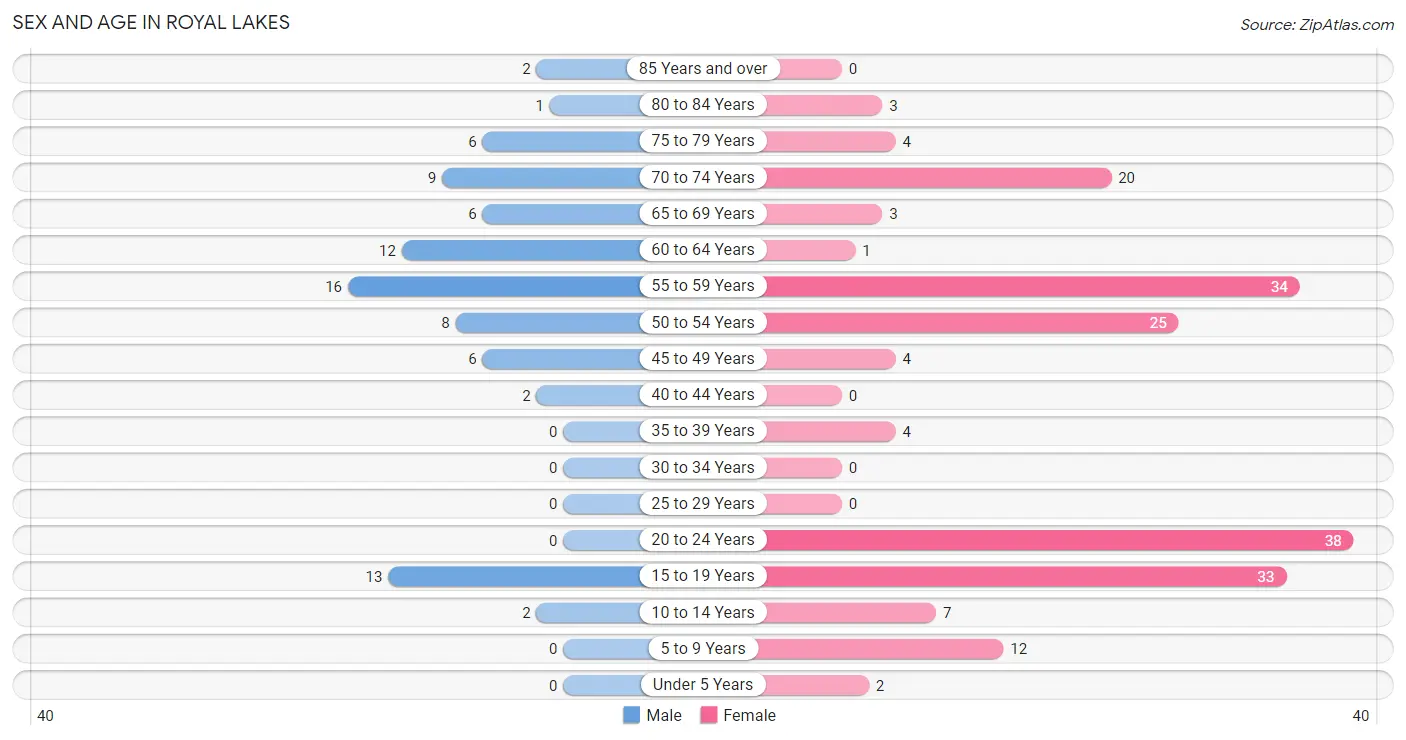
| Age Bracket | Male | Female |
| Under 5 Years | 0 (0.0%) | 2 (1.1%) |
| 5 to 9 Years | 0 (0.0%) | 12 (6.3%) |
| 10 to 14 Years | 2 (2.4%) | 7 (3.7%) |
| 15 to 19 Years | 13 (15.7%) | 33 (17.4%) |
| 20 to 24 Years | 0 (0.0%) | 38 (20.0%) |
| 25 to 29 Years | 0 (0.0%) | 0 (0.0%) |
| 30 to 34 Years | 0 (0.0%) | 0 (0.0%) |
| 35 to 39 Years | 0 (0.0%) | 4 (2.1%) |
| 40 to 44 Years | 2 (2.4%) | 0 (0.0%) |
| 45 to 49 Years | 6 (7.2%) | 4 (2.1%) |
| 50 to 54 Years | 8 (9.6%) | 25 (13.2%) |
| 55 to 59 Years | 16 (19.3%) | 34 (17.9%) |
| 60 to 64 Years | 12 (14.5%) | 1 (0.5%) |
| 65 to 69 Years | 6 (7.2%) | 3 (1.6%) |
| 70 to 74 Years | 9 (10.8%) | 20 (10.5%) |
| 75 to 79 Years | 6 (7.2%) | 4 (2.1%) |
| 80 to 84 Years | 1 (1.2%) | 3 (1.6%) |
| 85 Years and over | 2 (2.4%) | 0 (0.0%) |
| Total | 83 (100.0%) | 190 (100.0%) |
Families and Households in Royal Lakes
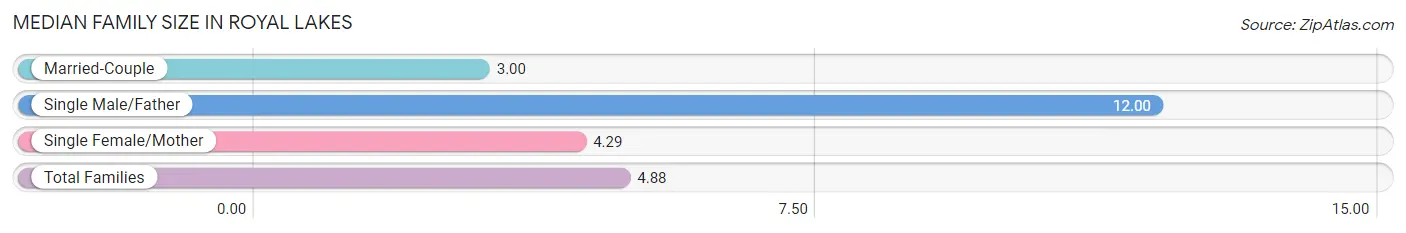
Median Family Size in Royal Lakes
The median family size in Royal Lakes is 4.88 persons per family, with single male/father families (8 | 18.6%) accounting for the largest median family size of 12 persons per family. On the other hand, married-couple families (28 | 65.1%) represent the smallest median family size with 3.00 persons per family.
| Family Type | # Families | Family Size |
| Married-Couple | 28 (65.1%) | 3.00 |
| Single Male/Father | 8 (18.6%) | 12.00 |
| Single Female/Mother | 7 (16.3%) | 4.29 |
| Total Families | 43 (100.0%) | 4.88 |
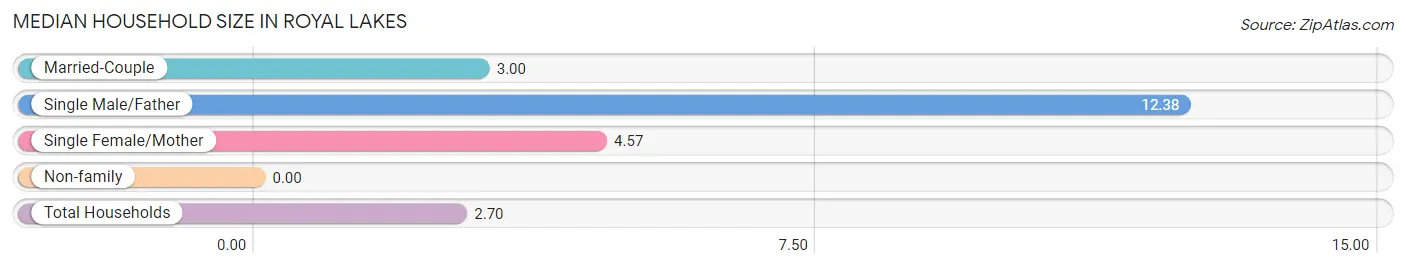
Median Household Size in Royal Lakes
| Household Type | # Households | Household Size |
| Married-Couple | 28 (27.7%) | 3.00 |
| Single Male/Father | 8 (7.9%) | 12.38 |
| Single Female/Mother | 7 (6.9%) | 4.57 |
| Non-family | 58 (57.4%) | - |
| Total Households | 101 (100.0%) | 2.70 |
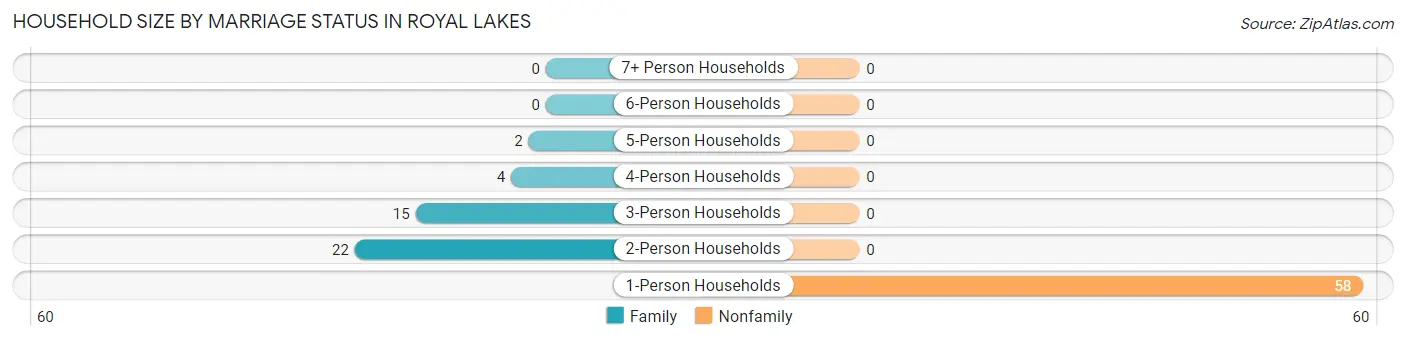
Household Size by Marriage Status in Royal Lakes
Out of a total of 101 households in Royal Lakes, 43 (42.6%) are family households, while 58 (57.4%) are nonfamily households. The most numerous type of family households are 2-person households, comprising 22, and the most common type of nonfamily households are 1-person households, comprising 58.
| Household Size | Family Households | Nonfamily Households |
| 1-Person Households | - | 58 (57.4%) |
| 2-Person Households | 22 (21.8%) | 0 (0.0%) |
| 3-Person Households | 15 (14.8%) | 0 (0.0%) |
| 4-Person Households | 4 (4.0%) | 0 (0.0%) |
| 5-Person Households | 2 (2.0%) | 0 (0.0%) |
| 6-Person Households | 0 (0.0%) | 0 (0.0%) |
| 7+ Person Households | 0 (0.0%) | 0 (0.0%) |
| Total | 43 (42.6%) | 58 (57.4%) |
Female Fertility in Royal Lakes
Fertility by Age in Royal Lakes
| Age Bracket | Women with Births | Births / 1,000 Women |
| 15 to 19 years | 0 (0.0%) | 0.0 |
| 20 to 34 years | 0 (0.0%) | 0.0 |
| 35 to 50 years | 0 (0.0%) | 0.0 |
| Total | 0 (0.0%) | 0.0 |
Fertility by Age by Marriage Status in Royal Lakes
| Age Bracket | Married | Unmarried |
| 15 to 19 years | 0 (0.0%) | 0 (0.0%) |
| 20 to 34 years | 0 (0.0%) | 0 (0.0%) |
| 35 to 50 years | 0 (0.0%) | 0 (0.0%) |
| Total | 0 (0.0%) | 0 (0.0%) |
Fertility by Education in Royal Lakes
| Educational Attainment | Women with Births | Births / 1,000 Women |
| Less than High School | 0 (0.0%) | 0.0 |
| High School Diploma | 0 (0.0%) | 0.0 |
| College or Associate's Degree | 0 (0.0%) | 0.0 |
| Bachelor's Degree | 0 (0.0%) | 0.0 |
| Graduate Degree | 0 (0.0%) | 0.0 |
| Total | 0 (0.0%) | 0.0 |
Fertility by Education by Marriage Status in Royal Lakes
| Educational Attainment | Married | Unmarried |
| Less than High School | 0 (0.0%) | 0 (0.0%) |
| High School Diploma | 0 (0.0%) | 0 (0.0%) |
| College or Associate's Degree | 0 (0.0%) | 0 (0.0%) |
| Bachelor's Degree | 0 (0.0%) | 0 (0.0%) |
| Graduate Degree | 0 (0.0%) | 0 (0.0%) |
| Total | 0 (0.0%) | 0 (0.0%) |
Income in Royal Lakes
Income Overview in Royal Lakes
| Characteristic | Number | Measure |
| Per Capita Income | 273 | $13,380 |
| Median Family Income | 43 | $38,125 |
| Mean Family Income | 43 | $35,440 |
| Median Household Income | 101 | $0 |
| Mean Household Income | 101 | $25,984 |
| Income Deficit | 43 | $0 |
| Wage / Income Gap (%) | 273 | 0.00% |
| Wage / Income Gap ($) | 273 | 100.00¢ per $1 |
| Gini / Inequality Index | 273 | 0.47 |
Earnings by Sex in Royal Lakes
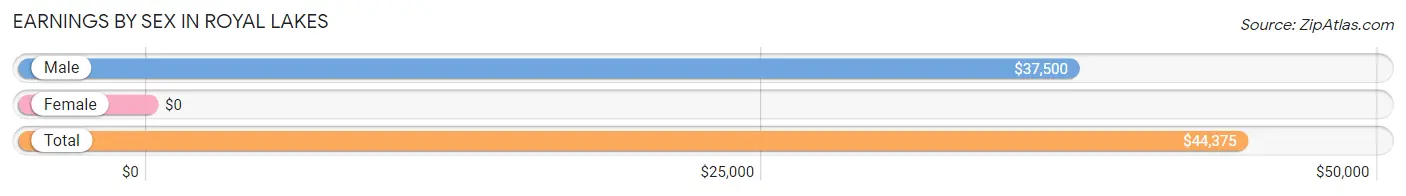
| Sex | Number | Average Earnings |
| Male | 12 (20.3%) | $37,500 |
| Female | 47 (79.7%) | $0 |
| Total | 59 (100.0%) | $44,375 |
Earnings by Sex by Income Bracket in Royal Lakes
The most common earnings brackets in Royal Lakes are $12,500 to $14,999 for men (4 | 33.3%) and $45,000 to $49,999 for women (25 | 53.2%).
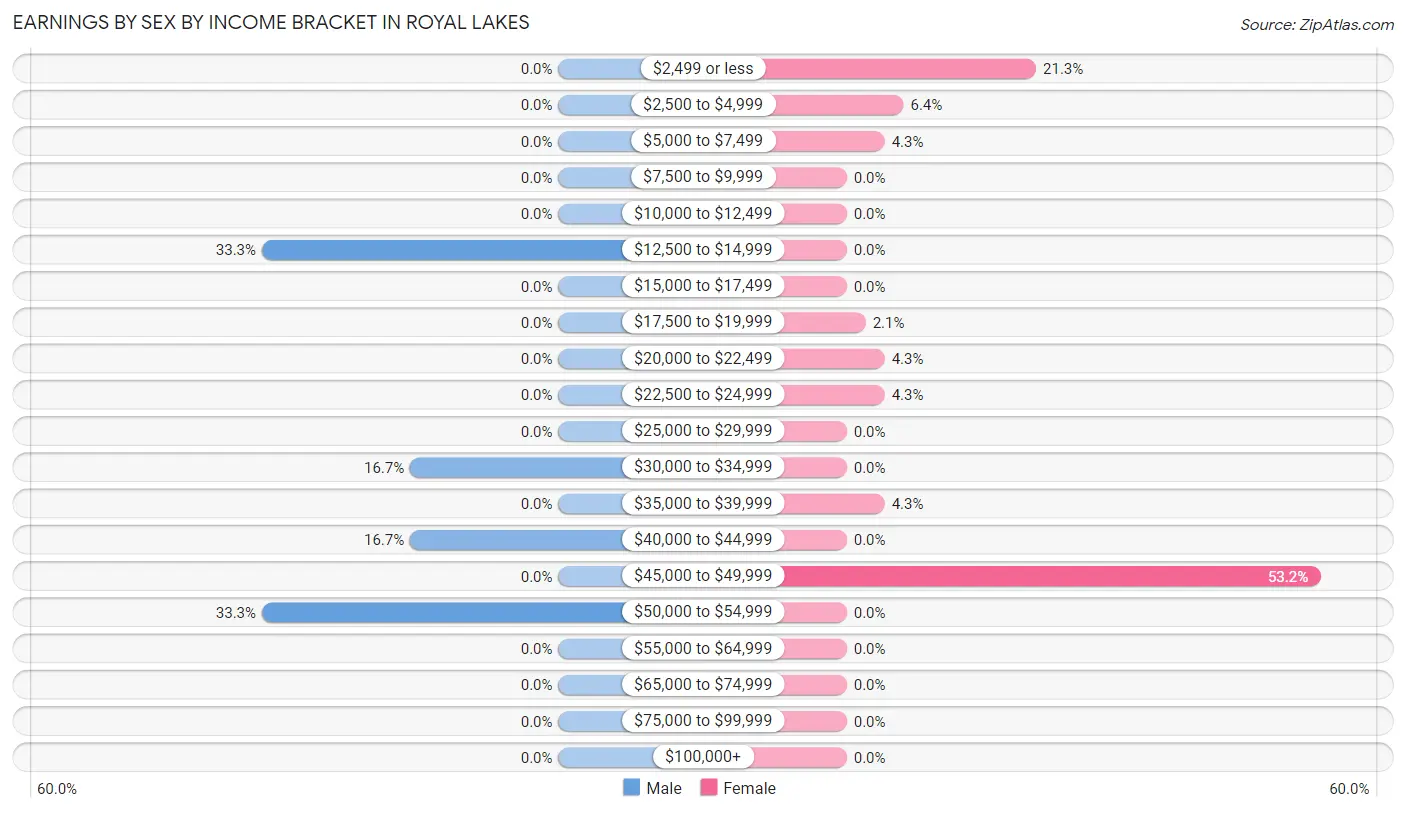
| Income | Male | Female |
| $2,499 or less | 0 (0.0%) | 10 (21.3%) |
| $2,500 to $4,999 | 0 (0.0%) | 3 (6.4%) |
| $5,000 to $7,499 | 0 (0.0%) | 2 (4.3%) |
| $7,500 to $9,999 | 0 (0.0%) | 0 (0.0%) |
| $10,000 to $12,499 | 0 (0.0%) | 0 (0.0%) |
| $12,500 to $14,999 | 4 (33.3%) | 0 (0.0%) |
| $15,000 to $17,499 | 0 (0.0%) | 0 (0.0%) |
| $17,500 to $19,999 | 0 (0.0%) | 1 (2.1%) |
| $20,000 to $22,499 | 0 (0.0%) | 2 (4.3%) |
| $22,500 to $24,999 | 0 (0.0%) | 2 (4.3%) |
| $25,000 to $29,999 | 0 (0.0%) | 0 (0.0%) |
| $30,000 to $34,999 | 2 (16.7%) | 0 (0.0%) |
| $35,000 to $39,999 | 0 (0.0%) | 2 (4.3%) |
| $40,000 to $44,999 | 2 (16.7%) | 0 (0.0%) |
| $45,000 to $49,999 | 0 (0.0%) | 25 (53.2%) |
| $50,000 to $54,999 | 4 (33.3%) | 0 (0.0%) |
| $55,000 to $64,999 | 0 (0.0%) | 0 (0.0%) |
| $65,000 to $74,999 | 0 (0.0%) | 0 (0.0%) |
| $75,000 to $99,999 | 0 (0.0%) | 0 (0.0%) |
| $100,000+ | 0 (0.0%) | 0 (0.0%) |
| Total | 12 (100.0%) | 47 (100.0%) |
Earnings by Sex by Educational Attainment in Royal Lakes
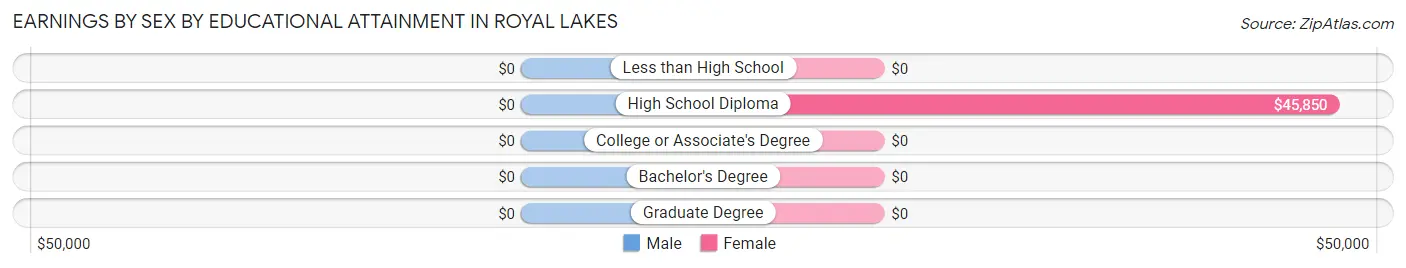
| Educational Attainment | Male Income | Female Income |
| Less than High School | - | - |
| High School Diploma | - | - |
| College or Associate's Degree | - | - |
| Bachelor's Degree | - | - |
| Graduate Degree | - | - |
| Total | $37,500 | $45,350 |
Family Income in Royal Lakes
Family Income Brackets in Royal Lakes
According to the Royal Lakes family income data, there are 14 families falling into the less than $10,000 income range, which is the most common income bracket and makes up 32.6% of all families.
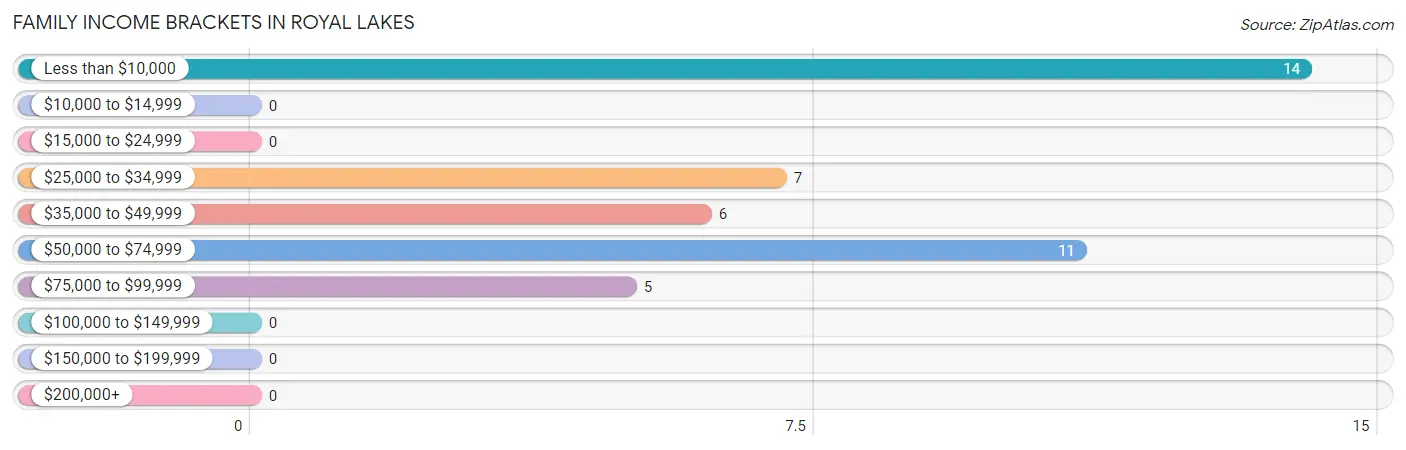
| Income Bracket | # Families | % Families |
| Less than $10,000 | 14 | 32.6% |
| $10,000 to $14,999 | 0 | 0.0% |
| $15,000 to $24,999 | 0 | 0.0% |
| $25,000 to $34,999 | 7 | 16.3% |
| $35,000 to $49,999 | 6 | 14.0% |
| $50,000 to $74,999 | 11 | 25.6% |
| $75,000 to $99,999 | 5 | 11.6% |
| $100,000 to $149,999 | 0 | 0.0% |
| $150,000 to $199,999 | 0 | 0.0% |
| $200,000+ | 0 | 0.0% |
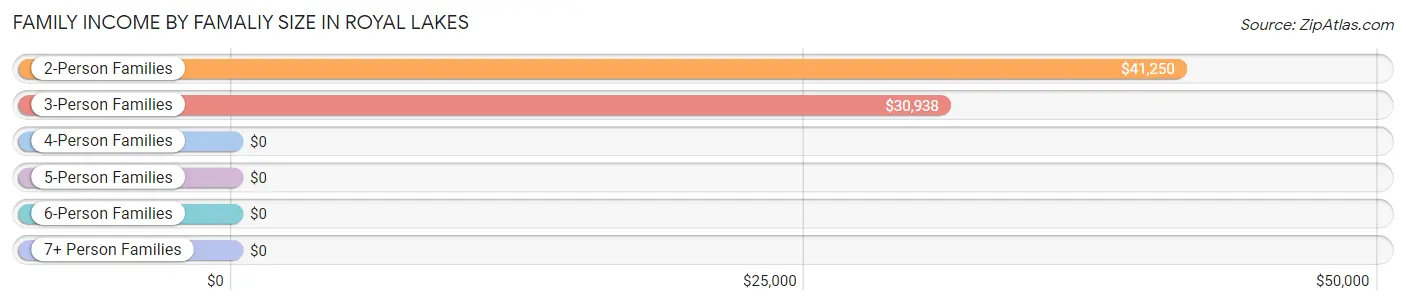
Family Income by Famaliy Size in Royal Lakes
2-person families (22 | 51.2%) account for the highest median family income in Royal Lakes with $41,250 per family, while 2-person families (22 | 51.2%) have the highest median income of $20,625 per family member.
| Income Bracket | # Families | Median Income |
| 2-Person Families | 22 (51.2%) | $41,250 |
| 3-Person Families | 19 (44.2%) | $30,938 |
| 4-Person Families | 2 (4.6%) | $0 |
| 5-Person Families | 0 (0.0%) | $0 |
| 6-Person Families | 0 (0.0%) | $0 |
| 7+ Person Families | 0 (0.0%) | $0 |
| Total | 43 (100.0%) | $38,125 |
Family Income by Number of Earners in Royal Lakes
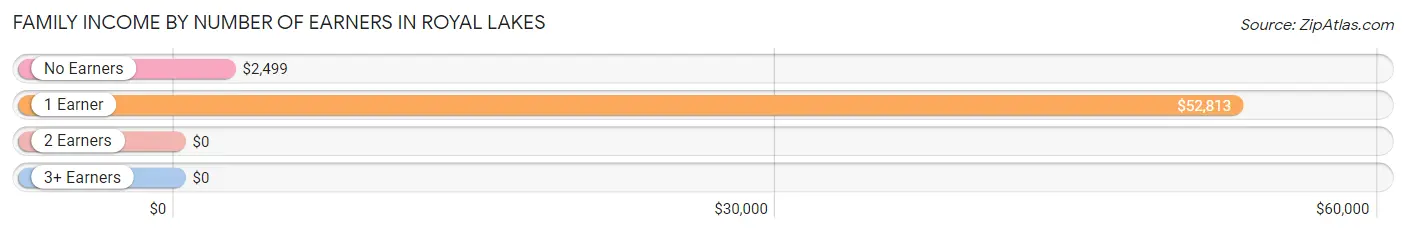
| Number of Earners | # Families | Median Income |
| No Earners | 22 (51.2%) | $2,499 |
| 1 Earner | 17 (39.5%) | $52,813 |
| 2 Earners | 4 (9.3%) | $0 |
| 3+ Earners | 0 (0.0%) | $0 |
| Total | 43 (100.0%) | $38,125 |
Household Income in Royal Lakes
Household Income Brackets in Royal Lakes
With 36 households falling in the category, the $10,000 to $14,999 income range is the most frequent in Royal Lakes, accounting for 35.6% of all households.
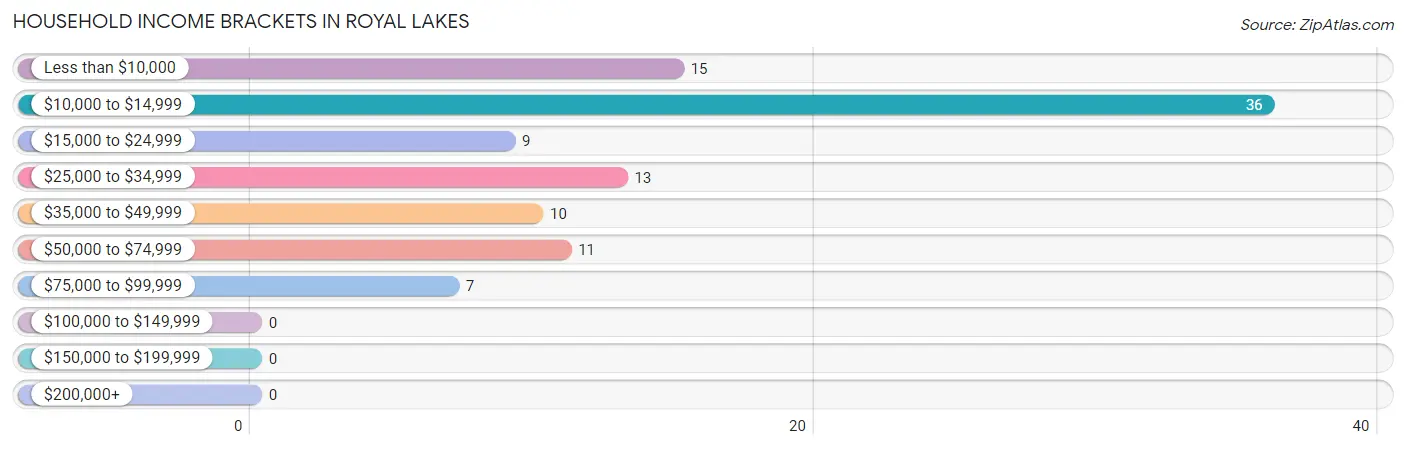
| Income Bracket | # Households | % Households |
| Less than $10,000 | 15 | 14.9% |
| $10,000 to $14,999 | 36 | 35.6% |
| $15,000 to $24,999 | 9 | 8.9% |
| $25,000 to $34,999 | 13 | 12.9% |
| $35,000 to $49,999 | 10 | 9.9% |
| $50,000 to $74,999 | 11 | 10.9% |
| $75,000 to $99,999 | 7 | 6.9% |
| $100,000 to $149,999 | 0 | 0.0% |
| $150,000 to $199,999 | 0 | 0.0% |
| $200,000+ | 0 | 0.0% |
Household Income by Householder Age in Royal Lakes
| Income Bracket | # Households | Median Income |
| 15 to 24 Years | 0 (0.0%) | $0 |
| 25 to 44 Years | 4 (4.0%) | $0 |
| 45 to 64 Years | 63 (62.4%) | $0 |
| 65+ Years | 34 (33.7%) | $0 |
| Total | 101 (100.0%) | $0 |
Poverty in Royal Lakes
Income Below Poverty by Sex and Age in Royal Lakes
With 33.7% poverty level for males and 26.8% for females among the residents of Royal Lakes, 65 to 74 year old males and 55 to 64 year old females are the most vulnerable to poverty, with 14 males (93.3%) and 30 females (85.7%) in their respective age groups living below the poverty level.
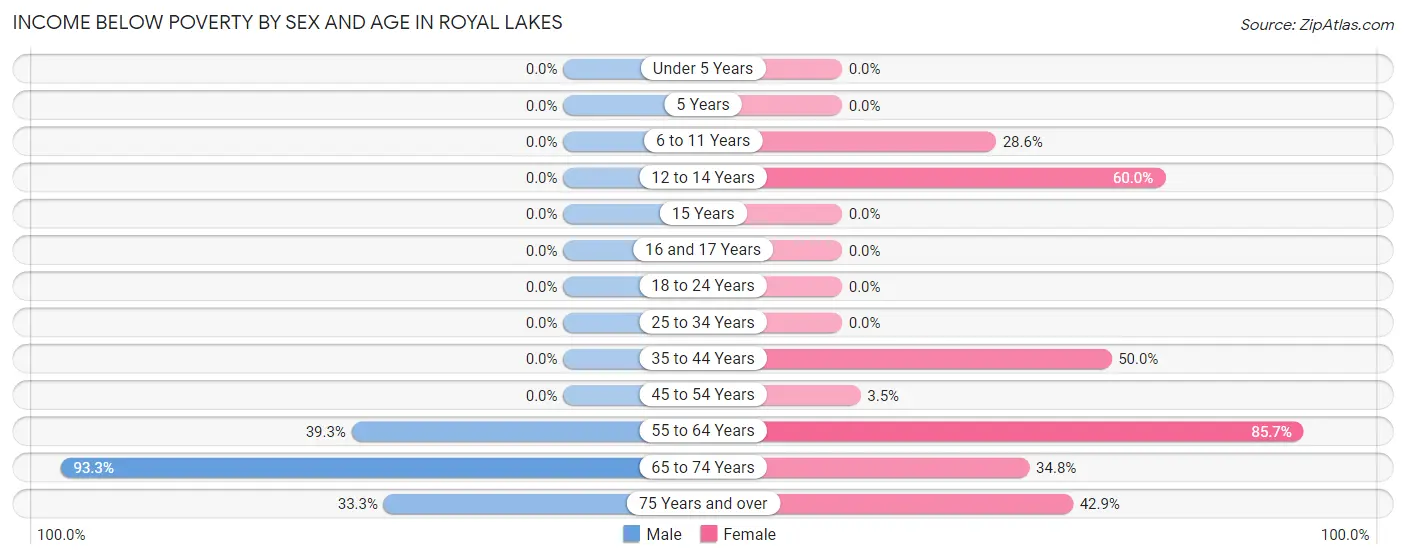
| Age Bracket | Male | Female |
| Under 5 Years | 0 (0.0%) | 0 (0.0%) |
| 5 Years | 0 (0.0%) | 0 (0.0%) |
| 6 to 11 Years | 0 (0.0%) | 4 (28.6%) |
| 12 to 14 Years | 0 (0.0%) | 3 (60.0%) |
| 15 Years | 0 (0.0%) | 0 (0.0%) |
| 16 and 17 Years | 0 (0.0%) | 0 (0.0%) |
| 18 to 24 Years | 0 (0.0%) | 0 (0.0%) |
| 25 to 34 Years | 0 (0.0%) | 0 (0.0%) |
| 35 to 44 Years | 0 (0.0%) | 2 (50.0%) |
| 45 to 54 Years | 0 (0.0%) | 1 (3.5%) |
| 55 to 64 Years | 11 (39.3%) | 30 (85.7%) |
| 65 to 74 Years | 14 (93.3%) | 8 (34.8%) |
| 75 Years and over | 3 (33.3%) | 3 (42.9%) |
| Total | 28 (33.7%) | 51 (26.8%) |
Income Above Poverty by Sex and Age in Royal Lakes
According to the poverty statistics in Royal Lakes, males aged 12 to 14 years and females aged under 5 years are the age groups that are most secure financially, with 100.0% of males and 100.0% of females in these age groups living above the poverty line.
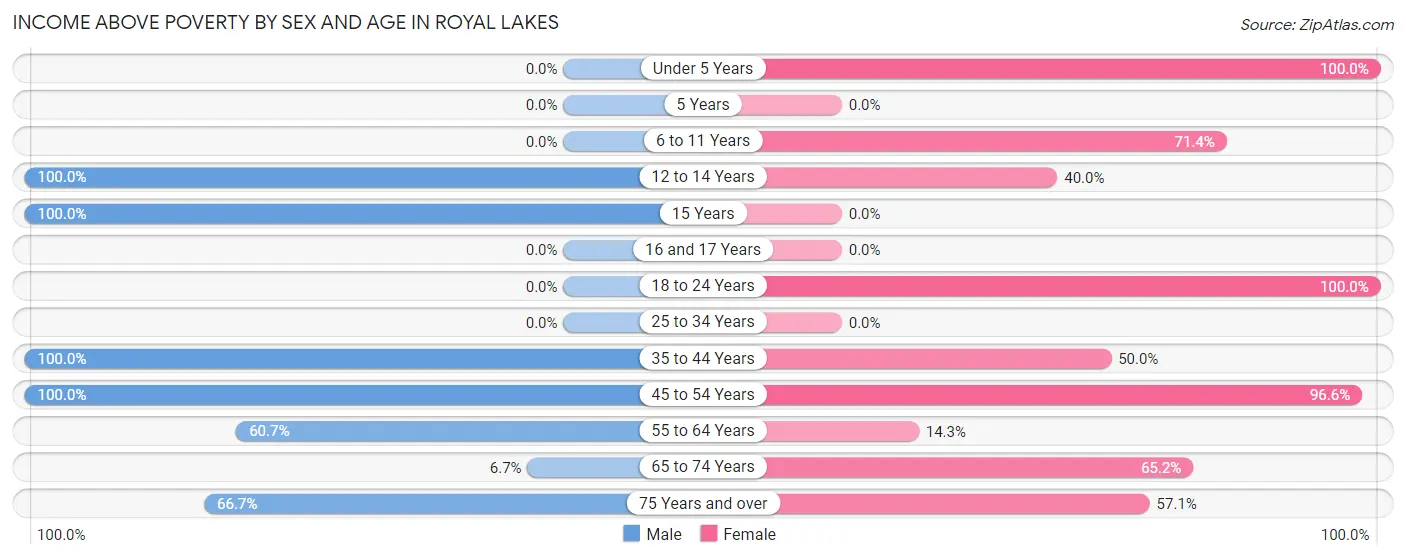
| Age Bracket | Male | Female |
| Under 5 Years | 0 (0.0%) | 2 (100.0%) |
| 5 Years | 0 (0.0%) | 0 (0.0%) |
| 6 to 11 Years | 0 (0.0%) | 10 (71.4%) |
| 12 to 14 Years | 2 (100.0%) | 2 (40.0%) |
| 15 Years | 13 (100.0%) | 0 (0.0%) |
| 16 and 17 Years | 0 (0.0%) | 0 (0.0%) |
| 18 to 24 Years | 0 (0.0%) | 71 (100.0%) |
| 25 to 34 Years | 0 (0.0%) | 0 (0.0%) |
| 35 to 44 Years | 2 (100.0%) | 2 (50.0%) |
| 45 to 54 Years | 14 (100.0%) | 28 (96.6%) |
| 55 to 64 Years | 17 (60.7%) | 5 (14.3%) |
| 65 to 74 Years | 1 (6.7%) | 15 (65.2%) |
| 75 Years and over | 6 (66.7%) | 4 (57.1%) |
| Total | 55 (66.3%) | 139 (73.2%) |
Income Below Poverty Among Married-Couple Families in Royal Lakes
The poverty statistics for married-couple families in Royal Lakes show that 42.9% or 12 of the total 28 families live below the poverty line. Families with no children have the highest poverty rate of 42.9%, comprising of 12 families. On the other hand, families with no children have the lowest poverty rate of 42.9%, which includes 12 families.
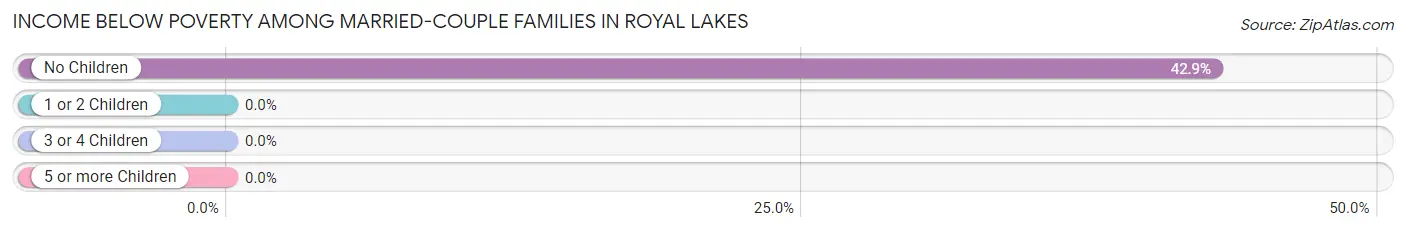
| Children | Above Poverty | Below Poverty |
| No Children | 16 (57.1%) | 12 (42.9%) |
| 1 or 2 Children | 0 (0.0%) | 0 (0.0%) |
| 3 or 4 Children | 0 (0.0%) | 0 (0.0%) |
| 5 or more Children | 0 (0.0%) | 0 (0.0%) |
| Total | 16 (57.1%) | 12 (42.9%) |
Income Below Poverty Among Single-Parent Households in Royal Lakes
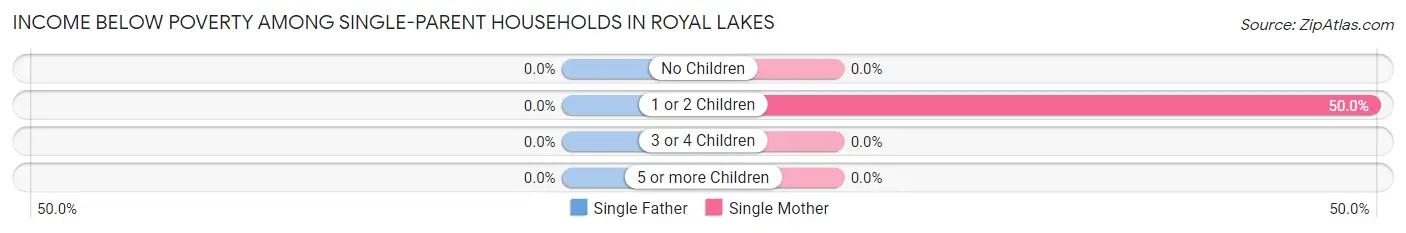
| Children | Single Father | Single Mother |
| No Children | 0 (0.0%) | 0 (0.0%) |
| 1 or 2 Children | 0 (0.0%) | 2 (50.0%) |
| 3 or 4 Children | 0 (0.0%) | 0 (0.0%) |
| 5 or more Children | 0 (0.0%) | 0 (0.0%) |
| Total | 0 (0.0%) | 2 (28.6%) |
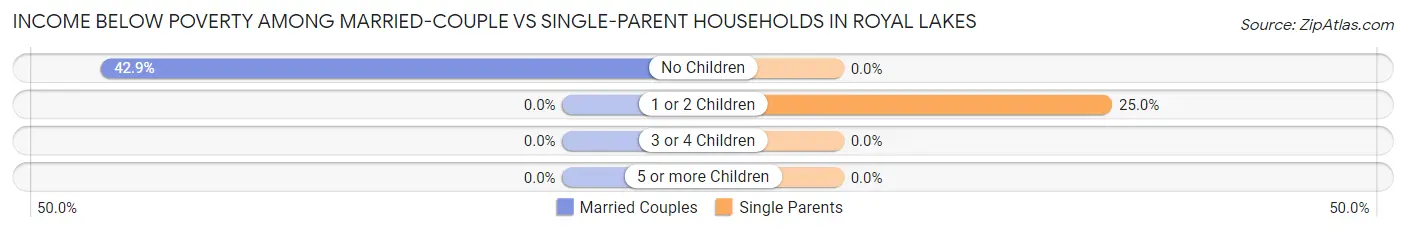
Income Below Poverty Among Married-Couple vs Single-Parent Households in Royal Lakes
The poverty data for Royal Lakes shows that 12 of the married-couple family households (42.9%) and 2 of the single-parent households (13.3%) are living below the poverty level. Within the married-couple family households, those with no children have the highest poverty rate, with 12 households (42.9%) falling below the poverty line. Among the single-parent households, those with 1 or 2 children have the highest poverty rate, with 2 household (25.0%) living below poverty.
| Children | Married-Couple Families | Single-Parent Households |
| No Children | 12 (42.9%) | 0 (0.0%) |
| 1 or 2 Children | 0 (0.0%) | 2 (25.0%) |
| 3 or 4 Children | 0 (0.0%) | 0 (0.0%) |
| 5 or more Children | 0 (0.0%) | 0 (0.0%) |
| Total | 12 (42.9%) | 2 (13.3%) |
Employment Characteristics in Royal Lakes
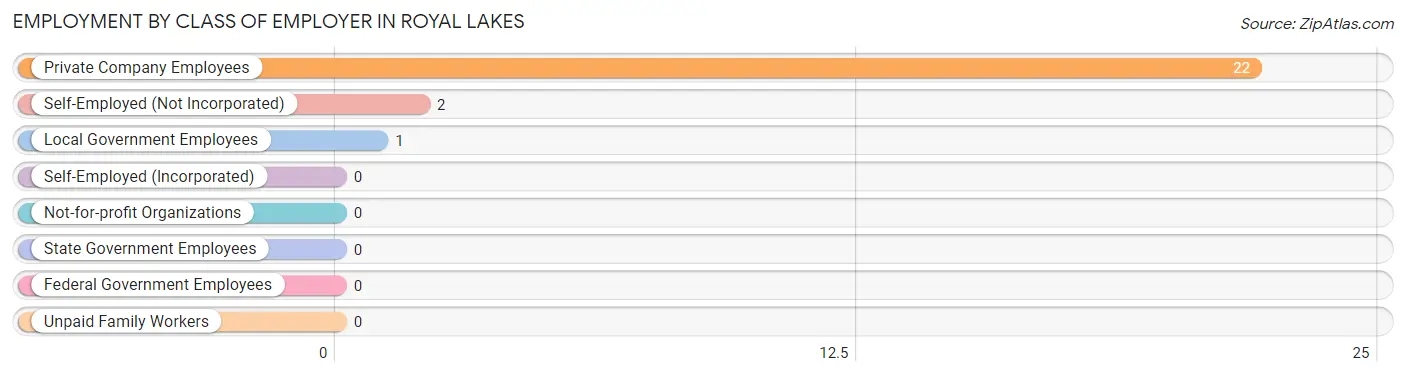
Employment by Class of Employer in Royal Lakes
Among the 25 employed individuals in Royal Lakes, private company employees (22 | 88.0%), self-employed (not incorporated) (2 | 8.0%), and local government employees (1 | 4.0%) make up the most common classes of employment.
| Employer Class | # Employees | % Employees |
| Private Company Employees | 22 | 88.0% |
| Self-Employed (Incorporated) | 0 | 0.0% |
| Self-Employed (Not Incorporated) | 2 | 8.0% |
| Not-for-profit Organizations | 0 | 0.0% |
| Local Government Employees | 1 | 4.0% |
| State Government Employees | 0 | 0.0% |
| Federal Government Employees | 0 | 0.0% |
| Unpaid Family Workers | 0 | 0.0% |
| Total | 25 | 100.0% |
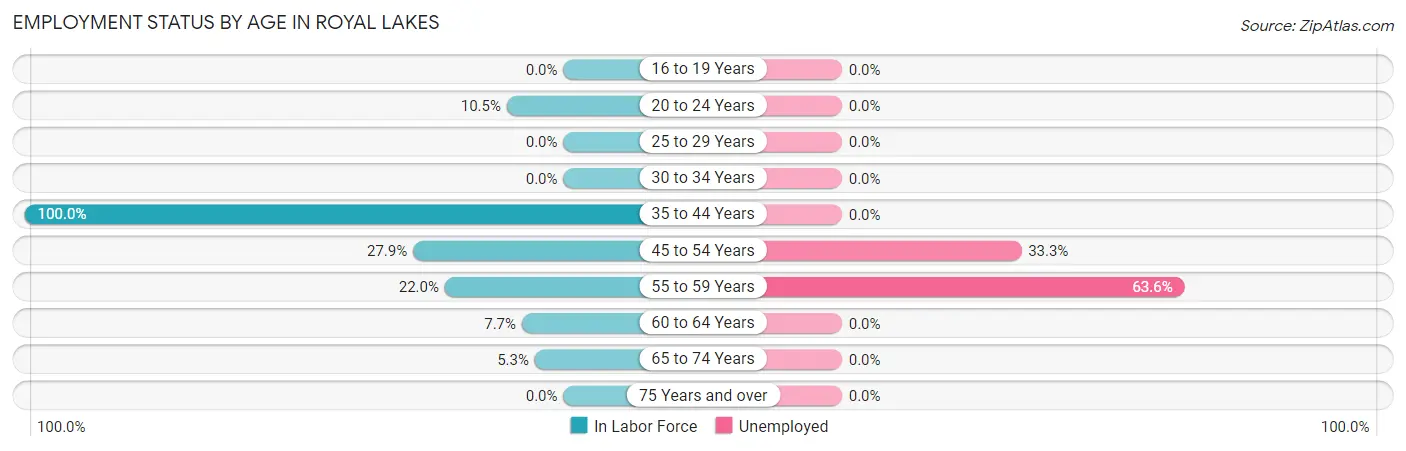
Employment Status by Age in Royal Lakes
According to the labor force statistics for Royal Lakes, out of the total population over 16 years of age (237), 15.2% or 36 individuals are in the labor force, with 30.6% or 11 of them unemployed. The age group with the highest labor force participation rate is 35 to 44 years, with 100.0% or 6 individuals in the labor force. Within the labor force, the 55 to 59 years age range has the highest percentage of unemployed individuals, with 63.6% or 7 of them being unemployed.
| Age Bracket | In Labor Force | Unemployed |
| 16 to 19 Years | 0 (0.0%) | 0 (0.0%) |
| 20 to 24 Years | 4 (10.5%) | 0 (0.0%) |
| 25 to 29 Years | 0 (0.0%) | 0 (0.0%) |
| 30 to 34 Years | 0 (0.0%) | 0 (0.0%) |
| 35 to 44 Years | 6 (100.0%) | 0 (0.0%) |
| 45 to 54 Years | 12 (27.9%) | 4 (33.3%) |
| 55 to 59 Years | 11 (22.0%) | 7 (63.6%) |
| 60 to 64 Years | 1 (7.7%) | 0 (0.0%) |
| 65 to 74 Years | 2 (5.3%) | 0 (0.0%) |
| 75 Years and over | 0 (0.0%) | 0 (0.0%) |
| Total | 36 (15.2%) | 11 (30.6%) |
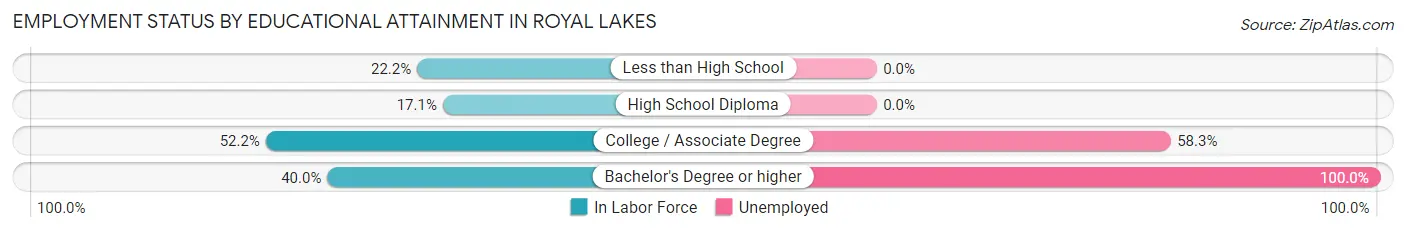
Employment Status by Educational Attainment in Royal Lakes
According to labor force statistics for Royal Lakes, 26.8% of individuals (30) out of the total population between 25 and 64 years of age (112) are in the labor force, with 36.7% or 11 of them being unemployed. The group with the highest labor force participation rate are those with the educational attainment of college / associate degree, with 52.2% or 12 individuals in the labor force. Within the labor force, individuals with bachelor's degree or higher education have the highest percentage of unemployment, with 100.0% or 4 of them being unemployed.
| Educational Attainment | In Labor Force | Unemployed |
| Less than High School | 2 (22.2%) | 0 (0.0%) |
| High School Diploma | 12 (17.1%) | 0 (0.0%) |
| College / Associate Degree | 12 (52.2%) | 13 (58.3%) |
| Bachelor's Degree or higher | 4 (40.0%) | 10 (100.0%) |
| Total | 30 (26.8%) | 41 (36.7%) |
Employment Occupations by Sex in Royal Lakes
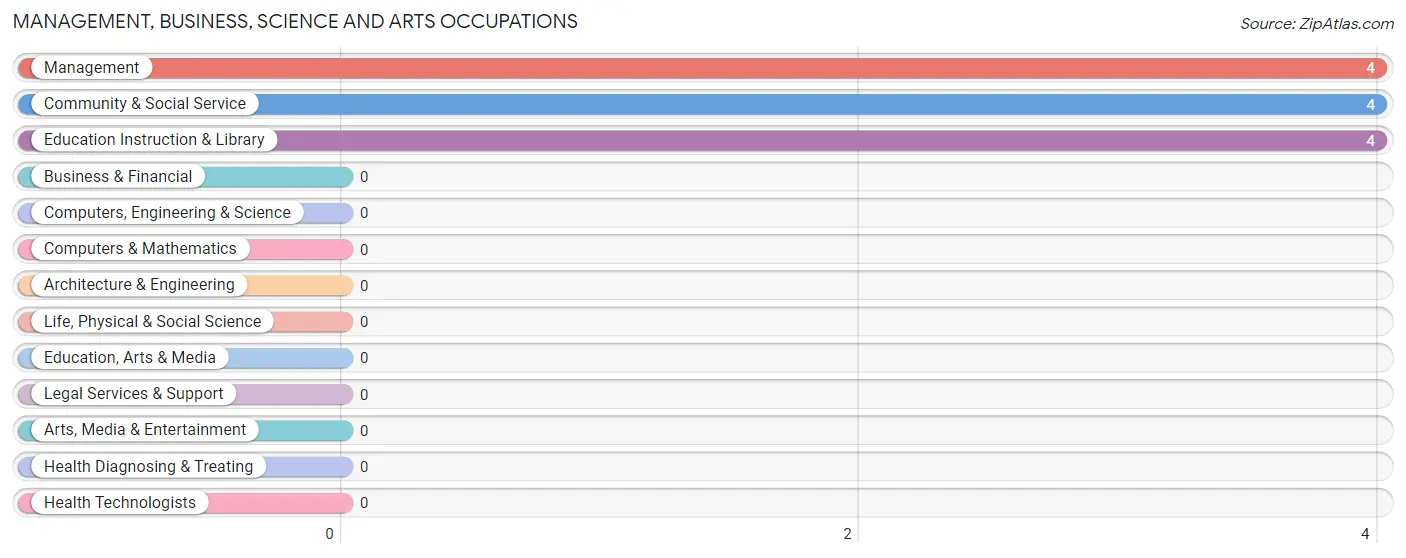
Management, Business, Science and Arts Occupations
The most common Management, Business, Science and Arts occupations in Royal Lakes are Management (4 | 16.0%), Community & Social Service (4 | 16.0%), and Education Instruction & Library (4 | 16.0%).
Management, Business, Science and Arts Occupations by Sex
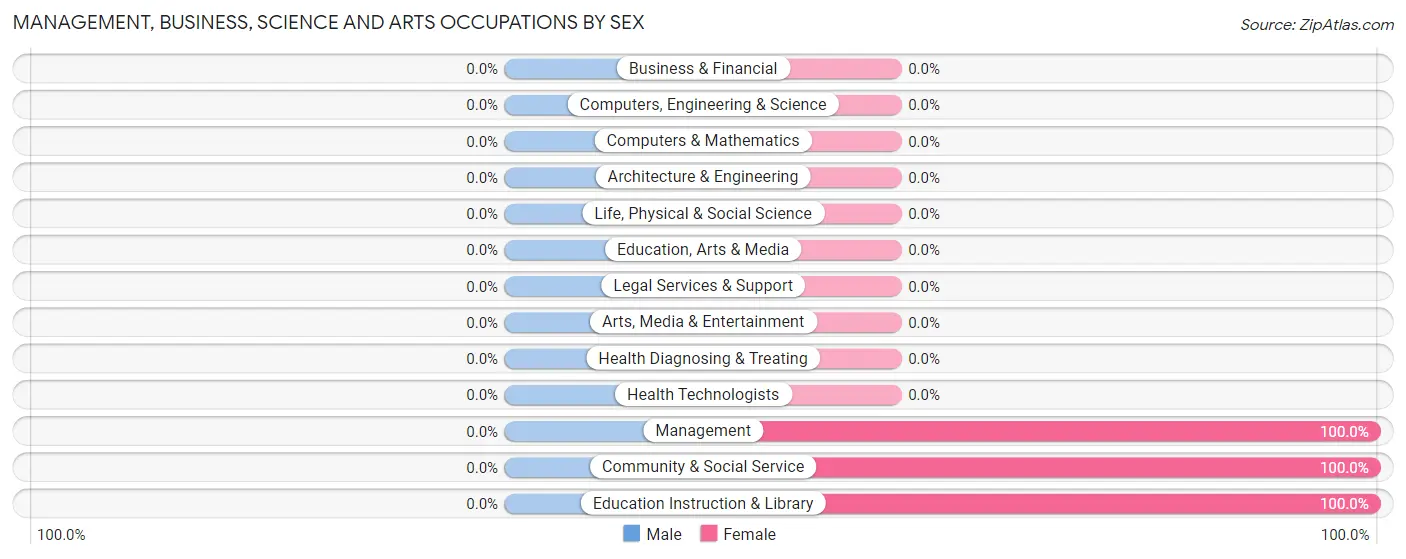
| Occupation | Male | Female |
| Management | 0 (0.0%) | 4 (100.0%) |
| Business & Financial | 0 (0.0%) | 0 (0.0%) |
| Computers, Engineering & Science | 0 (0.0%) | 0 (0.0%) |
| Computers & Mathematics | 0 (0.0%) | 0 (0.0%) |
| Architecture & Engineering | 0 (0.0%) | 0 (0.0%) |
| Life, Physical & Social Science | 0 (0.0%) | 0 (0.0%) |
| Community & Social Service | 0 (0.0%) | 4 (100.0%) |
| Education, Arts & Media | 0 (0.0%) | 0 (0.0%) |
| Legal Services & Support | 0 (0.0%) | 0 (0.0%) |
| Education Instruction & Library | 0 (0.0%) | 4 (100.0%) |
| Arts, Media & Entertainment | 0 (0.0%) | 0 (0.0%) |
| Health Diagnosing & Treating | 0 (0.0%) | 0 (0.0%) |
| Health Technologists | 0 (0.0%) | 0 (0.0%) |
| Total (Category) | 0 (0.0%) | 8 (100.0%) |
| Total (Overall) | 8 (32.0%) | 17 (68.0%) |
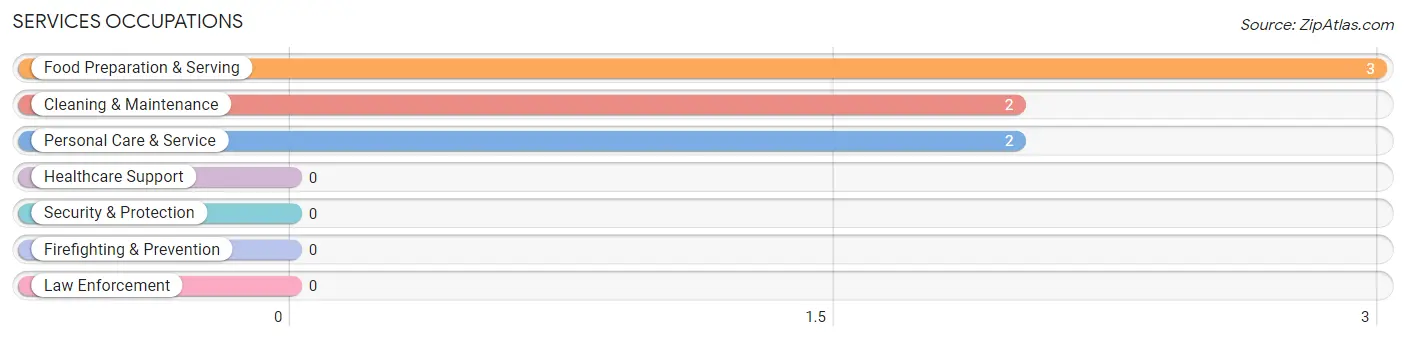
Services Occupations
The most common Services occupations in Royal Lakes are Food Preparation & Serving (3 | 12.0%), Cleaning & Maintenance (2 | 8.0%), and Personal Care & Service (2 | 8.0%).
Services Occupations by Sex
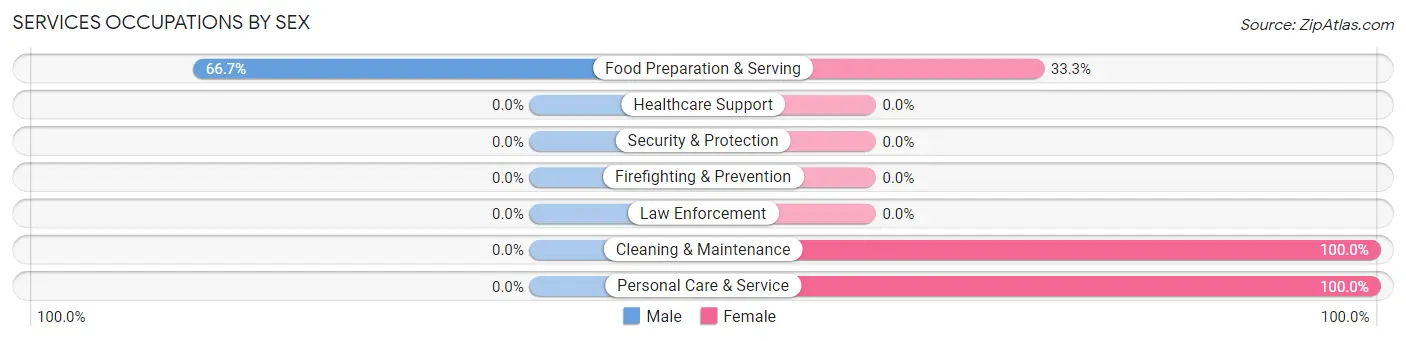
| Occupation | Male | Female |
| Healthcare Support | 0 (0.0%) | 0 (0.0%) |
| Security & Protection | 0 (0.0%) | 0 (0.0%) |
| Firefighting & Prevention | 0 (0.0%) | 0 (0.0%) |
| Law Enforcement | 0 (0.0%) | 0 (0.0%) |
| Food Preparation & Serving | 2 (66.7%) | 1 (33.3%) |
| Cleaning & Maintenance | 0 (0.0%) | 2 (100.0%) |
| Personal Care & Service | 0 (0.0%) | 2 (100.0%) |
| Total (Category) | 2 (28.6%) | 5 (71.4%) |
| Total (Overall) | 8 (32.0%) | 17 (68.0%) |
Sales and Office Occupations
Sales and Office Occupations by Sex
| Occupation | Male | Female |
| Sales & Related | 0 (0.0%) | 0 (0.0%) |
| Office & Administration | 0 (0.0%) | 0 (0.0%) |
| Total (Category) | 0 (0.0%) | 0 (0.0%) |
| Total (Overall) | 8 (32.0%) | 17 (68.0%) |
Natural Resources, Construction and Maintenance Occupations
Natural Resources, Construction and Maintenance Occupations by Sex
| Occupation | Male | Female |
| Farming, Fishing & Forestry | 0 (0.0%) | 0 (0.0%) |
| Construction & Extraction | 0 (0.0%) | 0 (0.0%) |
| Installation, Maintenance & Repair | 0 (0.0%) | 0 (0.0%) |
| Total (Category) | 0 (0.0%) | 0 (0.0%) |
| Total (Overall) | 8 (32.0%) | 17 (68.0%) |
Production, Transportation and Moving Occupations
The most common Production, Transportation and Moving occupations in Royal Lakes are , and Material Moving (10 | 40.0%).
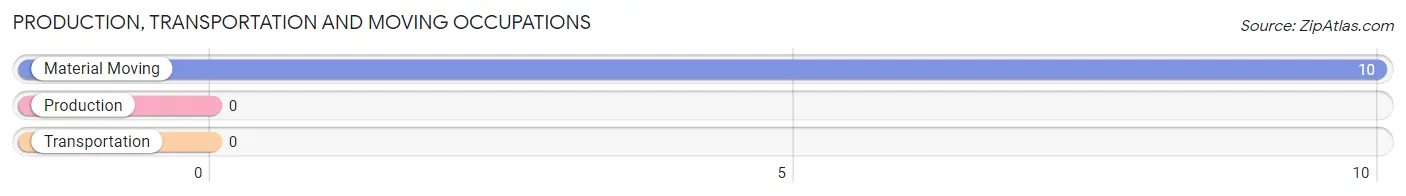
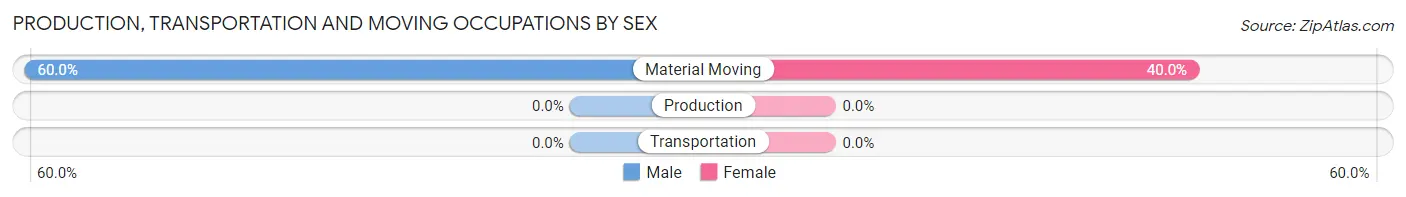
Production, Transportation and Moving Occupations by Sex
| Occupation | Male | Female |
| Production | 0 (0.0%) | 0 (0.0%) |
| Transportation | 0 (0.0%) | 0 (0.0%) |
| Material Moving | 6 (60.0%) | 4 (40.0%) |
| Total (Category) | 6 (60.0%) | 4 (40.0%) |
| Total (Overall) | 8 (32.0%) | 17 (68.0%) |
Employment Industries by Sex in Royal Lakes
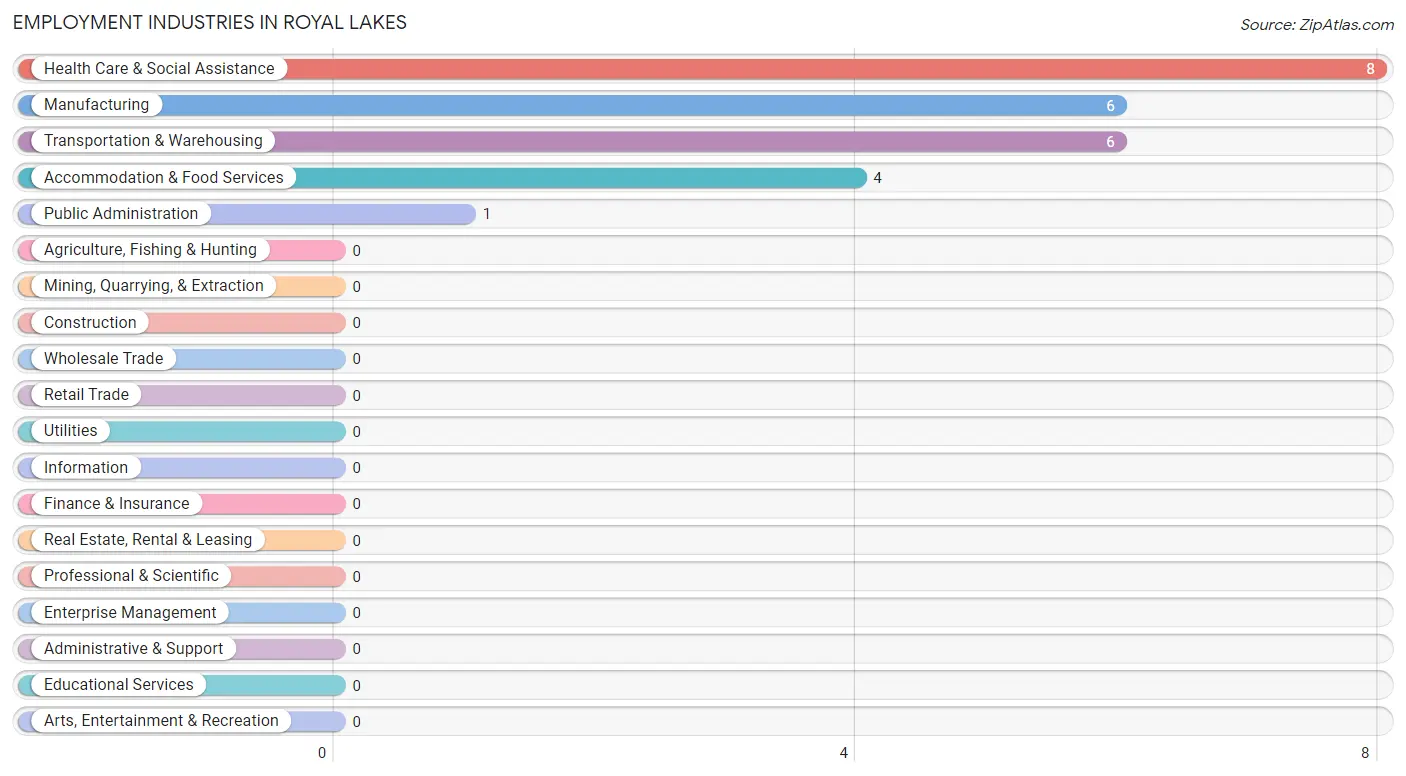
Employment Industries in Royal Lakes
The major employment industries in Royal Lakes include Health Care & Social Assistance (8 | 32.0%), Manufacturing (6 | 24.0%), Transportation & Warehousing (6 | 24.0%), Accommodation & Food Services (4 | 16.0%), and Public Administration (1 | 4.0%).
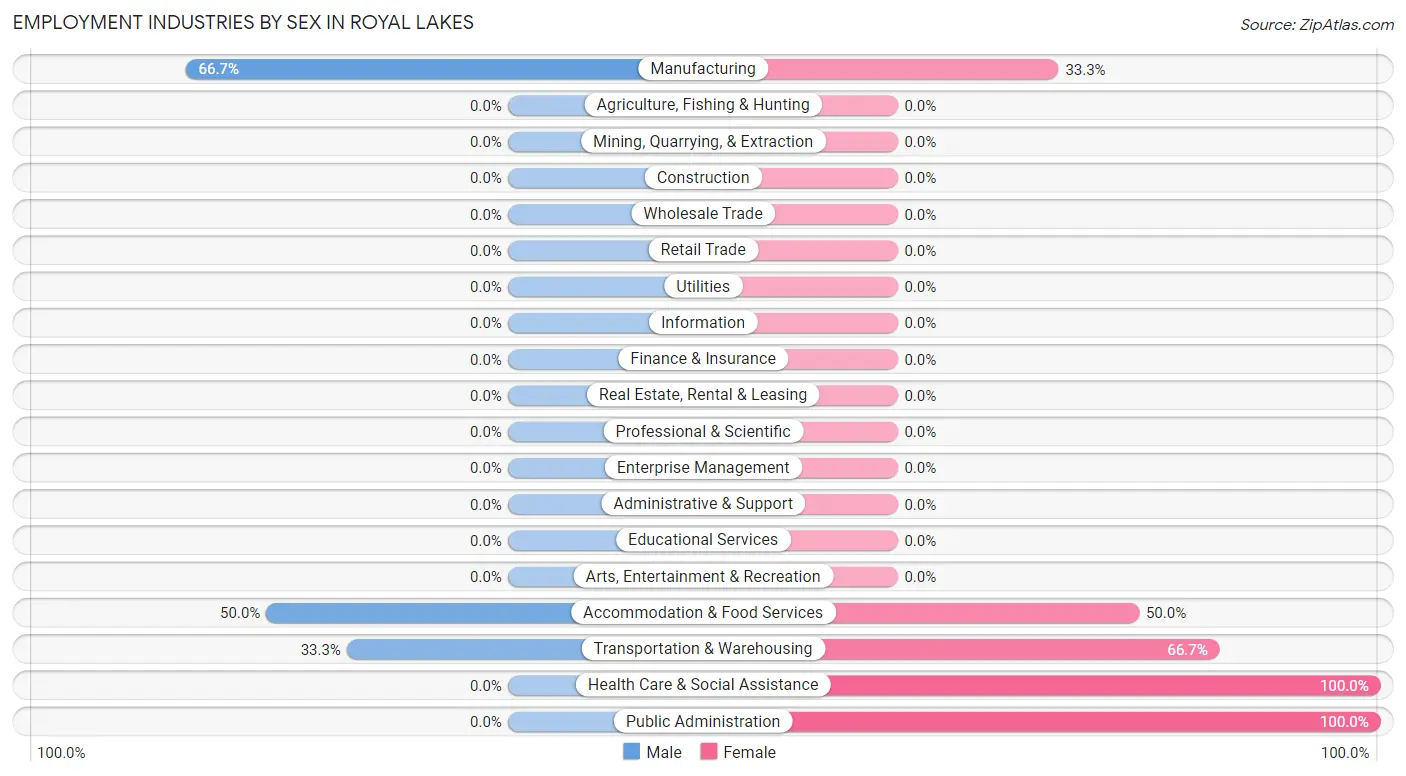
Employment Industries by Sex in Royal Lakes
The Royal Lakes industries that see more men than women are Manufacturing (66.7%), Accommodation & Food Services (50.0%), and Transportation & Warehousing (33.3%), whereas the industries that tend to have a higher number of women are Health Care & Social Assistance (100.0%), Public Administration (100.0%), and Transportation & Warehousing (66.7%).
| Industry | Male | Female |
| Agriculture, Fishing & Hunting | 0 (0.0%) | 0 (0.0%) |
| Mining, Quarrying, & Extraction | 0 (0.0%) | 0 (0.0%) |
| Construction | 0 (0.0%) | 0 (0.0%) |
| Manufacturing | 4 (66.7%) | 2 (33.3%) |
| Wholesale Trade | 0 (0.0%) | 0 (0.0%) |
| Retail Trade | 0 (0.0%) | 0 (0.0%) |
| Transportation & Warehousing | 2 (33.3%) | 4 (66.7%) |
| Utilities | 0 (0.0%) | 0 (0.0%) |
| Information | 0 (0.0%) | 0 (0.0%) |
| Finance & Insurance | 0 (0.0%) | 0 (0.0%) |
| Real Estate, Rental & Leasing | 0 (0.0%) | 0 (0.0%) |
| Professional & Scientific | 0 (0.0%) | 0 (0.0%) |
| Enterprise Management | 0 (0.0%) | 0 (0.0%) |
| Administrative & Support | 0 (0.0%) | 0 (0.0%) |
| Educational Services | 0 (0.0%) | 0 (0.0%) |
| Health Care & Social Assistance | 0 (0.0%) | 8 (100.0%) |
| Arts, Entertainment & Recreation | 0 (0.0%) | 0 (0.0%) |
| Accommodation & Food Services | 2 (50.0%) | 2 (50.0%) |
| Public Administration | 0 (0.0%) | 1 (100.0%) |
| Total | 8 (32.0%) | 17 (68.0%) |
Education in Royal Lakes
School Enrollment in Royal Lakes
The most common levels of schooling among the 34 students in Royal Lakes are high school (13 | 38.2%), middle school (9 | 26.5%), and elementary school (8 | 23.5%).
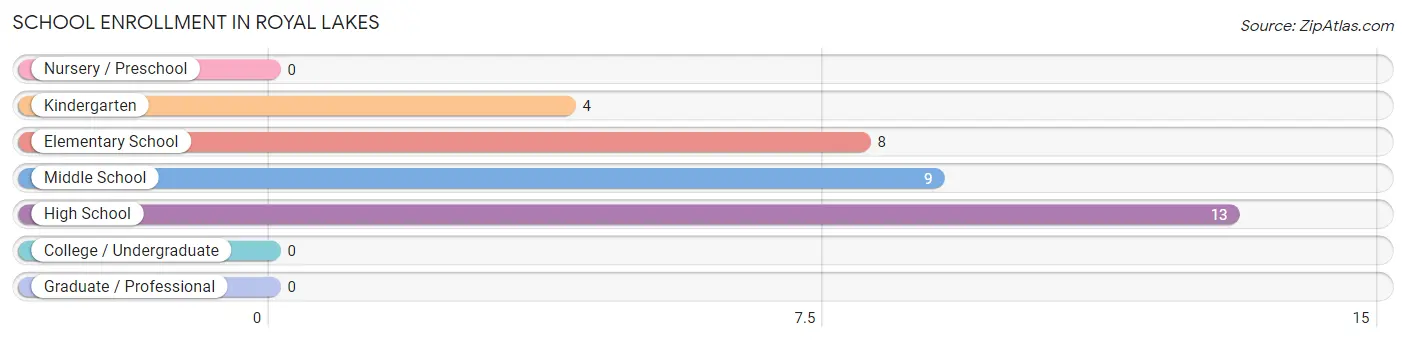
| School Level | # Students | % Students |
| Nursery / Preschool | 0 | 0.0% |
| Kindergarten | 4 | 11.8% |
| Elementary School | 8 | 23.5% |
| Middle School | 9 | 26.5% |
| High School | 13 | 38.2% |
| College / Undergraduate | 0 | 0.0% |
| Graduate / Professional | 0 | 0.0% |
| Total | 34 | 100.0% |
School Enrollment by Age by Funding Source in Royal Lakes
Out of a total of 34 students who are enrolled in schools in Royal Lakes, 8 (23.5%) attend a private institution, while the remaining 26 (76.5%) are enrolled in public schools. The age group of 5 to 9 year old has the highest likelihood of being enrolled in private schools, with 8 (66.7% in the age bracket) enrolled. Conversely, the age group of 10 to 14 year olds has the lowest likelihood of being enrolled in a private school, with 9 (100.0% in the age bracket) attending a public institution.
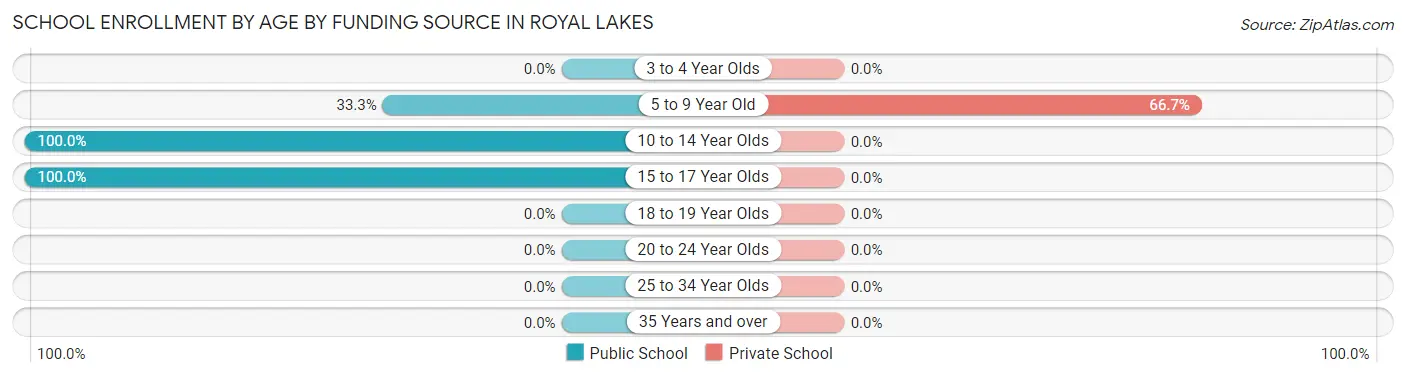
| Age Bracket | Public School | Private School |
| 3 to 4 Year Olds | 0 (0.0%) | 0 (0.0%) |
| 5 to 9 Year Old | 4 (33.3%) | 8 (66.7%) |
| 10 to 14 Year Olds | 9 (100.0%) | 0 (0.0%) |
| 15 to 17 Year Olds | 13 (100.0%) | 0 (0.0%) |
| 18 to 19 Year Olds | 0 (0.0%) | 0 (0.0%) |
| 20 to 24 Year Olds | 0 (0.0%) | 0 (0.0%) |
| 25 to 34 Year Olds | 0 (0.0%) | 0 (0.0%) |
| 35 Years and over | 0 (0.0%) | 0 (0.0%) |
| Total | 26 (76.5%) | 8 (23.5%) |
Educational Attainment by Field of Study in Royal Lakes
, and science & technology (10 | 100.0%) are the most common fields of study among 10 individuals in Royal Lakes who have obtained a bachelor's degree or higher.
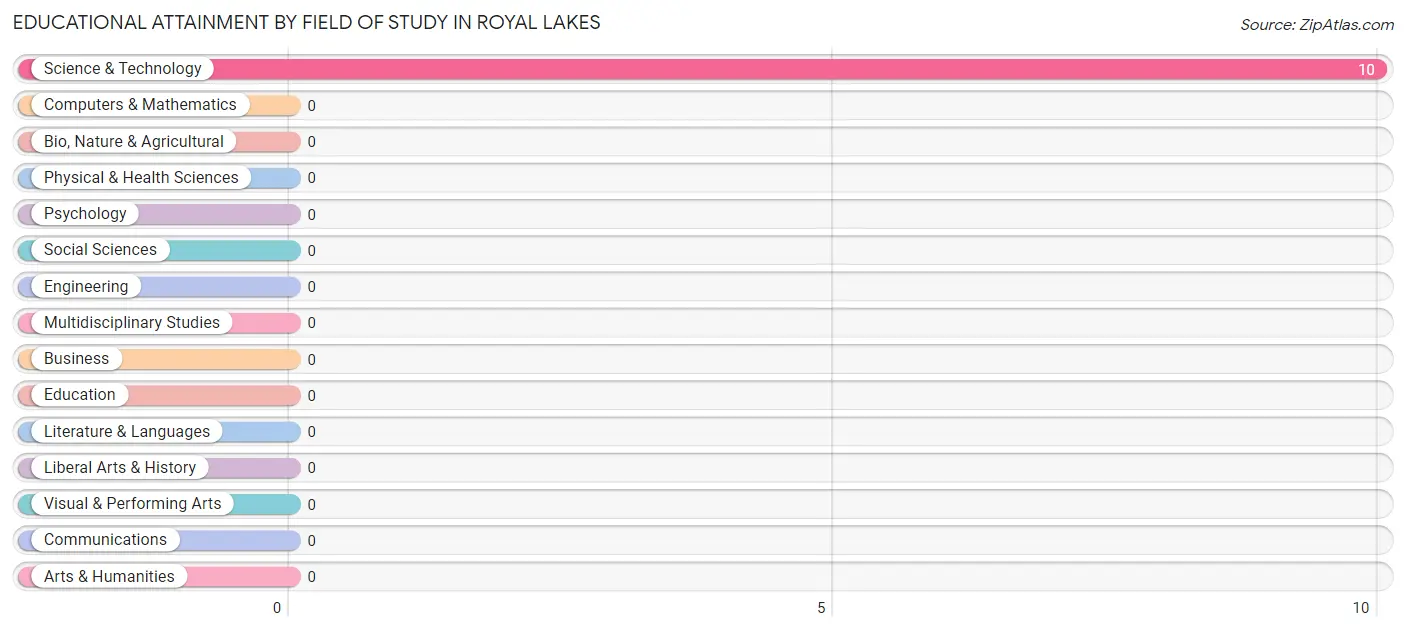
| Field of Study | # Graduates | % Graduates |
| Computers & Mathematics | 0 | 0.0% |
| Bio, Nature & Agricultural | 0 | 0.0% |
| Physical & Health Sciences | 0 | 0.0% |
| Psychology | 0 | 0.0% |
| Social Sciences | 0 | 0.0% |
| Engineering | 0 | 0.0% |
| Multidisciplinary Studies | 0 | 0.0% |
| Science & Technology | 10 | 100.0% |
| Business | 0 | 0.0% |
| Education | 0 | 0.0% |
| Literature & Languages | 0 | 0.0% |
| Liberal Arts & History | 0 | 0.0% |
| Visual & Performing Arts | 0 | 0.0% |
| Communications | 0 | 0.0% |
| Arts & Humanities | 0 | 0.0% |
| Total | 10 | 100.0% |
Transportation & Commute in Royal Lakes
Vehicle Availability by Sex in Royal Lakes
The most prevalent vehicle ownership categories in Royal Lakes are males with 2 vehicles (6, accounting for 75.0%) and females with 2 vehicles (14, making up 35.3%).
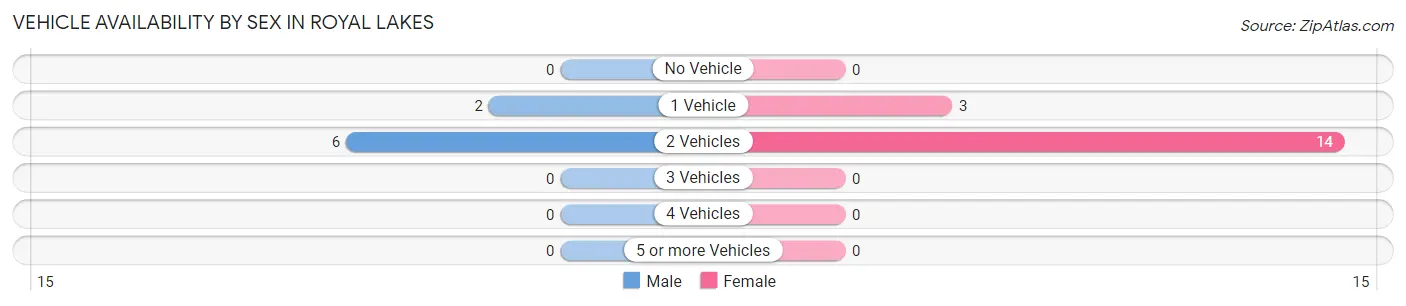
| Vehicles Available | Male | Female |
| No Vehicle | 0 (0.0%) | 0 (0.0%) |
| 1 Vehicle | 2 (25.0%) | 3 (17.6%) |
| 2 Vehicles | 6 (75.0%) | 14 (82.4%) |
| 3 Vehicles | 0 (0.0%) | 0 (0.0%) |
| 4 Vehicles | 0 (0.0%) | 0 (0.0%) |
| 5 or more Vehicles | 0 (0.0%) | 0 (0.0%) |
| Total | 8 (100.0%) | 17 (100.0%) |
Commute Time in Royal Lakes
The most frequently occuring commute durations in Royal Lakes are 5 to 9 minutes (5 commuters, 23.8%), 30 to 34 minutes (5 commuters, 23.8%), and 40 to 44 minutes (4 commuters, 19.1%).
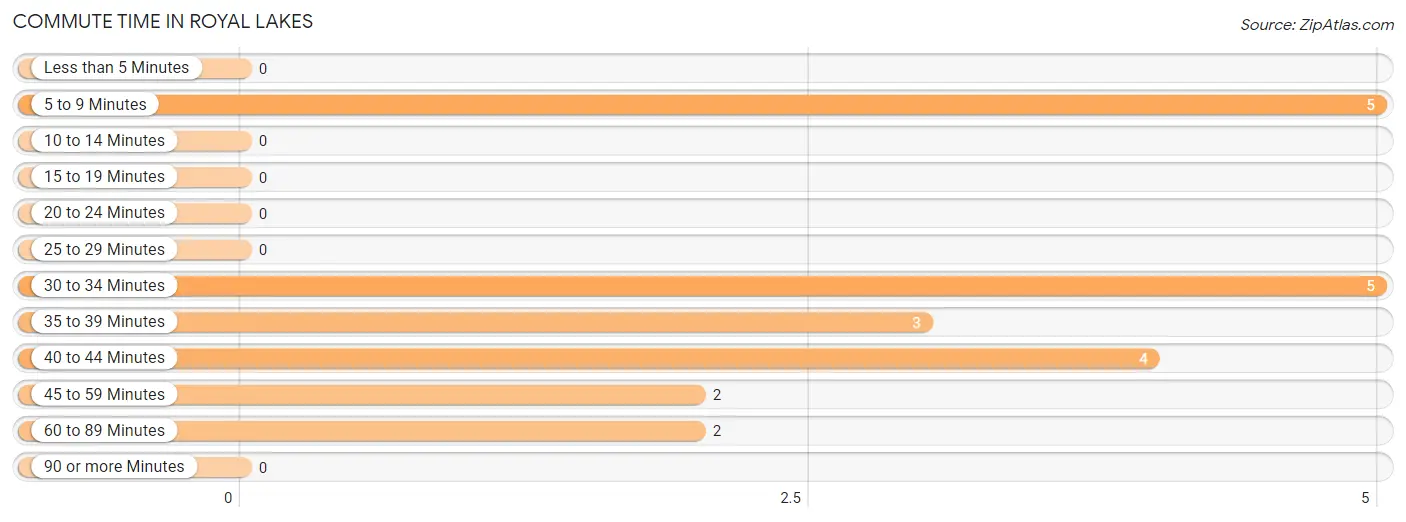
| Commute Time | # Commuters | % Commuters |
| Less than 5 Minutes | 0 | 0.0% |
| 5 to 9 Minutes | 5 | 23.8% |
| 10 to 14 Minutes | 0 | 0.0% |
| 15 to 19 Minutes | 0 | 0.0% |
| 20 to 24 Minutes | 0 | 0.0% |
| 25 to 29 Minutes | 0 | 0.0% |
| 30 to 34 Minutes | 5 | 23.8% |
| 35 to 39 Minutes | 3 | 14.3% |
| 40 to 44 Minutes | 4 | 19.1% |
| 45 to 59 Minutes | 2 | 9.5% |
| 60 to 89 Minutes | 2 | 9.5% |
| 90 or more Minutes | 0 | 0.0% |
Commute Time by Sex in Royal Lakes
The most common commute times in Royal Lakes are 5 to 9 minutes (4 commuters, 50.0%) for males and 30 to 34 minutes (5 commuters, 38.5%) for females.
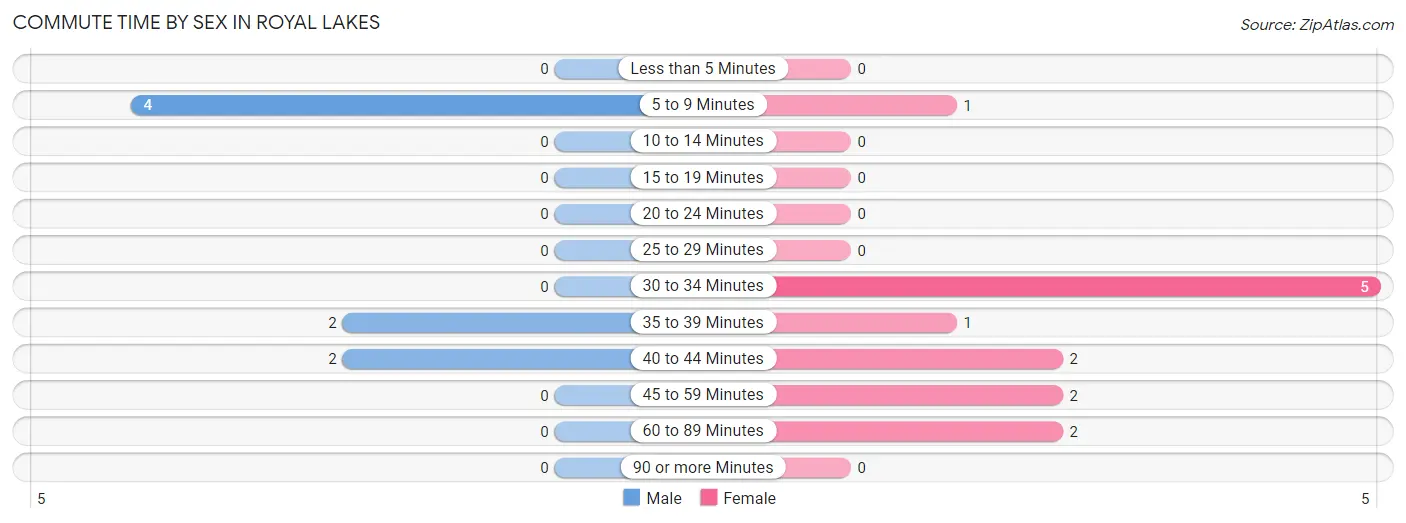
| Commute Time | Male | Female |
| Less than 5 Minutes | 0 (0.0%) | 0 (0.0%) |
| 5 to 9 Minutes | 4 (50.0%) | 1 (7.7%) |
| 10 to 14 Minutes | 0 (0.0%) | 0 (0.0%) |
| 15 to 19 Minutes | 0 (0.0%) | 0 (0.0%) |
| 20 to 24 Minutes | 0 (0.0%) | 0 (0.0%) |
| 25 to 29 Minutes | 0 (0.0%) | 0 (0.0%) |
| 30 to 34 Minutes | 0 (0.0%) | 5 (38.5%) |
| 35 to 39 Minutes | 2 (25.0%) | 1 (7.7%) |
| 40 to 44 Minutes | 2 (25.0%) | 2 (15.4%) |
| 45 to 59 Minutes | 0 (0.0%) | 2 (15.4%) |
| 60 to 89 Minutes | 0 (0.0%) | 2 (15.4%) |
| 90 or more Minutes | 0 (0.0%) | 0 (0.0%) |
Time of Departure to Work by Sex in Royal Lakes
The most frequent times of departure to work in Royal Lakes are 5:00 AM to 5:29 AM (4, 50.0%) for males and 6:00 AM to 6:29 AM (8, 61.5%) for females.
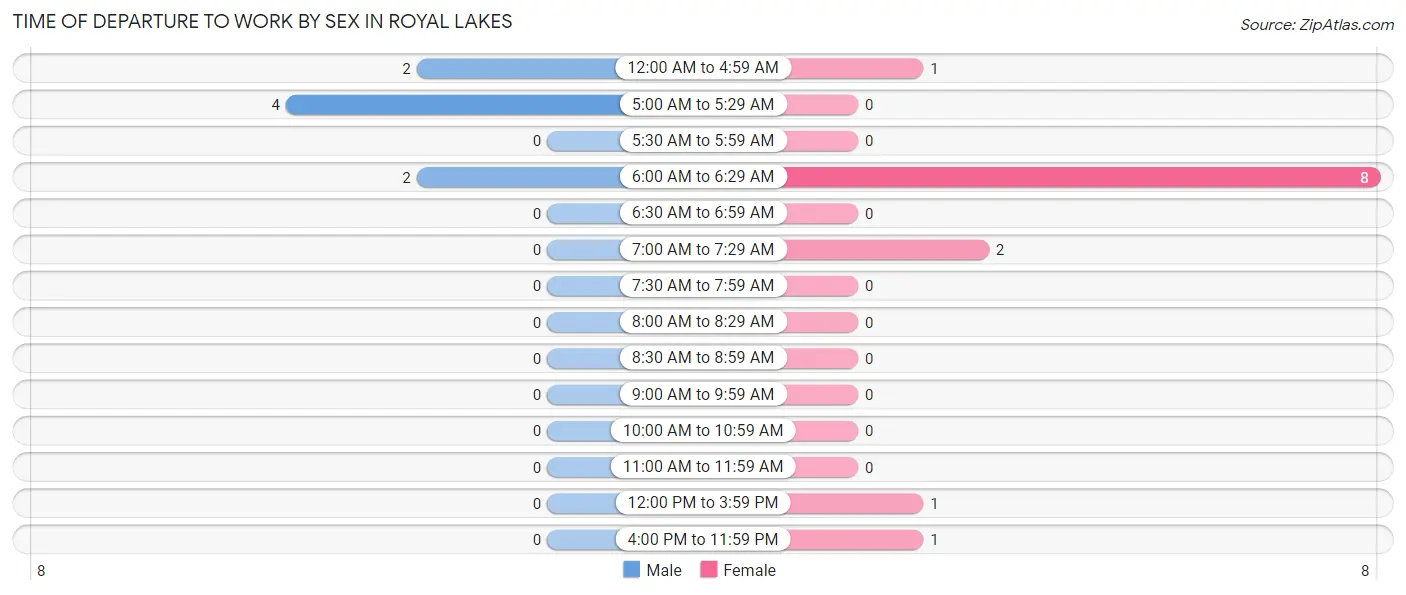
| Time of Departure | Male | Female |
| 12:00 AM to 4:59 AM | 2 (25.0%) | 1 (7.7%) |
| 5:00 AM to 5:29 AM | 4 (50.0%) | 0 (0.0%) |
| 5:30 AM to 5:59 AM | 0 (0.0%) | 0 (0.0%) |
| 6:00 AM to 6:29 AM | 2 (25.0%) | 8 (61.5%) |
| 6:30 AM to 6:59 AM | 0 (0.0%) | 0 (0.0%) |
| 7:00 AM to 7:29 AM | 0 (0.0%) | 2 (15.4%) |
| 7:30 AM to 7:59 AM | 0 (0.0%) | 0 (0.0%) |
| 8:00 AM to 8:29 AM | 0 (0.0%) | 0 (0.0%) |
| 8:30 AM to 8:59 AM | 0 (0.0%) | 0 (0.0%) |
| 9:00 AM to 9:59 AM | 0 (0.0%) | 0 (0.0%) |
| 10:00 AM to 10:59 AM | 0 (0.0%) | 0 (0.0%) |
| 11:00 AM to 11:59 AM | 0 (0.0%) | 0 (0.0%) |
| 12:00 PM to 3:59 PM | 0 (0.0%) | 1 (7.7%) |
| 4:00 PM to 11:59 PM | 0 (0.0%) | 1 (7.7%) |
| Total | 8 (100.0%) | 13 (100.0%) |
Housing Occupancy in Royal Lakes
Occupancy by Ownership in Royal Lakes
Of the total 101 dwellings in Royal Lakes, owner-occupied units account for 56 (55.4%), while renter-occupied units make up 45 (44.6%).
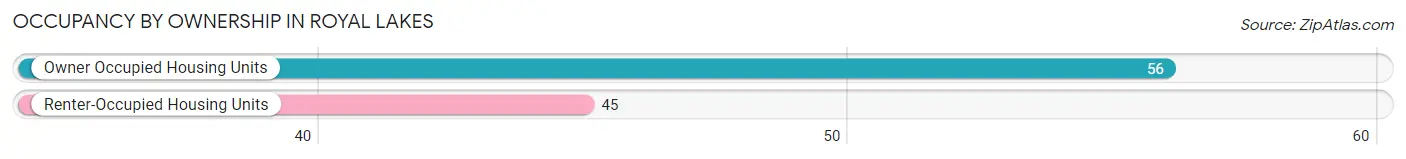
| Occupancy | # Housing Units | % Housing Units |
| Owner Occupied Housing Units | 56 | 55.4% |
| Renter-Occupied Housing Units | 45 | 44.6% |
| Total Occupied Housing Units | 101 | 100.0% |
Occupancy by Household Size in Royal Lakes
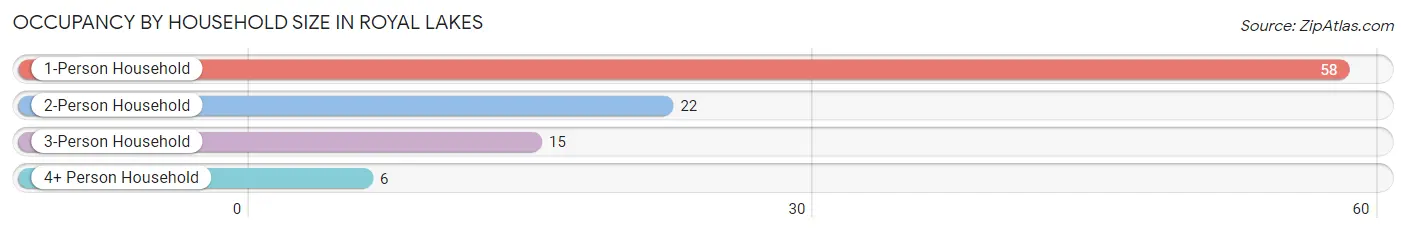
| Household Size | # Housing Units | % Housing Units |
| 1-Person Household | 58 | 57.4% |
| 2-Person Household | 22 | 21.8% |
| 3-Person Household | 15 | 14.8% |
| 4+ Person Household | 6 | 5.9% |
| Total Housing Units | 101 | 100.0% |
Occupancy by Ownership by Household Size in Royal Lakes
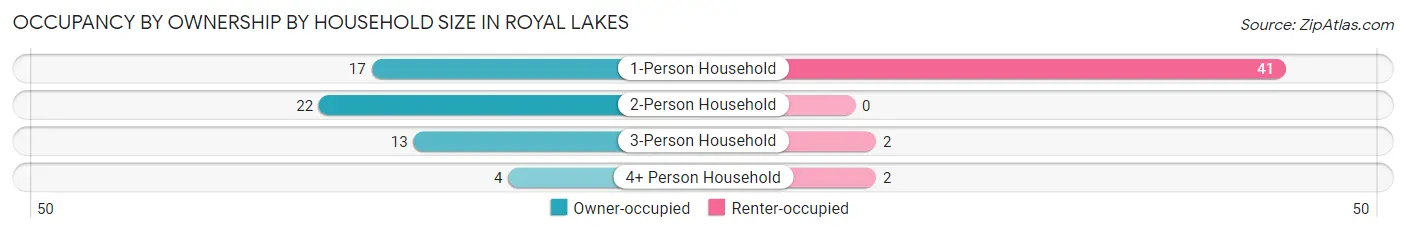
| Household Size | Owner-occupied | Renter-occupied |
| 1-Person Household | 17 (29.3%) | 41 (70.7%) |
| 2-Person Household | 22 (100.0%) | 0 (0.0%) |
| 3-Person Household | 13 (86.7%) | 2 (13.3%) |
| 4+ Person Household | 4 (66.7%) | 2 (33.3%) |
| Total Housing Units | 56 (55.4%) | 45 (44.6%) |
Occupancy by Educational Attainment in Royal Lakes
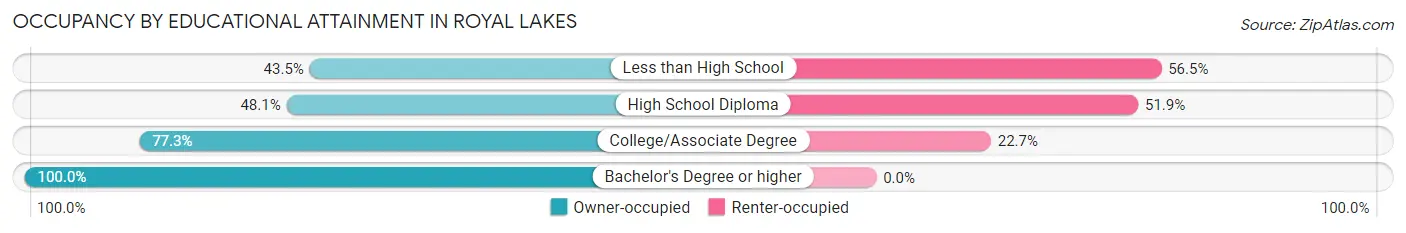
| Household Size | Owner-occupied | Renter-occupied |
| Less than High School | 10 (43.5%) | 13 (56.5%) |
| High School Diploma | 25 (48.1%) | 27 (51.9%) |
| College/Associate Degree | 17 (77.3%) | 5 (22.7%) |
| Bachelor's Degree or higher | 4 (100.0%) | 0 (0.0%) |
Occupancy by Age of Householder in Royal Lakes
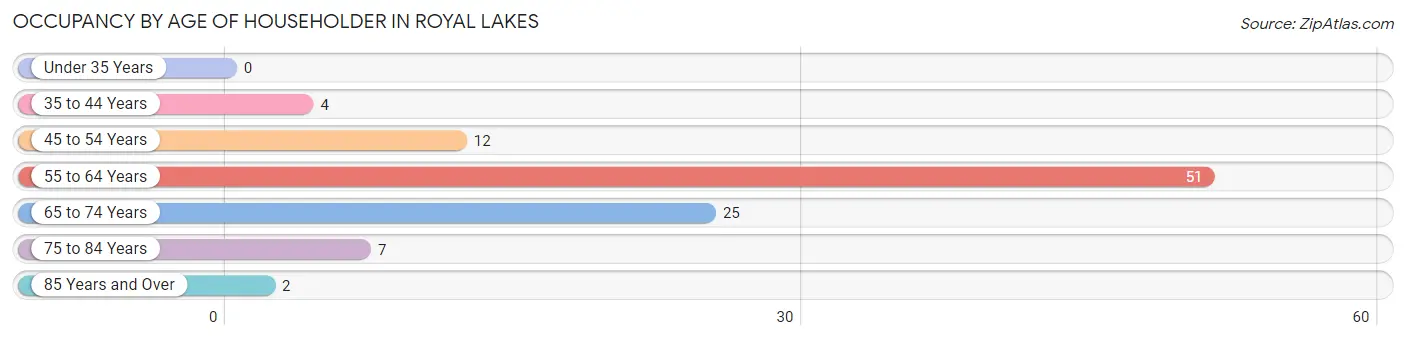
| Age Bracket | # Households | % Households |
| Under 35 Years | 0 | 0.0% |
| 35 to 44 Years | 4 | 4.0% |
| 45 to 54 Years | 12 | 11.9% |
| 55 to 64 Years | 51 | 50.5% |
| 65 to 74 Years | 25 | 24.7% |
| 75 to 84 Years | 7 | 6.9% |
| 85 Years and Over | 2 | 2.0% |
| Total | 101 | 100.0% |
Housing Finances in Royal Lakes
Median Income by Occupancy in Royal Lakes
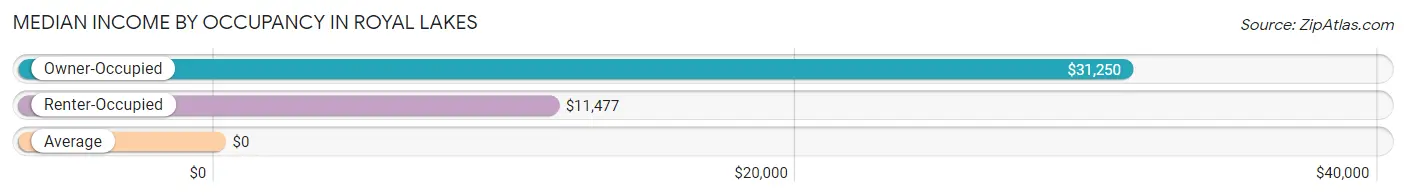
| Occupancy Type | # Households | Median Income |
| Owner-Occupied | 56 (55.4%) | $31,250 |
| Renter-Occupied | 45 (44.6%) | $11,477 |
| Average | 101 (100.0%) | $0 |
Occupancy by Householder Income Bracket in Royal Lakes
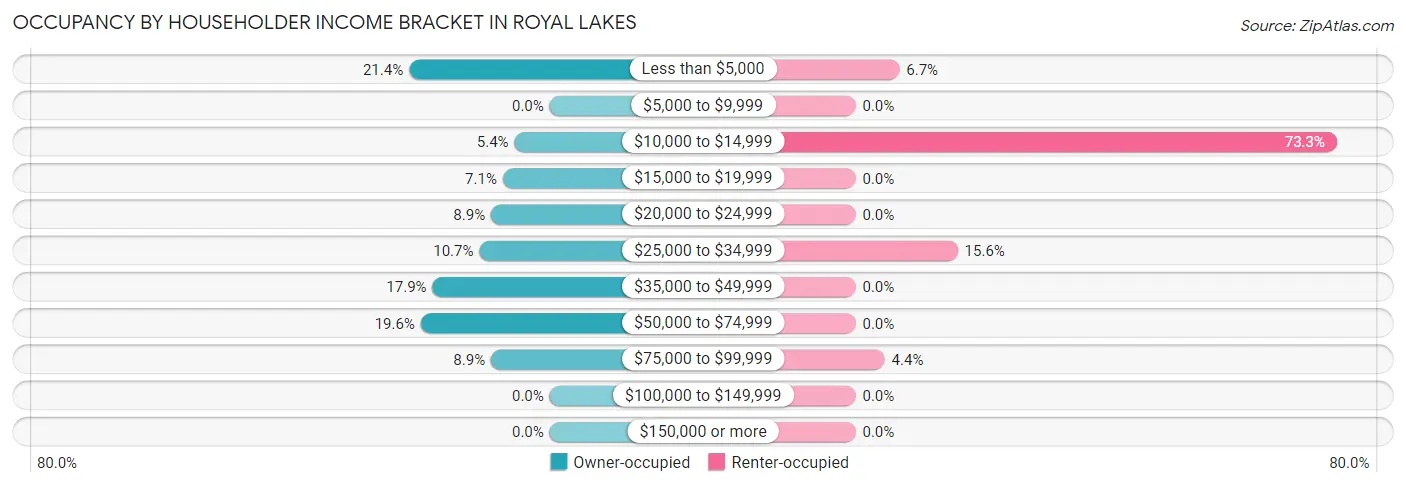
| Income Bracket | Owner-occupied | Renter-occupied |
| Less than $5,000 | 12 (21.4%) | 3 (6.7%) |
| $5,000 to $9,999 | 0 (0.0%) | 0 (0.0%) |
| $10,000 to $14,999 | 3 (5.4%) | 33 (73.3%) |
| $15,000 to $19,999 | 4 (7.1%) | 0 (0.0%) |
| $20,000 to $24,999 | 5 (8.9%) | 0 (0.0%) |
| $25,000 to $34,999 | 6 (10.7%) | 7 (15.6%) |
| $35,000 to $49,999 | 10 (17.9%) | 0 (0.0%) |
| $50,000 to $74,999 | 11 (19.6%) | 0 (0.0%) |
| $75,000 to $99,999 | 5 (8.9%) | 2 (4.4%) |
| $100,000 to $149,999 | 0 (0.0%) | 0 (0.0%) |
| $150,000 or more | 0 (0.0%) | 0 (0.0%) |
| Total | 56 (100.0%) | 45 (100.0%) |
Monthly Housing Cost Tiers in Royal Lakes
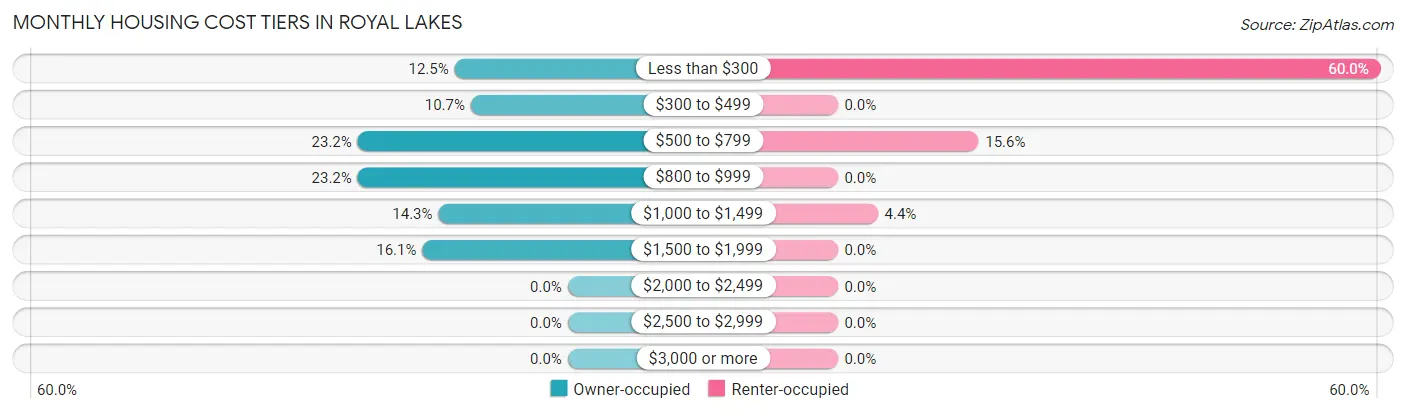
| Monthly Cost | Owner-occupied | Renter-occupied |
| Less than $300 | 7 (12.5%) | 27 (60.0%) |
| $300 to $499 | 6 (10.7%) | 0 (0.0%) |
| $500 to $799 | 13 (23.2%) | 7 (15.6%) |
| $800 to $999 | 13 (23.2%) | 0 (0.0%) |
| $1,000 to $1,499 | 8 (14.3%) | 2 (4.4%) |
| $1,500 to $1,999 | 9 (16.1%) | 0 (0.0%) |
| $2,000 to $2,499 | 0 (0.0%) | 0 (0.0%) |
| $2,500 to $2,999 | 0 (0.0%) | 0 (0.0%) |
| $3,000 or more | 0 (0.0%) | 0 (0.0%) |
| Total | 56 (100.0%) | 45 (100.0%) |
Physical Housing Characteristics in Royal Lakes
Housing Structures in Royal Lakes
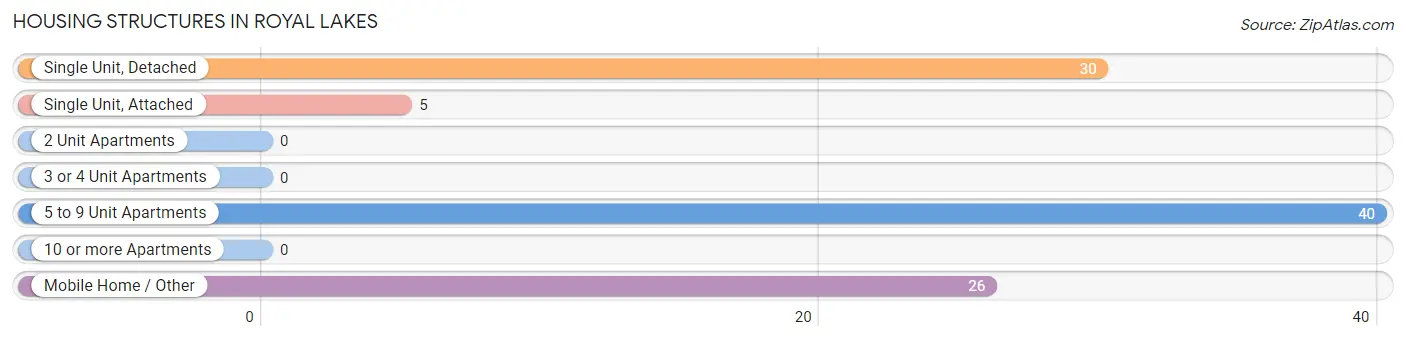
| Structure Type | # Housing Units | % Housing Units |
| Single Unit, Detached | 30 | 29.7% |
| Single Unit, Attached | 5 | 5.0% |
| 2 Unit Apartments | 0 | 0.0% |
| 3 or 4 Unit Apartments | 0 | 0.0% |
| 5 to 9 Unit Apartments | 40 | 39.6% |
| 10 or more Apartments | 0 | 0.0% |
| Mobile Home / Other | 26 | 25.7% |
| Total | 101 | 100.0% |
Housing Structures by Occupancy in Royal Lakes
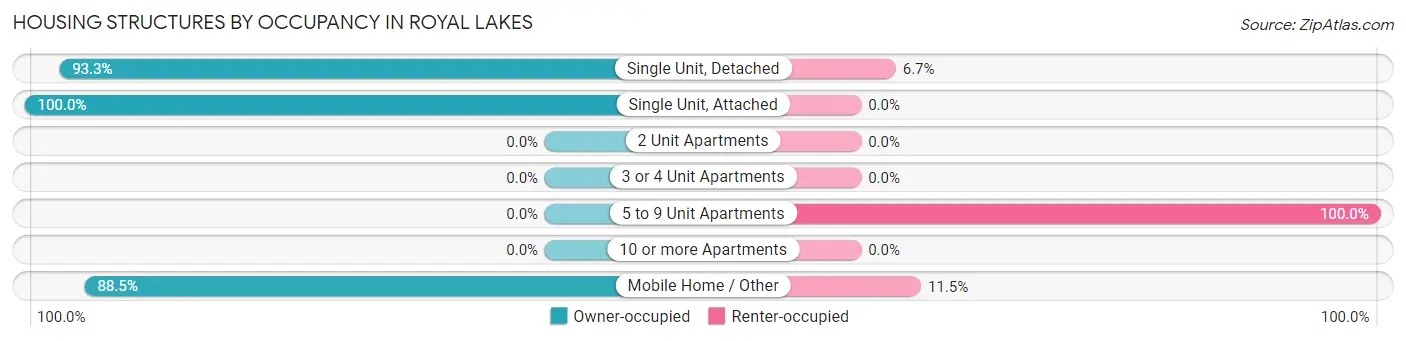
| Structure Type | Owner-occupied | Renter-occupied |
| Single Unit, Detached | 28 (93.3%) | 2 (6.7%) |
| Single Unit, Attached | 5 (100.0%) | 0 (0.0%) |
| 2 Unit Apartments | 0 (0.0%) | 0 (0.0%) |
| 3 or 4 Unit Apartments | 0 (0.0%) | 0 (0.0%) |
| 5 to 9 Unit Apartments | 0 (0.0%) | 40 (100.0%) |
| 10 or more Apartments | 0 (0.0%) | 0 (0.0%) |
| Mobile Home / Other | 23 (88.5%) | 3 (11.5%) |
| Total | 56 (55.4%) | 45 (44.6%) |
Housing Structures by Number of Rooms in Royal Lakes
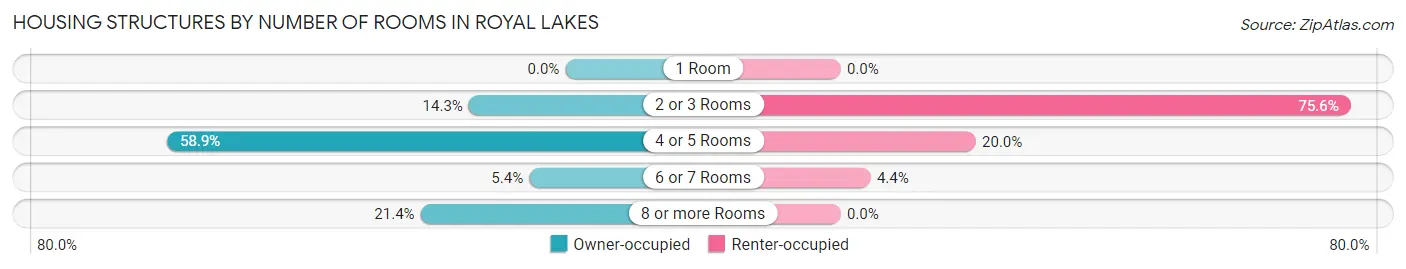
| Number of Rooms | Owner-occupied | Renter-occupied |
| 1 Room | 0 (0.0%) | 0 (0.0%) |
| 2 or 3 Rooms | 8 (14.3%) | 34 (75.6%) |
| 4 or 5 Rooms | 33 (58.9%) | 9 (20.0%) |
| 6 or 7 Rooms | 3 (5.4%) | 2 (4.4%) |
| 8 or more Rooms | 12 (21.4%) | 0 (0.0%) |
| Total | 56 (100.0%) | 45 (100.0%) |
Housing Structure by Heating Type in Royal Lakes
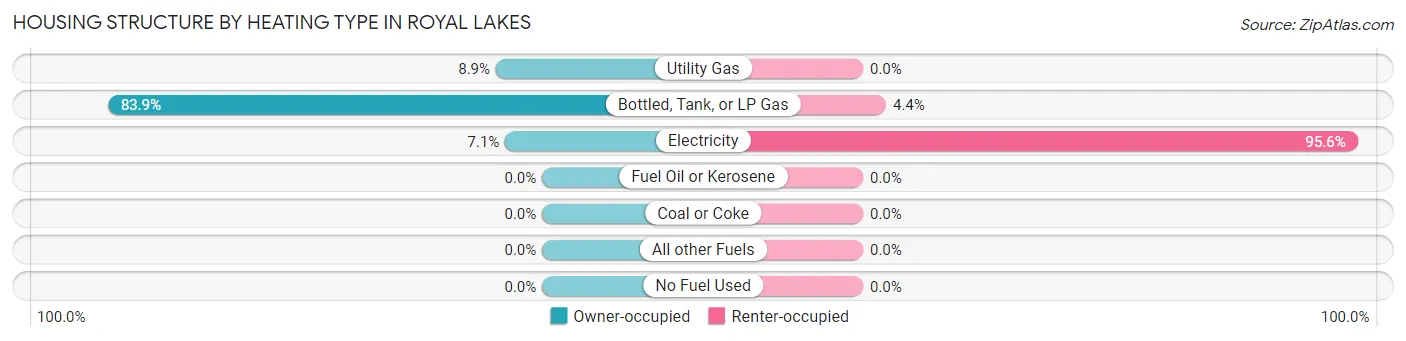
| Heating Type | Owner-occupied | Renter-occupied |
| Utility Gas | 5 (8.9%) | 0 (0.0%) |
| Bottled, Tank, or LP Gas | 47 (83.9%) | 2 (4.4%) |
| Electricity | 4 (7.1%) | 43 (95.6%) |
| Fuel Oil or Kerosene | 0 (0.0%) | 0 (0.0%) |
| Coal or Coke | 0 (0.0%) | 0 (0.0%) |
| All other Fuels | 0 (0.0%) | 0 (0.0%) |
| No Fuel Used | 0 (0.0%) | 0 (0.0%) |
| Total | 56 (100.0%) | 45 (100.0%) |
Household Vehicle Usage in Royal Lakes
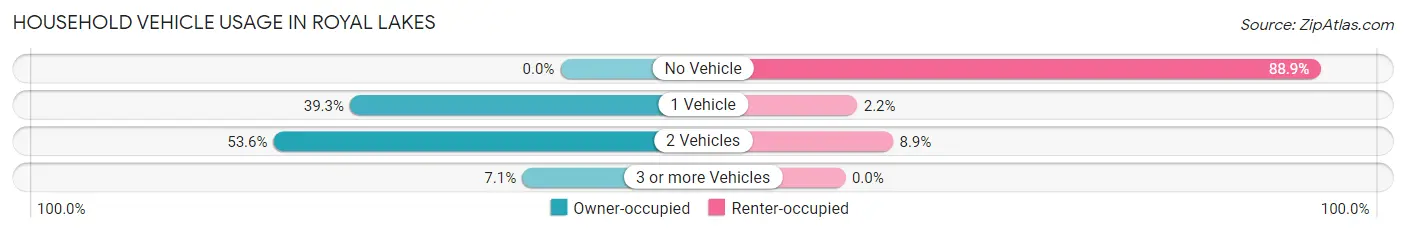
| Vehicles per Household | Owner-occupied | Renter-occupied |
| No Vehicle | 0 (0.0%) | 40 (88.9%) |
| 1 Vehicle | 22 (39.3%) | 1 (2.2%) |
| 2 Vehicles | 30 (53.6%) | 4 (8.9%) |
| 3 or more Vehicles | 4 (7.1%) | 0 (0.0%) |
| Total | 56 (100.0%) | 45 (100.0%) |
Real Estate & Mortgages in Royal Lakes
Real Estate and Mortgage Overview in Royal Lakes
| Characteristic | Without Mortgage | With Mortgage |
| Housing Units | 31 | 25 |
| Median Property Value | $35,800 | $90,800 |
| Median Household Income | - | - |
| Monthly Housing Costs | $519 | $0 |
| Real Estate Taxes | $900 | $0 |
Property Value by Mortgage Status in Royal Lakes
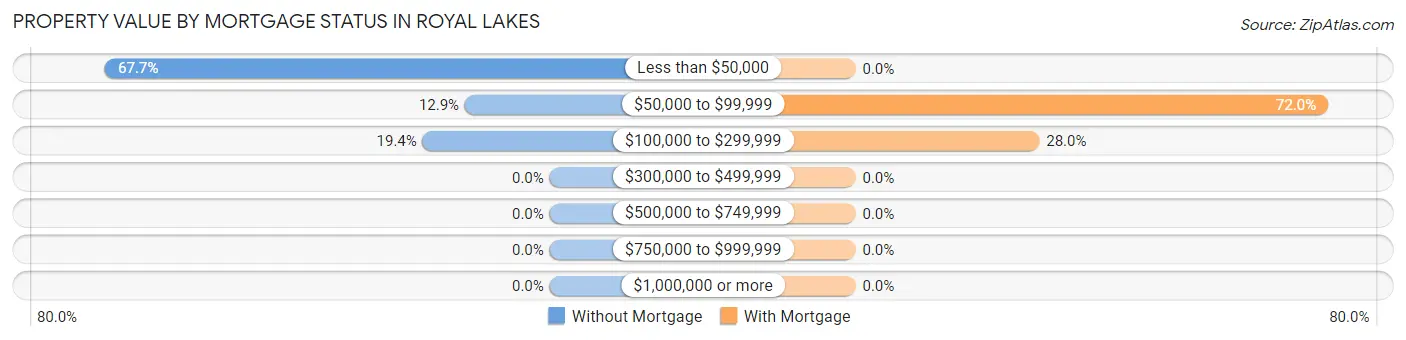
| Property Value | Without Mortgage | With Mortgage |
| Less than $50,000 | 21 (67.7%) | 0 (0.0%) |
| $50,000 to $99,999 | 4 (12.9%) | 18 (72.0%) |
| $100,000 to $299,999 | 6 (19.4%) | 7 (28.0%) |
| $300,000 to $499,999 | 0 (0.0%) | 0 (0.0%) |
| $500,000 to $749,999 | 0 (0.0%) | 0 (0.0%) |
| $750,000 to $999,999 | 0 (0.0%) | 0 (0.0%) |
| $1,000,000 or more | 0 (0.0%) | 0 (0.0%) |
| Total | 31 (100.0%) | 25 (100.0%) |
Household Income by Mortgage Status in Royal Lakes
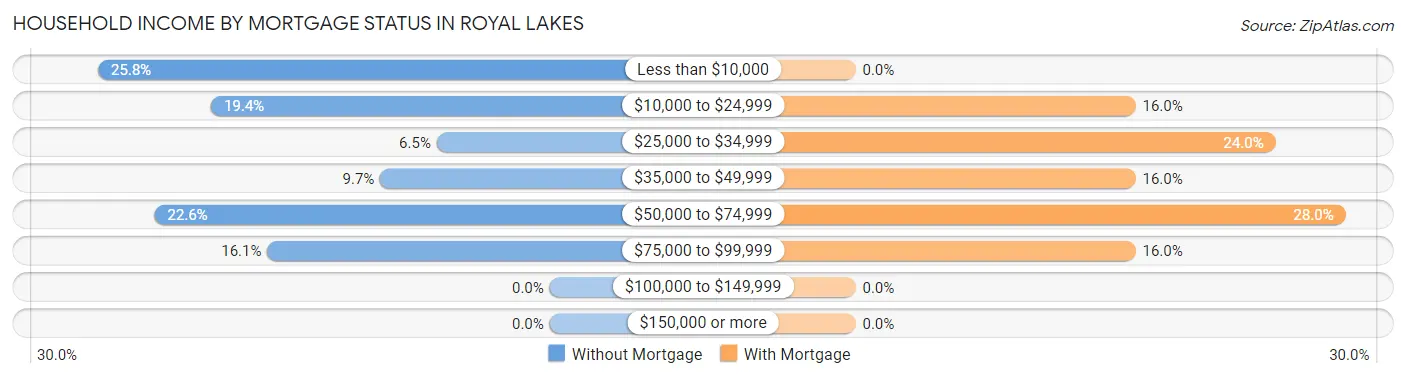
| Household Income | Without Mortgage | With Mortgage |
| Less than $10,000 | 8 (25.8%) | 0 (0.0%) |
| $10,000 to $24,999 | 6 (19.4%) | 4 (16.0%) |
| $25,000 to $34,999 | 2 (6.5%) | 6 (24.0%) |
| $35,000 to $49,999 | 3 (9.7%) | 4 (16.0%) |
| $50,000 to $74,999 | 7 (22.6%) | 7 (28.0%) |
| $75,000 to $99,999 | 5 (16.1%) | 4 (16.0%) |
| $100,000 to $149,999 | 0 (0.0%) | 0 (0.0%) |
| $150,000 or more | 0 (0.0%) | 0 (0.0%) |
| Total | 31 (100.0%) | 25 (100.0%) |
Property Value to Household Income Ratio in Royal Lakes
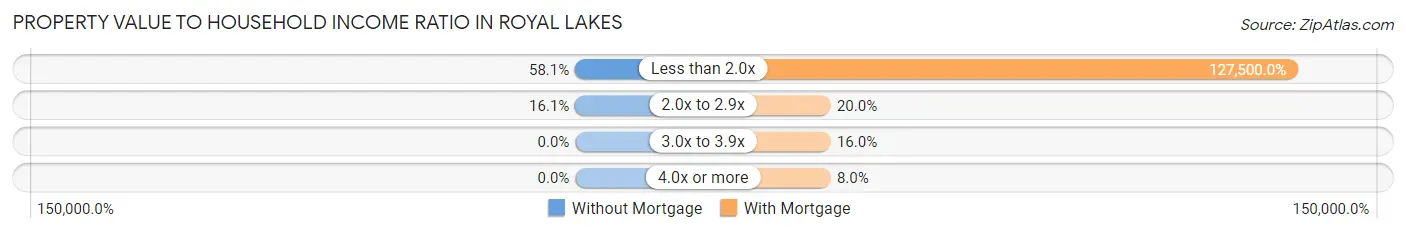
| Value-to-Income Ratio | Without Mortgage | With Mortgage |
| Less than 2.0x | 18 (58.1%) | 31,875 (127,500.0%) |
| 2.0x to 2.9x | 5 (16.1%) | 5 (20.0%) |
| 3.0x to 3.9x | 0 (0.0%) | 4 (16.0%) |
| 4.0x or more | 0 (0.0%) | 2 (8.0%) |
| Total | 31 (100.0%) | 25 (100.0%) |
Real Estate Taxes by Mortgage Status in Royal Lakes
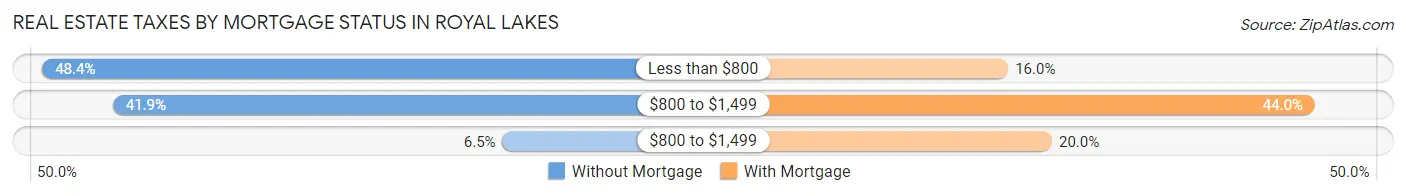
| Property Taxes | Without Mortgage | With Mortgage |
| Less than $800 | 15 (48.4%) | 4 (16.0%) |
| $800 to $1,499 | 13 (41.9%) | 11 (44.0%) |
| $800 to $1,499 | 2 (6.5%) | 5 (20.0%) |
| Total | 31 (100.0%) | 25 (100.0%) |
Health & Disability in Royal Lakes
Health Insurance Coverage by Age in Royal Lakes
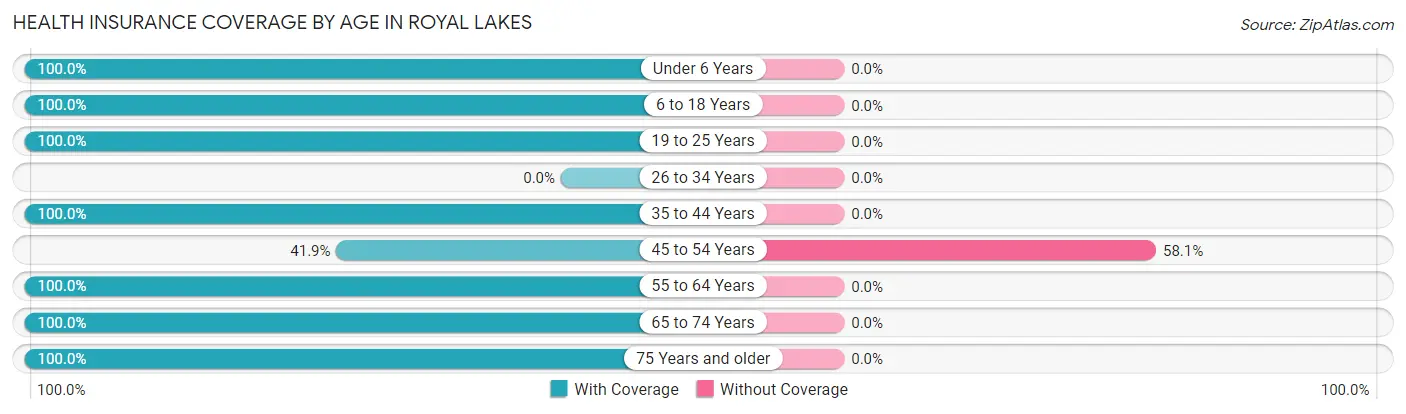
| Age Bracket | With Coverage | Without Coverage |
| Under 6 Years | 2 (100.0%) | 0 (0.0%) |
| 6 to 18 Years | 67 (100.0%) | 0 (0.0%) |
| 19 to 25 Years | 38 (100.0%) | 0 (0.0%) |
| 26 to 34 Years | 0 (0.0%) | 0 (0.0%) |
| 35 to 44 Years | 6 (100.0%) | 0 (0.0%) |
| 45 to 54 Years | 18 (41.9%) | 25 (58.1%) |
| 55 to 64 Years | 63 (100.0%) | 0 (0.0%) |
| 65 to 74 Years | 38 (100.0%) | 0 (0.0%) |
| 75 Years and older | 16 (100.0%) | 0 (0.0%) |
| Total | 248 (90.8%) | 25 (9.2%) |
Health Insurance Coverage by Citizenship Status in Royal Lakes
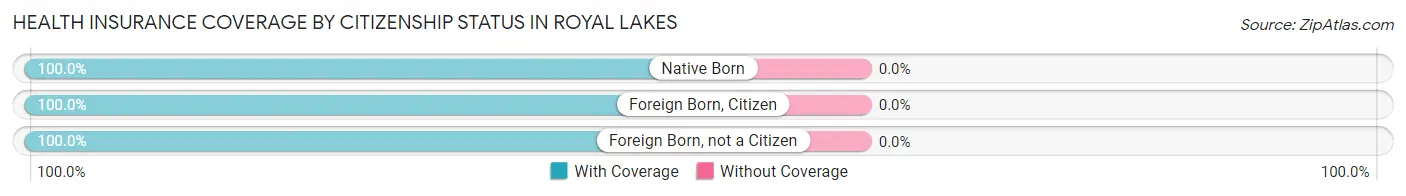
| Citizenship Status | With Coverage | Without Coverage |
| Native Born | 2 (100.0%) | 0 (0.0%) |
| Foreign Born, Citizen | 67 (100.0%) | 0 (0.0%) |
| Foreign Born, not a Citizen | 38 (100.0%) | 0 (0.0%) |
Health Insurance Coverage by Household Income in Royal Lakes
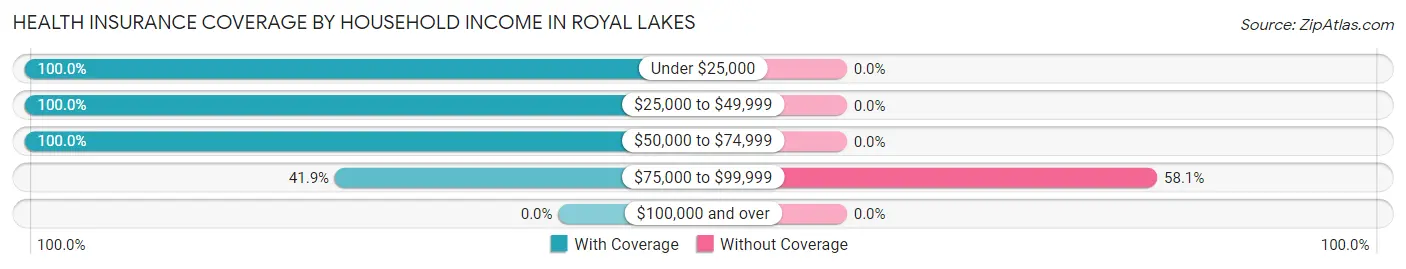
| Household Income | With Coverage | Without Coverage |
| Under $25,000 | 85 (100.0%) | 0 (0.0%) |
| $25,000 to $49,999 | 60 (100.0%) | 0 (0.0%) |
| $50,000 to $74,999 | 85 (100.0%) | 0 (0.0%) |
| $75,000 to $99,999 | 18 (41.9%) | 25 (58.1%) |
| $100,000 and over | 0 (0.0%) | 0 (0.0%) |
Public vs Private Health Insurance Coverage by Age in Royal Lakes
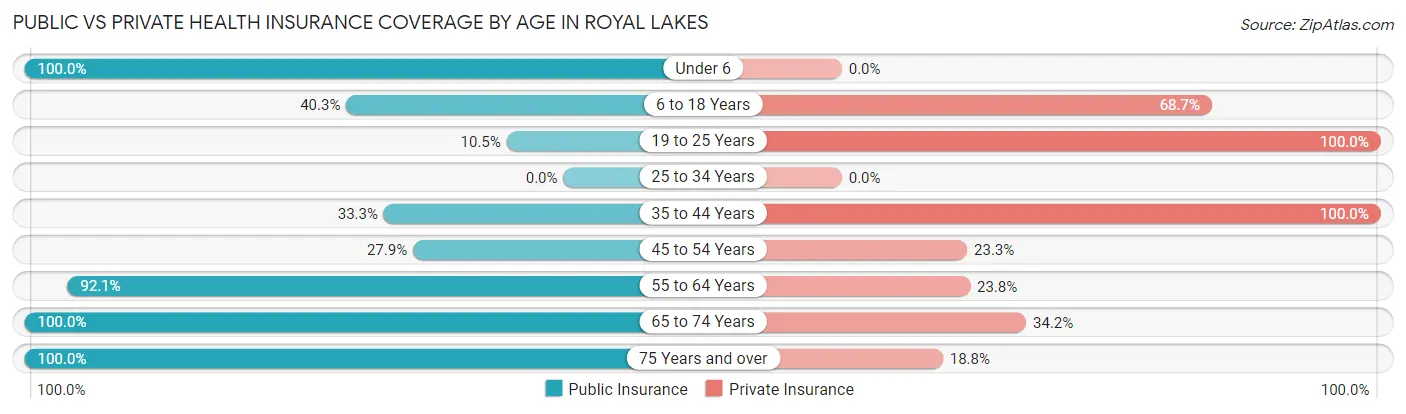
| Age Bracket | Public Insurance | Private Insurance |
| Under 6 | 2 (100.0%) | 0 (0.0%) |
| 6 to 18 Years | 27 (40.3%) | 46 (68.7%) |
| 19 to 25 Years | 4 (10.5%) | 38 (100.0%) |
| 25 to 34 Years | 0 (0.0%) | 0 (0.0%) |
| 35 to 44 Years | 2 (33.3%) | 6 (100.0%) |
| 45 to 54 Years | 12 (27.9%) | 10 (23.3%) |
| 55 to 64 Years | 58 (92.1%) | 15 (23.8%) |
| 65 to 74 Years | 38 (100.0%) | 13 (34.2%) |
| 75 Years and over | 16 (100.0%) | 3 (18.8%) |
| Total | 159 (58.2%) | 131 (48.0%) |
Disability Status by Sex by Age in Royal Lakes
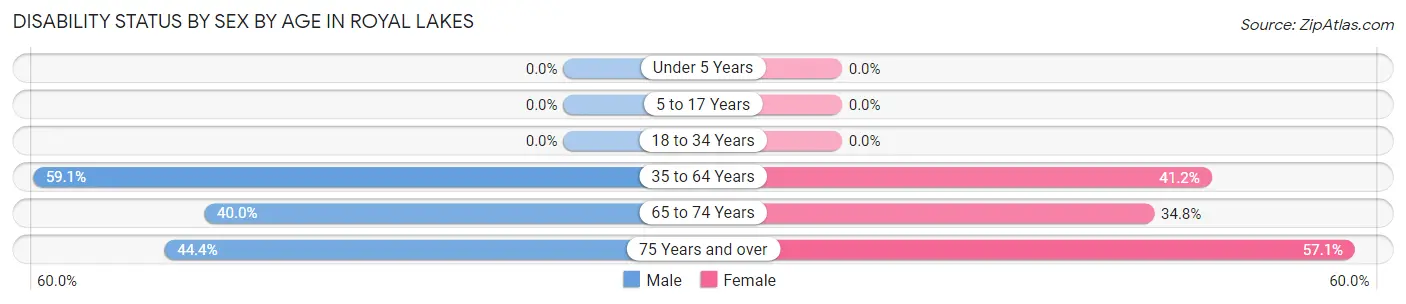
| Age Bracket | Male | Female |
| Under 5 Years | 0 (0.0%) | 0 (0.0%) |
| 5 to 17 Years | 0 (0.0%) | 0 (0.0%) |
| 18 to 34 Years | 0 (0.0%) | 0 (0.0%) |
| 35 to 64 Years | 26 (59.1%) | 28 (41.2%) |
| 65 to 74 Years | 6 (40.0%) | 8 (34.8%) |
| 75 Years and over | 4 (44.4%) | 4 (57.1%) |
Disability Class by Sex by Age in Royal Lakes
Disability Class: Hearing Difficulty
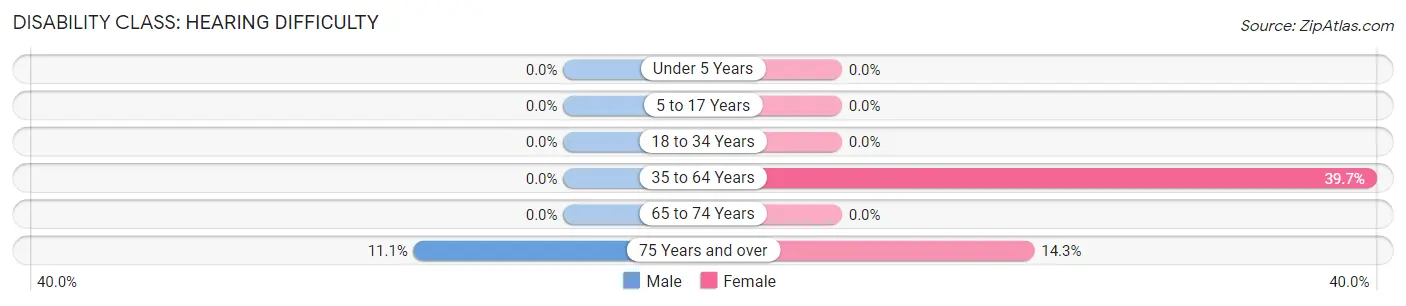
| Age Bracket | Male | Female |
| Under 5 Years | 0 (0.0%) | 0 (0.0%) |
| 5 to 17 Years | 0 (0.0%) | 0 (0.0%) |
| 18 to 34 Years | 0 (0.0%) | 0 (0.0%) |
| 35 to 64 Years | 0 (0.0%) | 27 (39.7%) |
| 65 to 74 Years | 0 (0.0%) | 0 (0.0%) |
| 75 Years and over | 1 (11.1%) | 1 (14.3%) |
Disability Class: Vision Difficulty
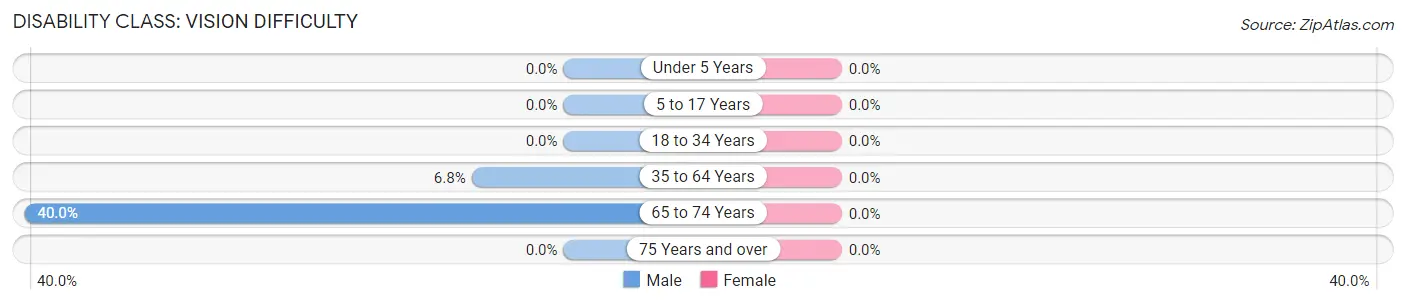
| Age Bracket | Male | Female |
| Under 5 Years | 0 (0.0%) | 0 (0.0%) |
| 5 to 17 Years | 0 (0.0%) | 0 (0.0%) |
| 18 to 34 Years | 0 (0.0%) | 0 (0.0%) |
| 35 to 64 Years | 3 (6.8%) | 0 (0.0%) |
| 65 to 74 Years | 6 (40.0%) | 0 (0.0%) |
| 75 Years and over | 0 (0.0%) | 0 (0.0%) |
Disability Class: Cognitive Difficulty
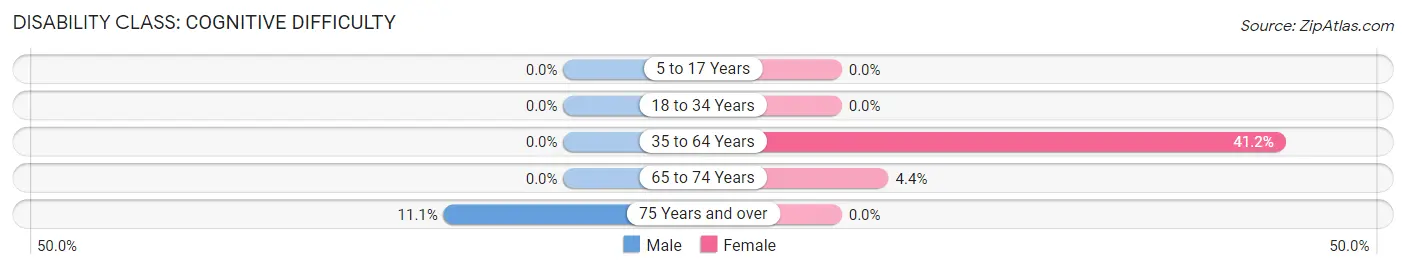
| Age Bracket | Male | Female |
| 5 to 17 Years | 0 (0.0%) | 0 (0.0%) |
| 18 to 34 Years | 0 (0.0%) | 0 (0.0%) |
| 35 to 64 Years | 0 (0.0%) | 28 (41.2%) |
| 65 to 74 Years | 0 (0.0%) | 1 (4.3%) |
| 75 Years and over | 1 (11.1%) | 0 (0.0%) |
Disability Class: Ambulatory Difficulty
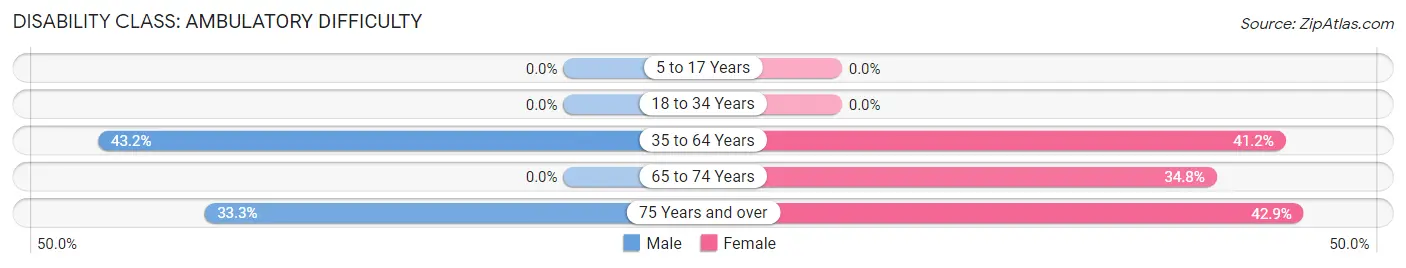
| Age Bracket | Male | Female |
| 5 to 17 Years | 0 (0.0%) | 0 (0.0%) |
| 18 to 34 Years | 0 (0.0%) | 0 (0.0%) |
| 35 to 64 Years | 19 (43.2%) | 28 (41.2%) |
| 65 to 74 Years | 0 (0.0%) | 8 (34.8%) |
| 75 Years and over | 3 (33.3%) | 3 (42.9%) |
Disability Class: Self-Care Difficulty
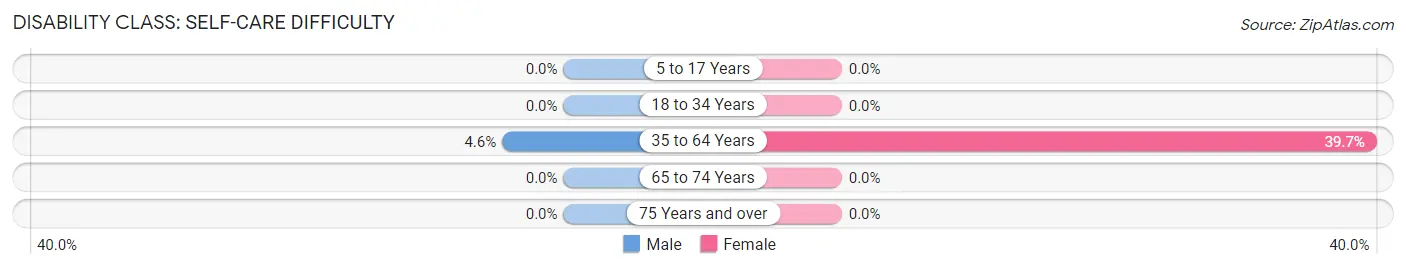
| Age Bracket | Male | Female |
| 5 to 17 Years | 0 (0.0%) | 0 (0.0%) |
| 18 to 34 Years | 0 (0.0%) | 0 (0.0%) |
| 35 to 64 Years | 2 (4.5%) | 27 (39.7%) |
| 65 to 74 Years | 0 (0.0%) | 0 (0.0%) |
| 75 Years and over | 0 (0.0%) | 0 (0.0%) |
Technology Access in Royal Lakes
Computing Device Access in Royal Lakes
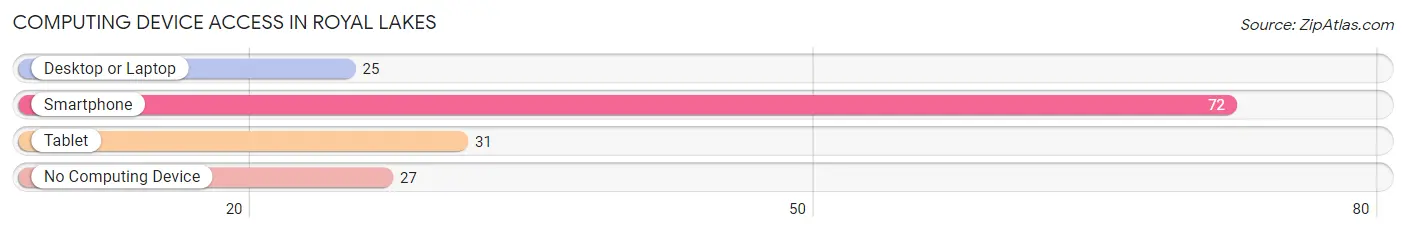
| Device Type | # Households | % Households |
| Desktop or Laptop | 25 | 24.7% |
| Smartphone | 72 | 71.3% |
| Tablet | 31 | 30.7% |
| No Computing Device | 27 | 26.7% |
| Total | 101 | 100.0% |
Internet Access in Royal Lakes
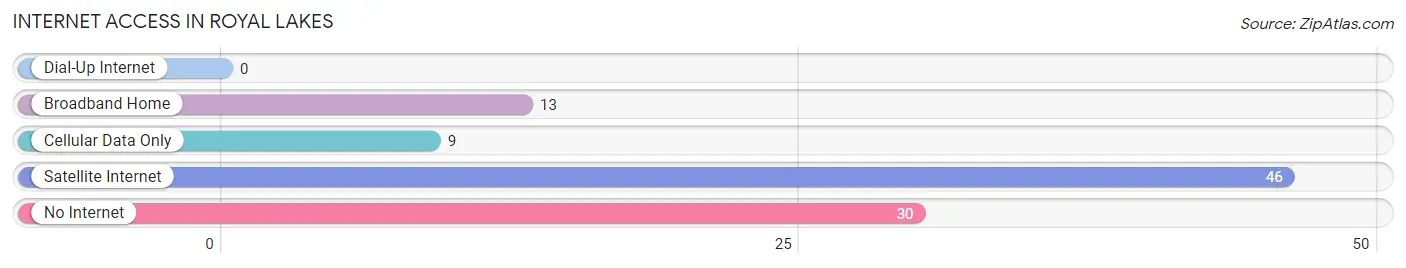
| Internet Type | # Households | % Households |
| Dial-Up Internet | 0 | 0.0% |
| Broadband Home | 13 | 12.9% |
| Cellular Data Only | 9 | 8.9% |
| Satellite Internet | 46 | 45.5% |
| No Internet | 30 | 29.7% |
| Total | 101 | 100.0% |
Royal Lakes Summary
Rivers Lakes, IL is a small village located in Lake County, Illinois. It is situated on the banks of the Fox River, and is part of the Chicago metropolitan area. The village has a population of approximately 1,500 people, and is home to a variety of businesses, including a grocery store, a bank, and a post office.
History
The area that is now Royal Lakes was first settled in the early 1800s by a group of settlers from New York. The settlers were attracted to the area due to its proximity to the Fox River, which provided a convenient transportation route for goods and people. The village was originally known as “Royalton”, and was officially incorporated in 1845.
In the late 1800s, the village experienced a period of growth and development. The village was home to a variety of businesses, including a sawmill, a grist mill, and a blacksmith shop. The village also had a post office, a bank, and a hotel.
In the early 1900s, the village experienced a period of decline. The sawmill and grist mill closed, and the population began to decline. In the 1950s, the village was revitalized by the construction of a new bridge over the Fox River. This bridge allowed for easier access to the village, and the population began to grow again.
Geography
Royal Lakes is located in Lake County, Illinois. It is situated on the banks of the Fox River, and is part of the Chicago metropolitan area. The village is located approximately 25 miles northwest of downtown Chicago.
The village is situated on a flat plain, and is surrounded by rolling hills and wooded areas. The village is located in a temperate climate, with hot summers and cold winters. The average annual temperature is around 50 degrees Fahrenheit.
Economy
The economy of Royal Lakes is largely based on agriculture and tourism. The village is home to a variety of businesses, including a grocery store, a bank, and a post office. The village also has a number of restaurants and bars.
The village is also home to a number of small manufacturing businesses, including a furniture factory and a printing company. The village is also home to a number of small retail stores, including a hardware store and a clothing store.
Demographics
As of the 2010 census, the population of Royal Lakes was 1,500 people. The village is predominantly white, with approximately 95% of the population being white. The remaining 5% of the population is made up of African Americans, Hispanics, and Asians.
The median household income in Royal Lakes is $50,000, and the median home value is $150,000. The village has a low unemployment rate, and the majority of the population is employed in the service industry.
Royal Lakes is a small village with a rich history and a vibrant economy. The village is home to a variety of businesses, and is a popular destination for tourists. The village is also home to a diverse population, and is a great place to live and work.
Common Questions
What is the Total Population of Royal Lakes?
Total Population of Royal Lakes is 273.
What is the Total Male Population of Royal Lakes?
Total Male Population of Royal Lakes is 83.
What is the Total Female Population of Royal Lakes?
Total Female Population of Royal Lakes is 190.
What is the Ratio of Males per 100 Females in Royal Lakes?
There are 43.68 Males per 100 Females in Royal Lakes.
What is the Ratio of Females per 100 Males in Royal Lakes?
There are 228.92 Females per 100 Males in Royal Lakes.
What is the Median Population Age in Royal Lakes?
Median Population Age in Royal Lakes is 54.2 Years.
What is the Average Family Size in Royal Lakes
Average Family Size in Royal Lakes is 4.9 People.
What is the Average Household Size in Royal Lakes
Average Household Size in Royal Lakes is 2.7 People.
What is Per Capita Income in Royal Lakes?
Per Capita income in Royal Lakes is $13,380.
What is the Median Family Income in Royal Lakes?
Median Family Income in Royal Lakes is $38,125.
What is Inequality or Gini Index in Royal Lakes?
Inequality or Gini Index in Royal Lakes is 0.47.
How Large is the Labor Force in Royal Lakes?
There are 36 People in the Labor Forcein in Royal Lakes.
What is the Percentage of People in the Labor Force in Royal Lakes?
15.2% of People are in the Labor Force in Royal Lakes.
What is the Unemployment Rate in Royal Lakes?
Unemployment Rate in Royal Lakes is 30.6%.