Illiopolis, IL
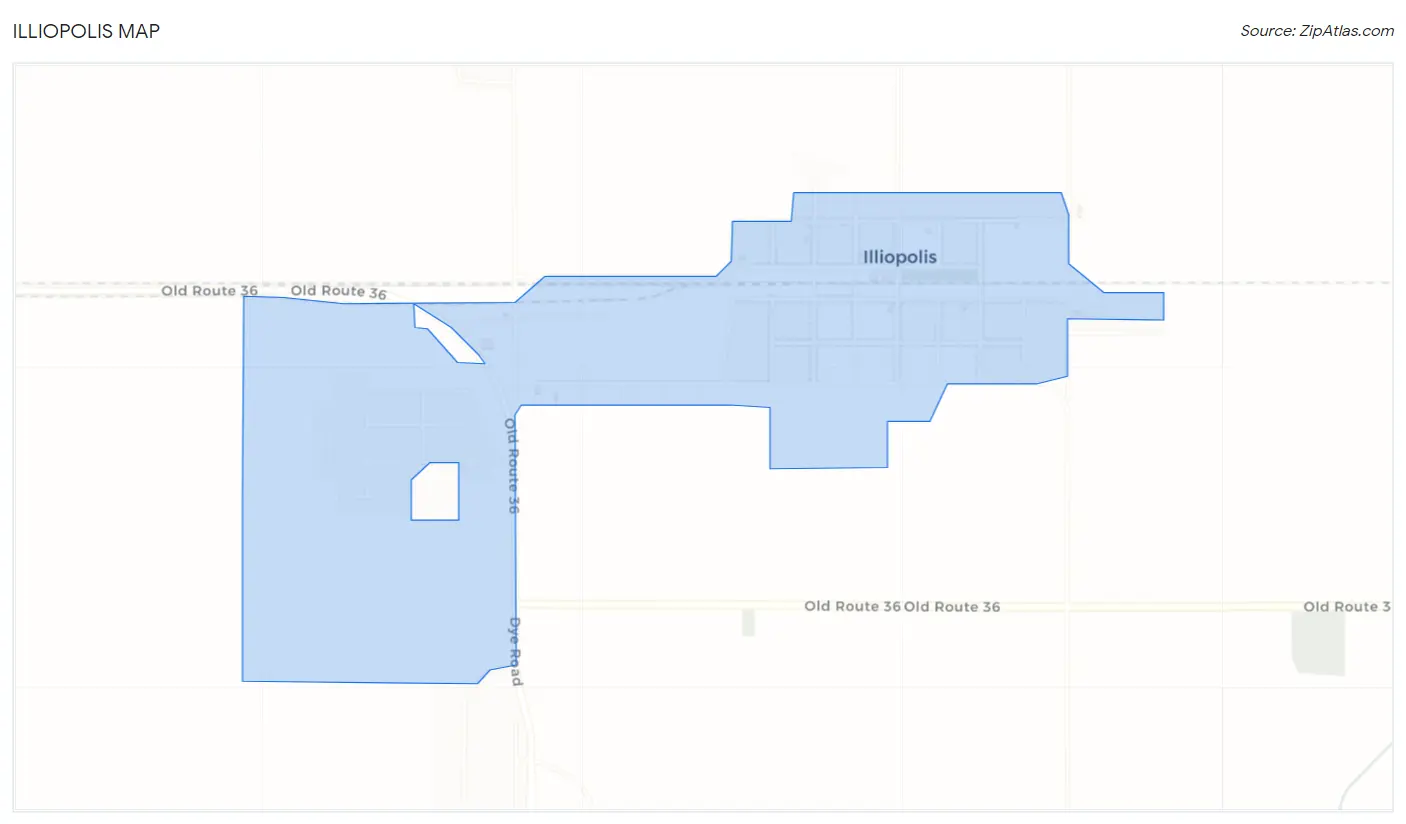
Illiopolis Map
Illiopolis Overview
822
TOTAL POPULATION
433
MALE POPULATION
389
FEMALE POPULATION
111.31
MALES / 100 FEMALES
89.84
FEMALES / 100 MALES
40.3
MEDIAN AGE
3.2
AVG FAMILY SIZE
2.5
AVG HOUSEHOLD SIZE
$31,268
PER CAPITA INCOME
$90,000
AVG FAMILY INCOME
$77,292
AVG HOUSEHOLD INCOME
25.8%
WAGE / INCOME GAP [ % ]
74.2¢/ $1
WAGE / INCOME GAP [ $ ]
0.35
INEQUALITY / GINI INDEX
400
LABOR FORCE [ PEOPLE ]
63.9%
PERCENT IN LABOR FORCE
2.5%
UNEMPLOYMENT RATE
Illiopolis Zip Codes
Illiopolis Area Codes
Race in Illiopolis
The most populous races in Illiopolis are White / Caucasian (783 | 95.3%), Two or more Races (32 | 3.9%), and Hispanic or Latino (13 | 1.6%).
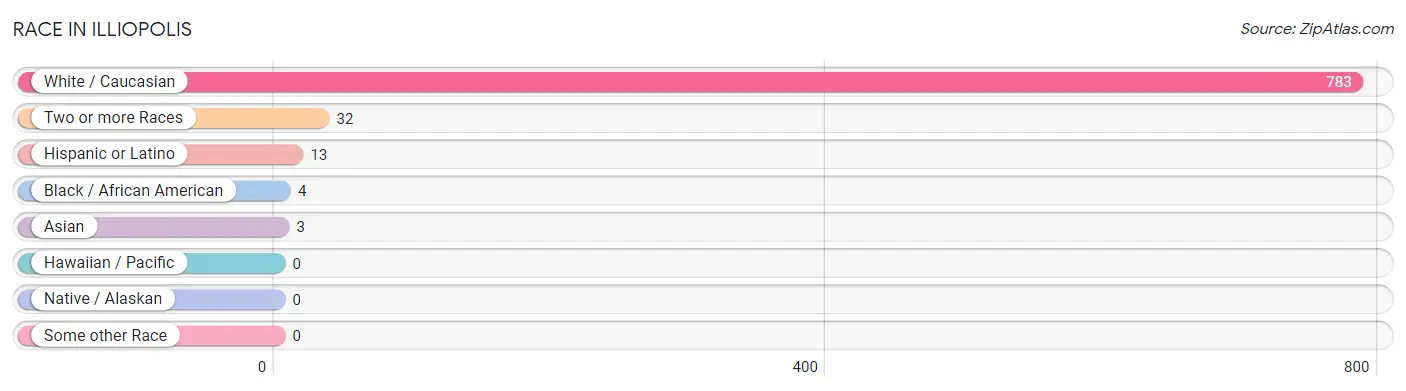
| Race | # Population | % Population |
| Asian | 3 | 0.4% |
| Black / African American | 4 | 0.5% |
| Hawaiian / Pacific | 0 | 0.0% |
| Hispanic or Latino | 13 | 1.6% |
| Native / Alaskan | 0 | 0.0% |
| White / Caucasian | 783 | 95.3% |
| Two or more Races | 32 | 3.9% |
| Some other Race | 0 | 0.0% |
| Total | 822 | 100.0% |
Ancestry in Illiopolis
The most populous ancestries reported in Illiopolis are German (190 | 23.1%), English (141 | 17.2%), Irish (102 | 12.4%), American (54 | 6.6%), and Italian (39 | 4.7%), together accounting for 64.0% of all Illiopolis residents.
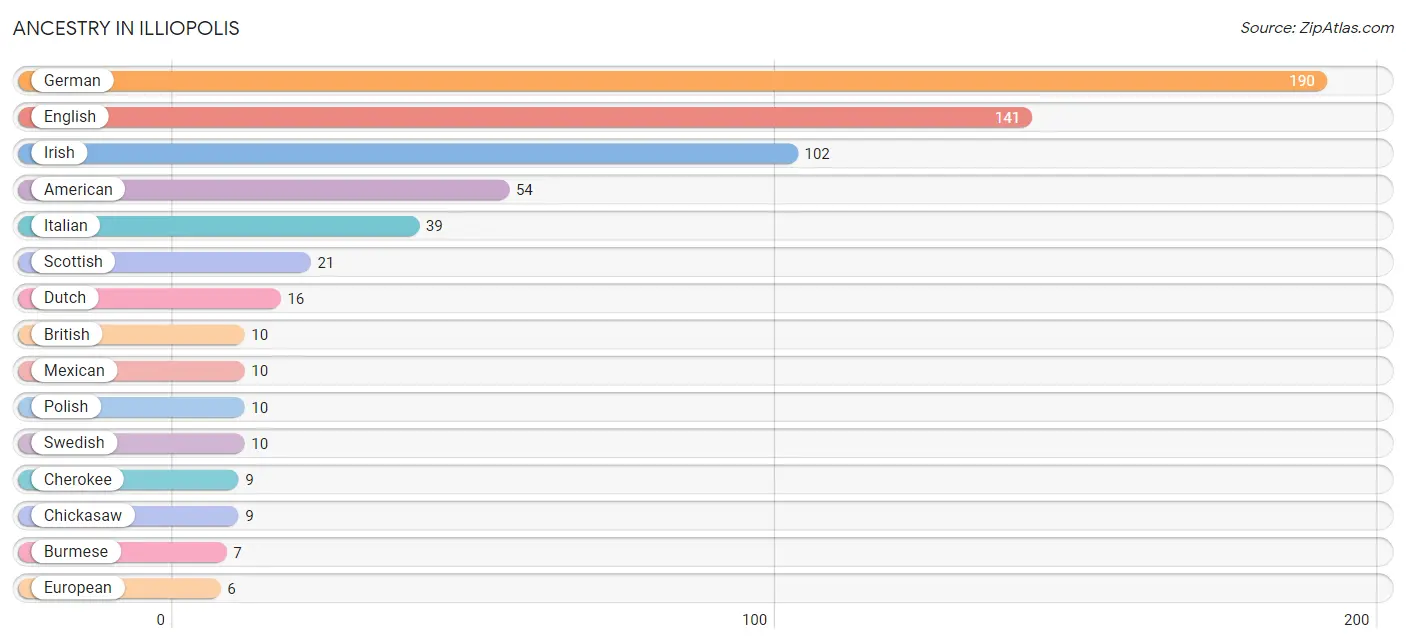
| Ancestry | # Population | % Population |
| American | 54 | 6.6% |
| Austrian | 2 | 0.2% |
| British | 10 | 1.2% |
| Burmese | 7 | 0.9% |
| Cherokee | 9 | 1.1% |
| Chickasaw | 9 | 1.1% |
| Cuban | 2 | 0.2% |
| Dutch | 16 | 1.9% |
| English | 141 | 17.2% |
| European | 6 | 0.7% |
| French | 4 | 0.5% |
| German | 190 | 23.1% |
| Greek | 1 | 0.1% |
| Hungarian | 2 | 0.2% |
| Irish | 102 | 12.4% |
| Italian | 39 | 4.7% |
| Korean | 2 | 0.2% |
| Mexican | 10 | 1.2% |
| Mexican American Indian | 2 | 0.2% |
| Nigerian | 2 | 0.2% |
| Polish | 10 | 1.2% |
| Scotch-Irish | 2 | 0.2% |
| Scottish | 21 | 2.5% |
| Spanish | 1 | 0.1% |
| Subsaharan African | 2 | 0.2% |
| Swedish | 10 | 1.2% |
| Welsh | 5 | 0.6% | View All 27 Rows |
Immigrants in Illiopolis
The most numerous immigrant groups reported in Illiopolis came from Africa (2 | 0.2%), Asia (2 | 0.2%), Europe (2 | 0.2%), Germany (2 | 0.2%), and Nigeria (2 | 0.2%), together accounting for 1.2% of all Illiopolis residents.
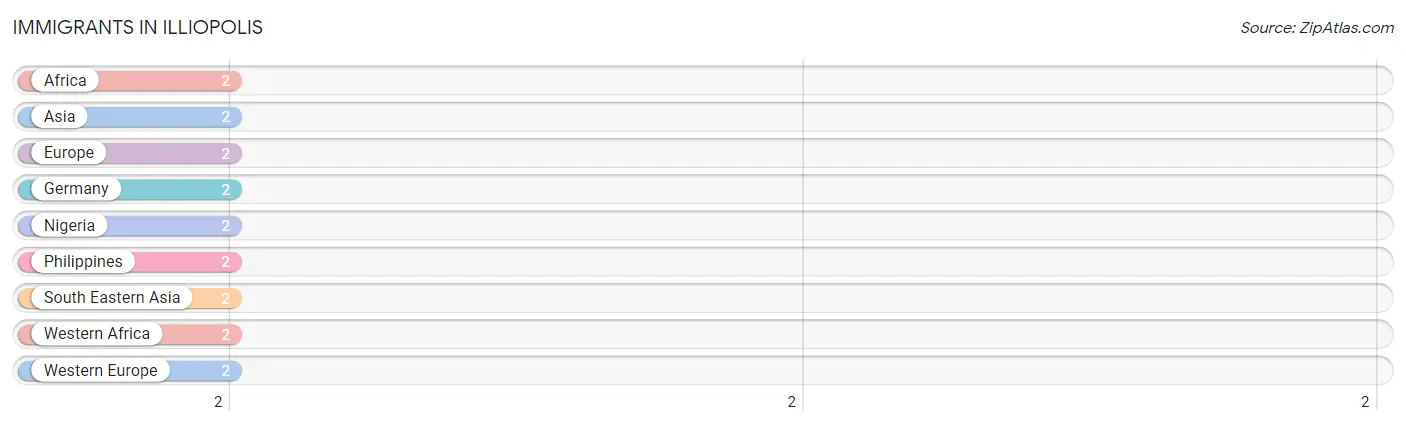
| Immigration Origin | # Population | % Population |
| Africa | 2 | 0.2% |
| Asia | 2 | 0.2% |
| Europe | 2 | 0.2% |
| Germany | 2 | 0.2% |
| Nigeria | 2 | 0.2% |
| Philippines | 2 | 0.2% |
| South Eastern Asia | 2 | 0.2% |
| Western Africa | 2 | 0.2% |
| Western Europe | 2 | 0.2% | View All 9 Rows |
Sex and Age in Illiopolis
Sex and Age in Illiopolis
The most populous age groups in Illiopolis are 55 to 59 Years (53 | 12.2%) for men and 55 to 59 Years (42 | 10.8%) for women.
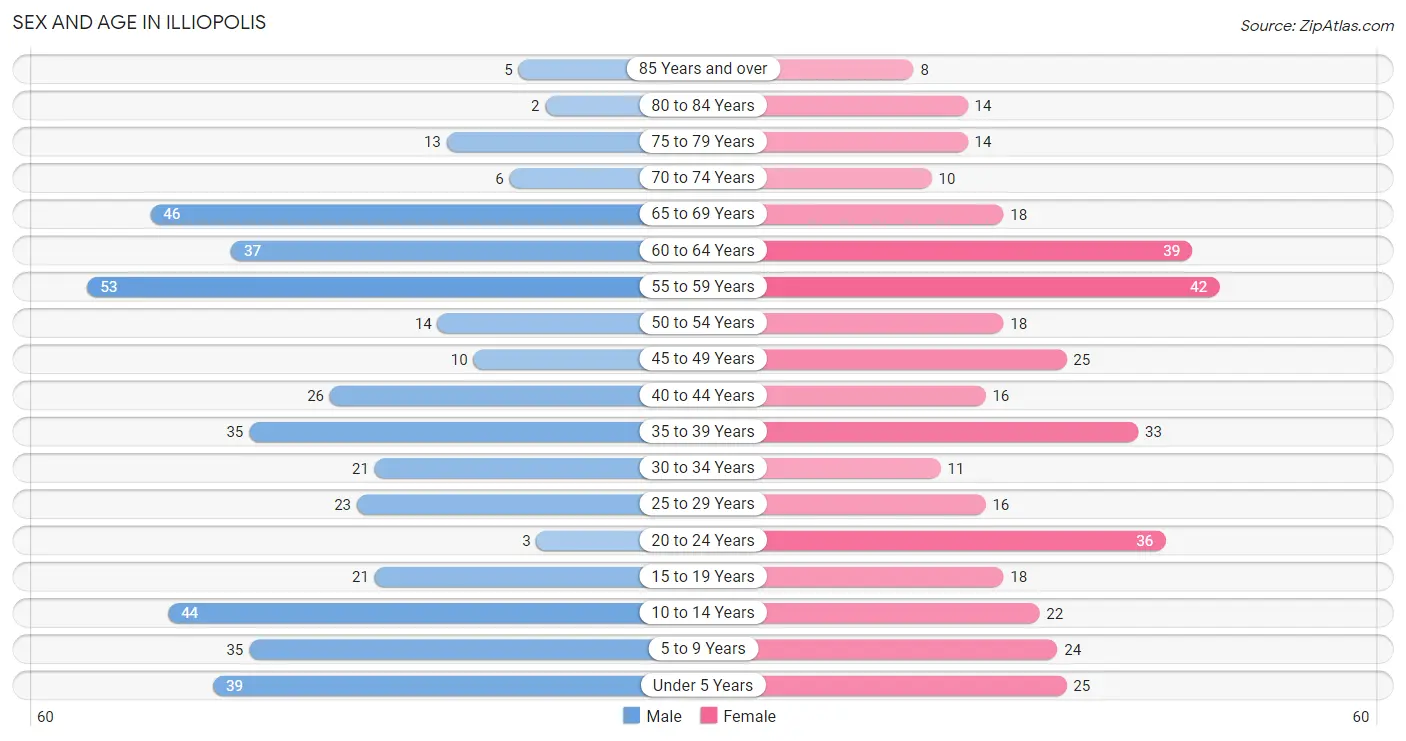
| Age Bracket | Male | Female |
| Under 5 Years | 39 (9.0%) | 25 (6.4%) |
| 5 to 9 Years | 35 (8.1%) | 24 (6.2%) |
| 10 to 14 Years | 44 (10.2%) | 22 (5.7%) |
| 15 to 19 Years | 21 (4.9%) | 18 (4.6%) |
| 20 to 24 Years | 3 (0.7%) | 36 (9.2%) |
| 25 to 29 Years | 23 (5.3%) | 16 (4.1%) |
| 30 to 34 Years | 21 (4.9%) | 11 (2.8%) |
| 35 to 39 Years | 35 (8.1%) | 33 (8.5%) |
| 40 to 44 Years | 26 (6.0%) | 16 (4.1%) |
| 45 to 49 Years | 10 (2.3%) | 25 (6.4%) |
| 50 to 54 Years | 14 (3.2%) | 18 (4.6%) |
| 55 to 59 Years | 53 (12.2%) | 42 (10.8%) |
| 60 to 64 Years | 37 (8.6%) | 39 (10.0%) |
| 65 to 69 Years | 46 (10.6%) | 18 (4.6%) |
| 70 to 74 Years | 6 (1.4%) | 10 (2.6%) |
| 75 to 79 Years | 13 (3.0%) | 14 (3.6%) |
| 80 to 84 Years | 2 (0.5%) | 14 (3.6%) |
| 85 Years and over | 5 (1.1%) | 8 (2.1%) |
| Total | 433 (100.0%) | 389 (100.0%) |
Families and Households in Illiopolis
Median Family Size in Illiopolis
The median family size in Illiopolis is 3.16 persons per family, with married-couple families (175 | 79.5%) accounting for the largest median family size of 3.25 persons per family. On the other hand, single male/father families (26 | 11.8%) represent the smallest median family size with 2.58 persons per family.
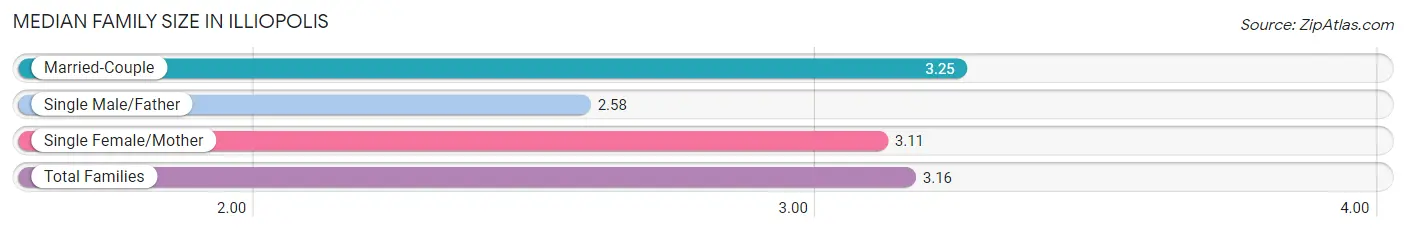
| Family Type | # Families | Family Size |
| Married-Couple | 175 (79.5%) | 3.25 |
| Single Male/Father | 26 (11.8%) | 2.58 |
| Single Female/Mother | 19 (8.6%) | 3.11 |
| Total Families | 220 (100.0%) | 3.16 |
Median Household Size in Illiopolis
The median household size in Illiopolis is 2.48 persons per household, with single female/mother households (19 | 5.7%) accounting for the largest median household size of 3.37 persons per household. non-family households (111 | 33.5%) represent the smallest median household size with 1.05 persons per household.
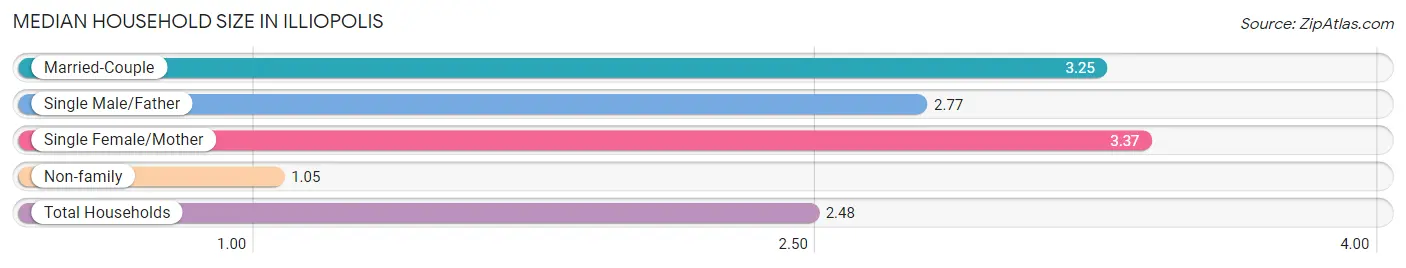
| Household Type | # Households | Household Size |
| Married-Couple | 175 (52.9%) | 3.25 |
| Single Male/Father | 26 (7.9%) | 2.77 |
| Single Female/Mother | 19 (5.7%) | 3.37 |
| Non-family | 111 (33.5%) | 1.05 |
| Total Households | 331 (100.0%) | 2.48 |
Household Size by Marriage Status in Illiopolis
Out of a total of 331 households in Illiopolis, 220 (66.5%) are family households, while 111 (33.5%) are nonfamily households. The most numerous type of family households are 2-person households, comprising 127, and the most common type of nonfamily households are 1-person households, comprising 104.
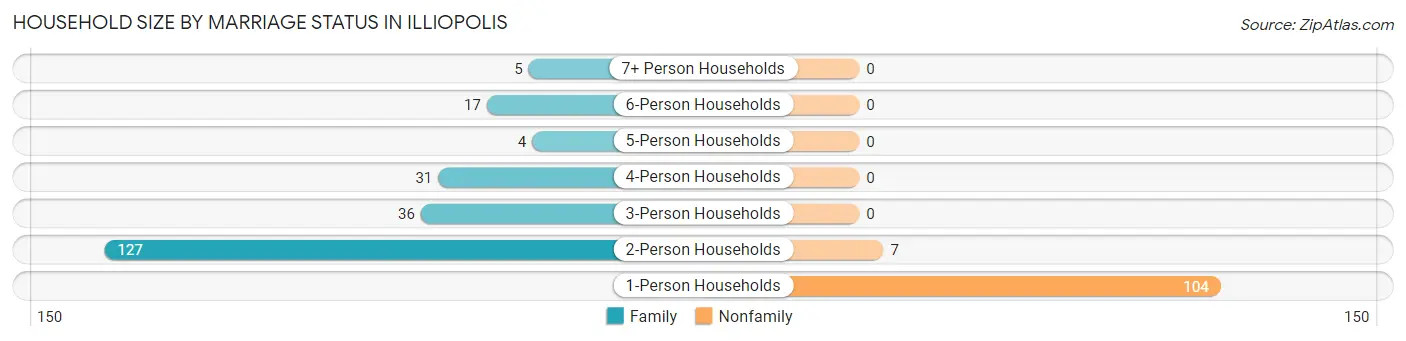
| Household Size | Family Households | Nonfamily Households |
| 1-Person Households | - | 104 (31.4%) |
| 2-Person Households | 127 (38.4%) | 7 (2.1%) |
| 3-Person Households | 36 (10.9%) | 0 (0.0%) |
| 4-Person Households | 31 (9.4%) | 0 (0.0%) |
| 5-Person Households | 4 (1.2%) | 0 (0.0%) |
| 6-Person Households | 17 (5.1%) | 0 (0.0%) |
| 7+ Person Households | 5 (1.5%) | 0 (0.0%) |
| Total | 220 (66.5%) | 111 (33.5%) |
Female Fertility in Illiopolis
Fertility by Age in Illiopolis
Average fertility rate in Illiopolis is 88.0 births per 1,000 women. Women in the age bracket of 20 to 34 years have the highest fertility rate with 206.0 births per 1,000 women. Women in the age bracket of 20 to 34 years acount for 92.9% of all women with births.
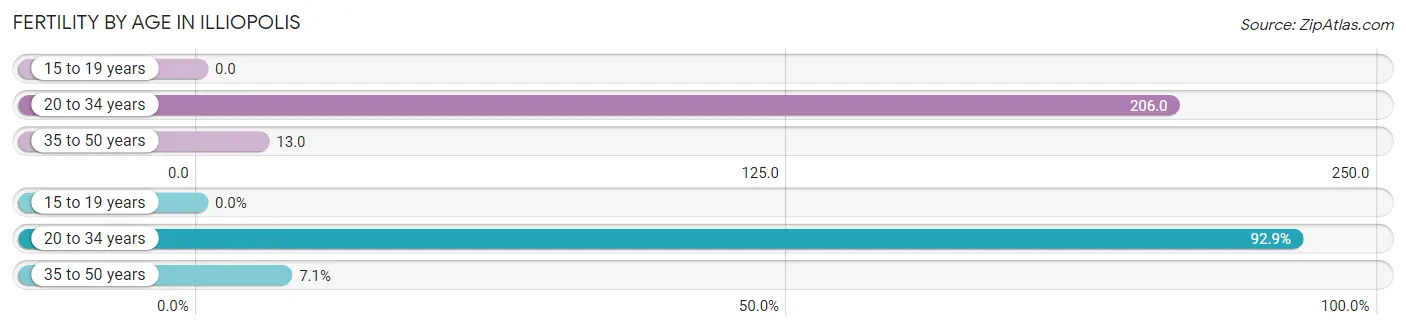
| Age Bracket | Women with Births | Births / 1,000 Women |
| 15 to 19 years | 0 (0.0%) | 0.0 |
| 20 to 34 years | 13 (92.9%) | 206.0 |
| 35 to 50 years | 1 (7.1%) | 13.0 |
| Total | 14 (100.0%) | 88.0 |
Fertility by Age by Marriage Status in Illiopolis
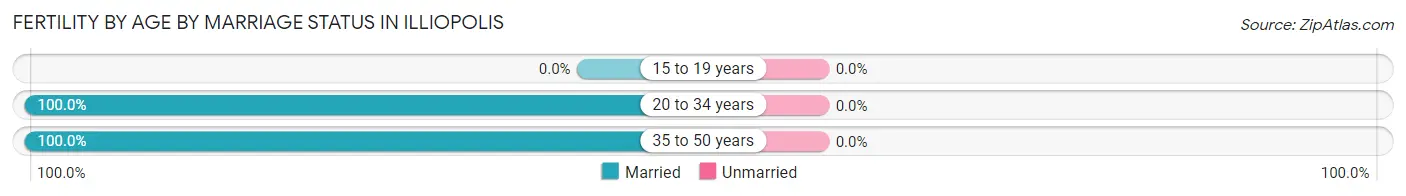
| Age Bracket | Married | Unmarried |
| 15 to 19 years | 0 (0.0%) | 0 (0.0%) |
| 20 to 34 years | 13 (100.0%) | 0 (0.0%) |
| 35 to 50 years | 1 (100.0%) | 0 (0.0%) |
| Total | 14 (100.0%) | 0 (0.0%) |
Fertility by Education in Illiopolis
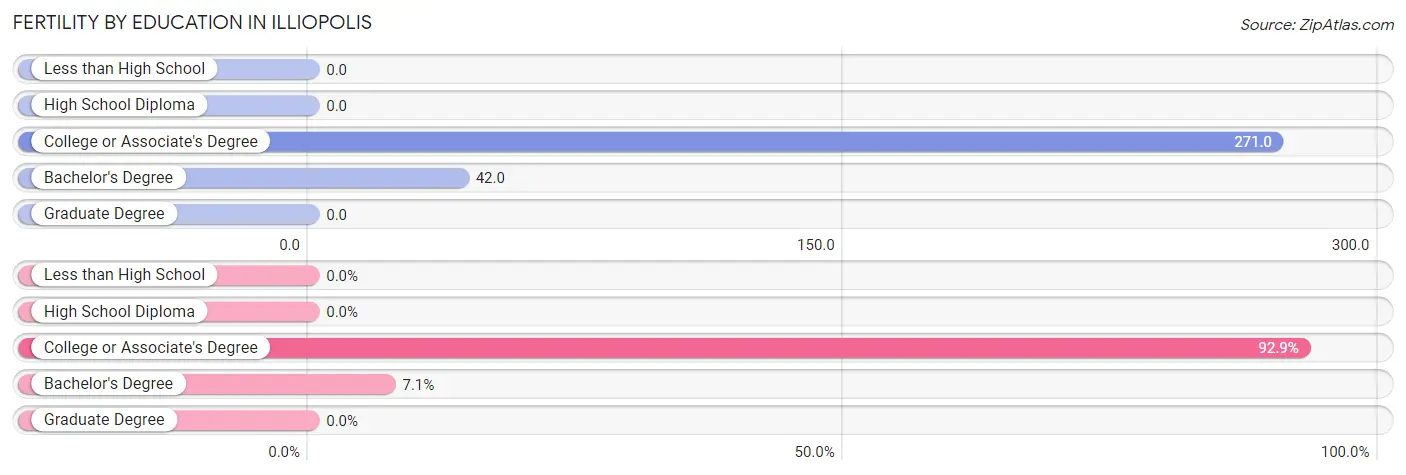
| Educational Attainment | Women with Births | Births / 1,000 Women |
| Less than High School | 0 (0.0%) | 0.0 |
| High School Diploma | 0 (0.0%) | 0.0 |
| College or Associate's Degree | 13 (92.9%) | 271.0 |
| Bachelor's Degree | 1 (7.1%) | 42.0 |
| Graduate Degree | 0 (0.0%) | 0.0 |
| Total | 14 (100.0%) | 88.0 |
Fertility by Education by Marriage Status in Illiopolis
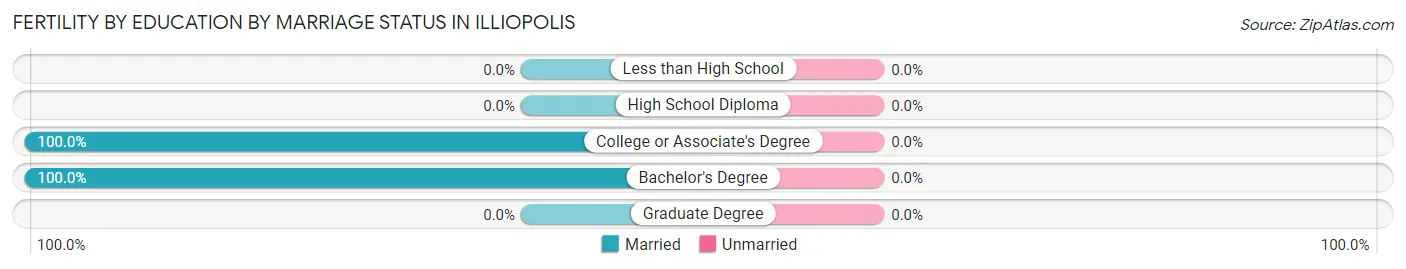
| Educational Attainment | Married | Unmarried |
| Less than High School | 0 (0.0%) | 0 (0.0%) |
| High School Diploma | 0 (0.0%) | 0 (0.0%) |
| College or Associate's Degree | 13 (100.0%) | 0 (0.0%) |
| Bachelor's Degree | 1 (100.0%) | 0 (0.0%) |
| Graduate Degree | 0 (0.0%) | 0 (0.0%) |
| Total | 14 (100.0%) | 0 (0.0%) |
Income in Illiopolis
Income Overview in Illiopolis
Per Capita Income in Illiopolis is $31,268, while median incomes of families and households are $90,000 and $77,292 respectively.
| Characteristic | Number | Measure |
| Per Capita Income | 822 | $31,268 |
| Median Family Income | 220 | $90,000 |
| Mean Family Income | 220 | $93,105 |
| Median Household Income | 331 | $77,292 |
| Mean Household Income | 331 | $75,205 |
| Income Deficit | 220 | $0 |
| Wage / Income Gap (%) | 822 | 25.85% |
| Wage / Income Gap ($) | 822 | 74.15¢ per $1 |
| Gini / Inequality Index | 822 | 0.35 |
Earnings by Sex in Illiopolis
Average Earnings in Illiopolis are $43,125, $51,667 for men and $38,313 for women, a difference of 25.9%.
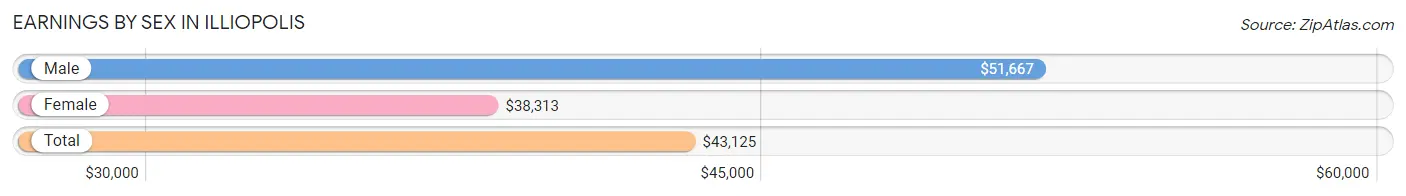
| Sex | Number | Average Earnings |
| Male | 214 (50.3%) | $51,667 |
| Female | 211 (49.6%) | $38,313 |
| Total | 425 (100.0%) | $43,125 |
Earnings by Sex by Income Bracket in Illiopolis
The most common earnings brackets in Illiopolis are $75,000 to $99,999 for men (31 | 14.5%) and $30,000 to $34,999 for women (25 | 11.8%).
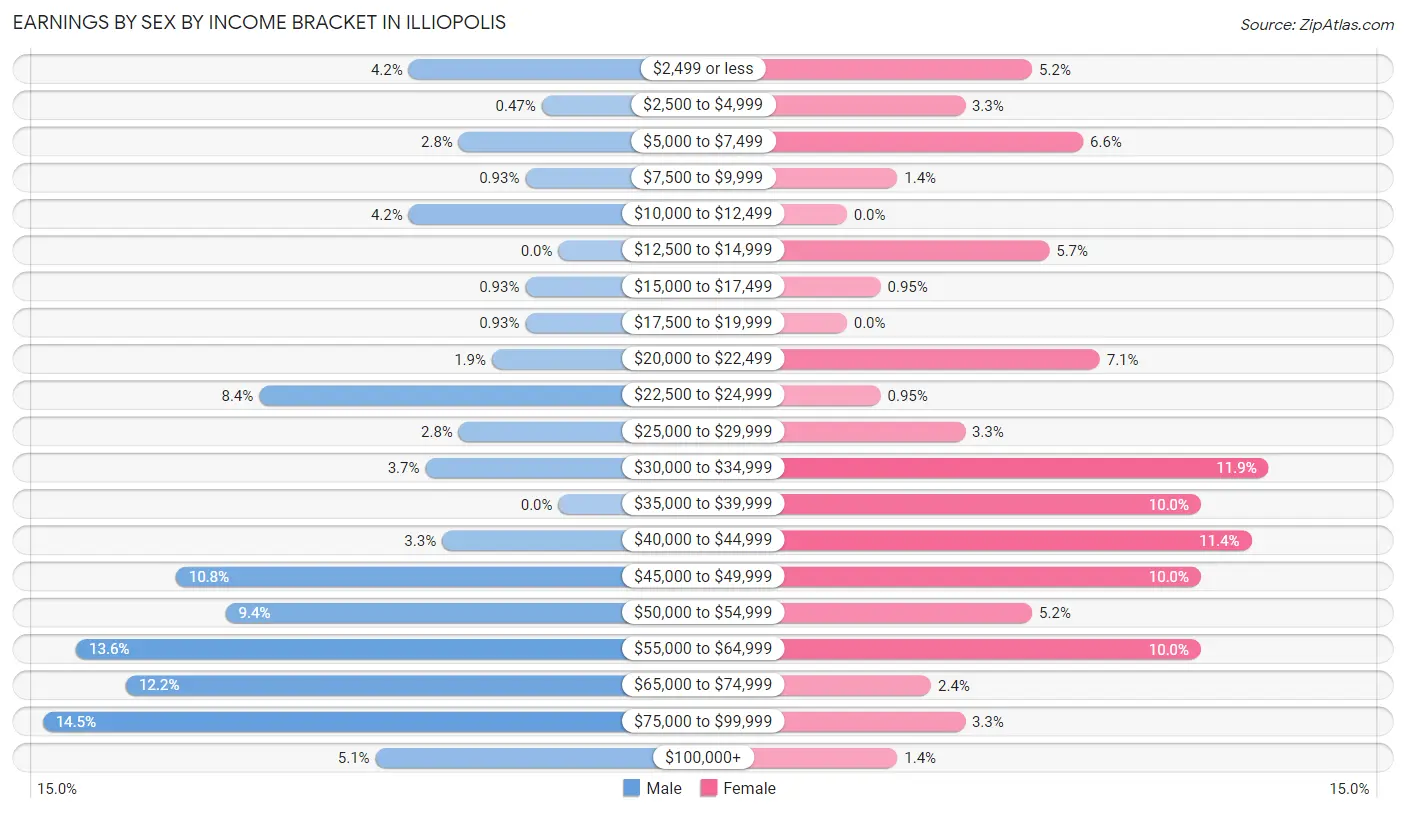
| Income | Male | Female |
| $2,499 or less | 9 (4.2%) | 11 (5.2%) |
| $2,500 to $4,999 | 1 (0.5%) | 7 (3.3%) |
| $5,000 to $7,499 | 6 (2.8%) | 14 (6.6%) |
| $7,500 to $9,999 | 2 (0.9%) | 3 (1.4%) |
| $10,000 to $12,499 | 9 (4.2%) | 0 (0.0%) |
| $12,500 to $14,999 | 0 (0.0%) | 12 (5.7%) |
| $15,000 to $17,499 | 2 (0.9%) | 2 (0.9%) |
| $17,500 to $19,999 | 2 (0.9%) | 0 (0.0%) |
| $20,000 to $22,499 | 4 (1.9%) | 15 (7.1%) |
| $22,500 to $24,999 | 18 (8.4%) | 2 (0.9%) |
| $25,000 to $29,999 | 6 (2.8%) | 7 (3.3%) |
| $30,000 to $34,999 | 8 (3.7%) | 25 (11.8%) |
| $35,000 to $39,999 | 0 (0.0%) | 21 (10.0%) |
| $40,000 to $44,999 | 7 (3.3%) | 24 (11.4%) |
| $45,000 to $49,999 | 23 (10.7%) | 21 (10.0%) |
| $50,000 to $54,999 | 20 (9.3%) | 11 (5.2%) |
| $55,000 to $64,999 | 29 (13.6%) | 21 (10.0%) |
| $65,000 to $74,999 | 26 (12.1%) | 5 (2.4%) |
| $75,000 to $99,999 | 31 (14.5%) | 7 (3.3%) |
| $100,000+ | 11 (5.1%) | 3 (1.4%) |
| Total | 214 (100.0%) | 211 (100.0%) |
Earnings by Sex by Educational Attainment in Illiopolis
Average earnings in Illiopolis are $52,500 for men and $39,938 for women, a difference of 23.9%. Men with an educational attainment of bachelor's degree enjoy the highest average annual earnings of $67,083, while those with graduate degree education earn the least with $23,750. Women with an educational attainment of bachelor's degree earn the most with the average annual earnings of $49,063, while those with high school diploma education have the smallest earnings of $39,250.
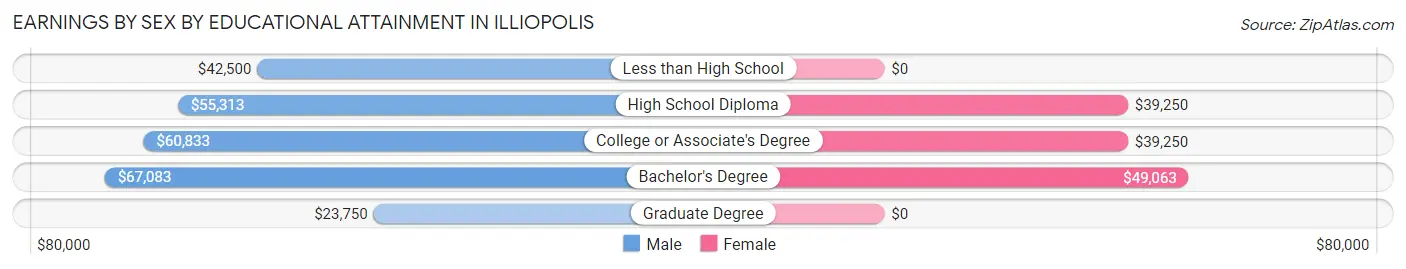
| Educational Attainment | Male Income | Female Income |
| Less than High School | $42,500 | $0 |
| High School Diploma | $55,313 | $39,250 |
| College or Associate's Degree | $60,833 | $39,250 |
| Bachelor's Degree | $67,083 | $49,063 |
| Graduate Degree | $23,750 | $0 |
| Total | $52,500 | $39,938 |
Family Income in Illiopolis
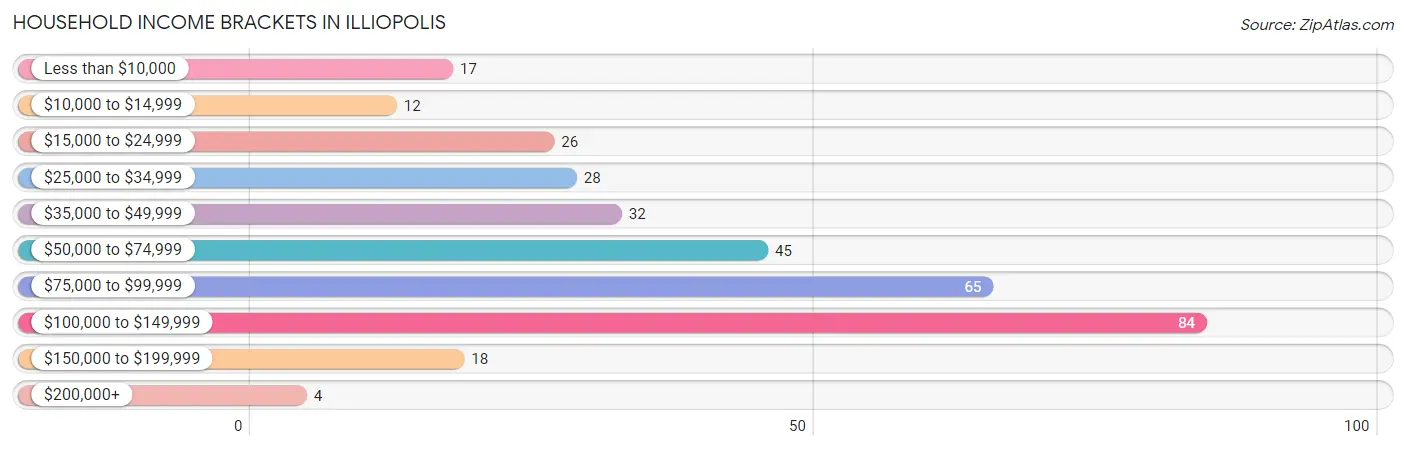
Family Income Brackets in Illiopolis
According to the Illiopolis family income data, there are 76 families falling into the $100,000 to $149,999 income range, which is the most common income bracket and makes up 34.5% of all families.
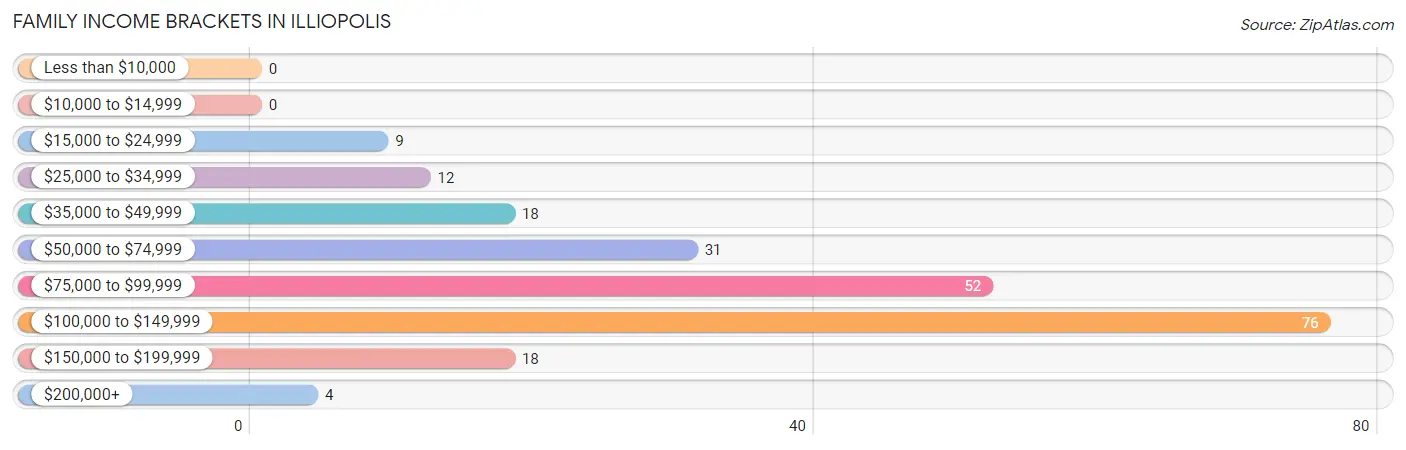
| Income Bracket | # Families | % Families |
| Less than $10,000 | 0 | 0.0% |
| $10,000 to $14,999 | 0 | 0.0% |
| $15,000 to $24,999 | 9 | 4.1% |
| $25,000 to $34,999 | 12 | 5.5% |
| $35,000 to $49,999 | 18 | 8.2% |
| $50,000 to $74,999 | 31 | 14.1% |
| $75,000 to $99,999 | 52 | 23.6% |
| $100,000 to $149,999 | 76 | 34.5% |
| $150,000 to $199,999 | 18 | 8.2% |
| $200,000+ | 4 | 1.8% |
Family Income by Famaliy Size in Illiopolis
3-person families (29 | 13.2%) account for the highest median family income in Illiopolis with $113,438 per family, while 2-person families (134 | 60.9%) have the highest median income of $44,375 per family member.
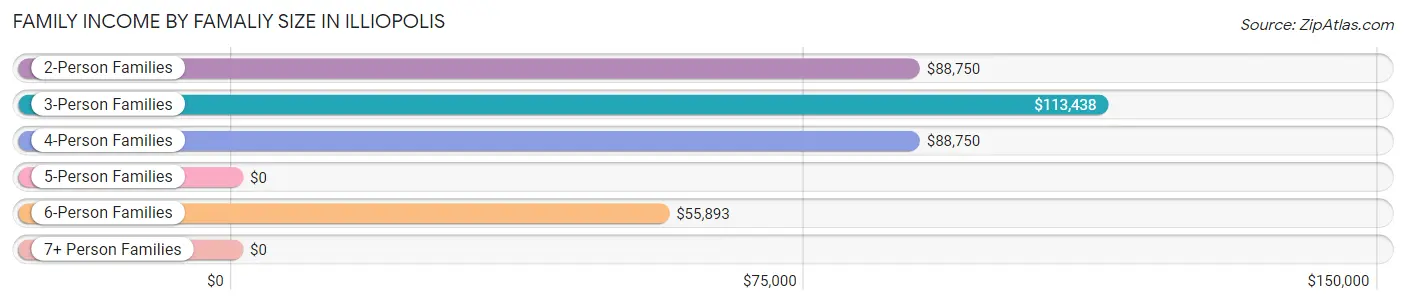
| Income Bracket | # Families | Median Income |
| 2-Person Families | 134 (60.9%) | $88,750 |
| 3-Person Families | 29 (13.2%) | $113,438 |
| 4-Person Families | 31 (14.1%) | $88,750 |
| 5-Person Families | 4 (1.8%) | $0 |
| 6-Person Families | 17 (7.7%) | $55,893 |
| 7+ Person Families | 5 (2.3%) | $0 |
| Total | 220 (100.0%) | $90,000 |
Family Income by Number of Earners in Illiopolis
The median family income in Illiopolis is $90,000, with families comprising 3+ earners (19) having the highest median family income of $114,583, while families with 1 earner (82) have the lowest median family income of $56,071, accounting for 8.6% and 37.3% of families, respectively.
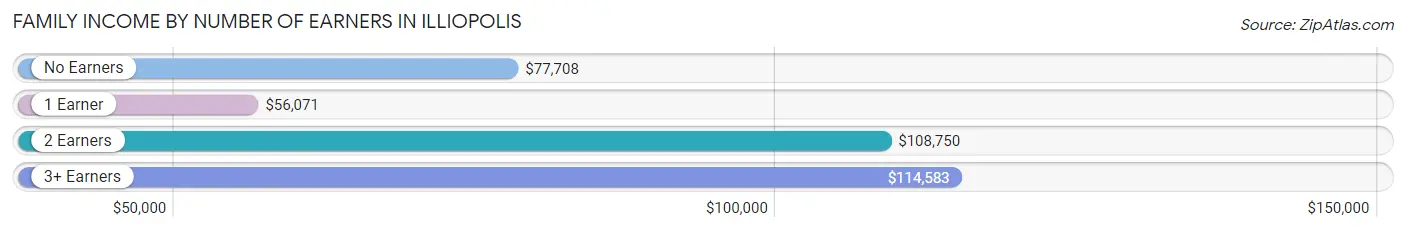
| Number of Earners | # Families | Median Income |
| No Earners | 17 (7.7%) | $77,708 |
| 1 Earner | 82 (37.3%) | $56,071 |
| 2 Earners | 102 (46.4%) | $108,750 |
| 3+ Earners | 19 (8.6%) | $114,583 |
| Total | 220 (100.0%) | $90,000 |
Household Income in Illiopolis
Household Income Brackets in Illiopolis
With 84 households falling in the category, the $100,000 to $149,999 income range is the most frequent in Illiopolis, accounting for 25.4% of all households. In contrast, only 4 households (1.2%) fall into the $200,000+ income bracket, making it the least populous group.
| Income Bracket | # Households | % Households |
| Less than $10,000 | 17 | 5.1% |
| $10,000 to $14,999 | 12 | 3.6% |
| $15,000 to $24,999 | 26 | 7.9% |
| $25,000 to $34,999 | 28 | 8.5% |
| $35,000 to $49,999 | 32 | 9.7% |
| $50,000 to $74,999 | 45 | 13.6% |
| $75,000 to $99,999 | 65 | 19.6% |
| $100,000 to $149,999 | 84 | 25.4% |
| $150,000 to $199,999 | 18 | 5.4% |
| $200,000+ | 4 | 1.2% |
Household Income by Householder Age in Illiopolis
The median household income in Illiopolis is $77,292, with the highest median household income of $96,667 found in the 45 to 64 years age bracket for the primary householder. A total of 134 households (40.5%) fall into this category. Meanwhile, the 15 to 24 years age bracket for the primary householder has the lowest median household income of $0, with 8 households (2.4%) in this group.
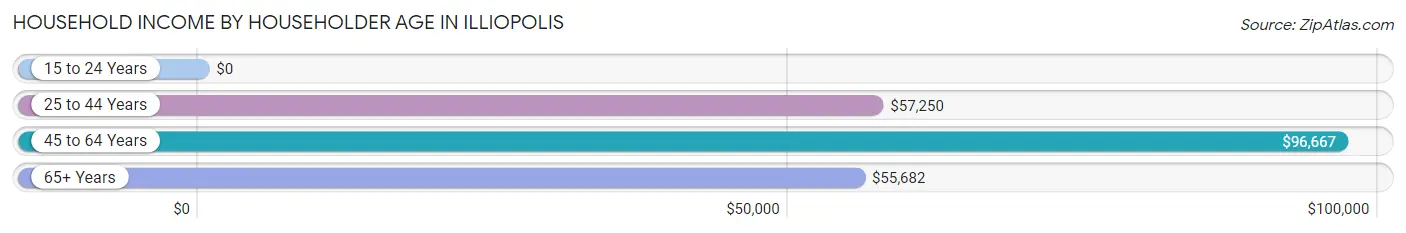
| Income Bracket | # Households | Median Income |
| 15 to 24 Years | 8 (2.4%) | $0 |
| 25 to 44 Years | 99 (29.9%) | $57,250 |
| 45 to 64 Years | 134 (40.5%) | $96,667 |
| 65+ Years | 90 (27.2%) | $55,682 |
| Total | 331 (100.0%) | $77,292 |
Poverty in Illiopolis
Income Below Poverty by Sex and Age in Illiopolis
With 10.2% poverty level for males and 6.7% for females among the residents of Illiopolis, 25 to 34 year old males and 18 to 24 year old females are the most vulnerable to poverty, with 16 males (36.4%) and 10 females (25.6%) in their respective age groups living below the poverty level.
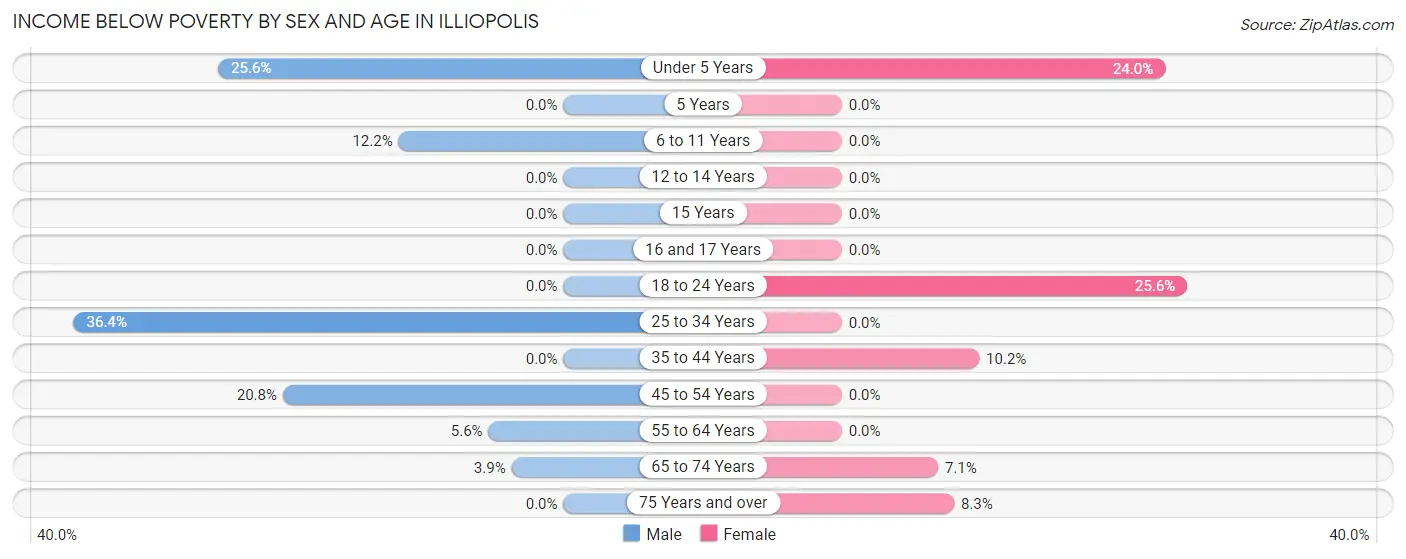
| Age Bracket | Male | Female |
| Under 5 Years | 10 (25.6%) | 6 (24.0%) |
| 5 Years | 0 (0.0%) | 0 (0.0%) |
| 6 to 11 Years | 6 (12.2%) | 0 (0.0%) |
| 12 to 14 Years | 0 (0.0%) | 0 (0.0%) |
| 15 Years | 0 (0.0%) | 0 (0.0%) |
| 16 and 17 Years | 0 (0.0%) | 0 (0.0%) |
| 18 to 24 Years | 0 (0.0%) | 10 (25.6%) |
| 25 to 34 Years | 16 (36.4%) | 0 (0.0%) |
| 35 to 44 Years | 0 (0.0%) | 5 (10.2%) |
| 45 to 54 Years | 5 (20.8%) | 0 (0.0%) |
| 55 to 64 Years | 5 (5.6%) | 0 (0.0%) |
| 65 to 74 Years | 2 (3.8%) | 2 (7.1%) |
| 75 Years and over | 0 (0.0%) | 3 (8.3%) |
| Total | 44 (10.2%) | 26 (6.7%) |
Income Above Poverty by Sex and Age in Illiopolis
According to the poverty statistics in Illiopolis, males aged 5 years and females aged 5 years are the age groups that are most secure financially, with 100.0% of males and 100.0% of females in these age groups living above the poverty line.
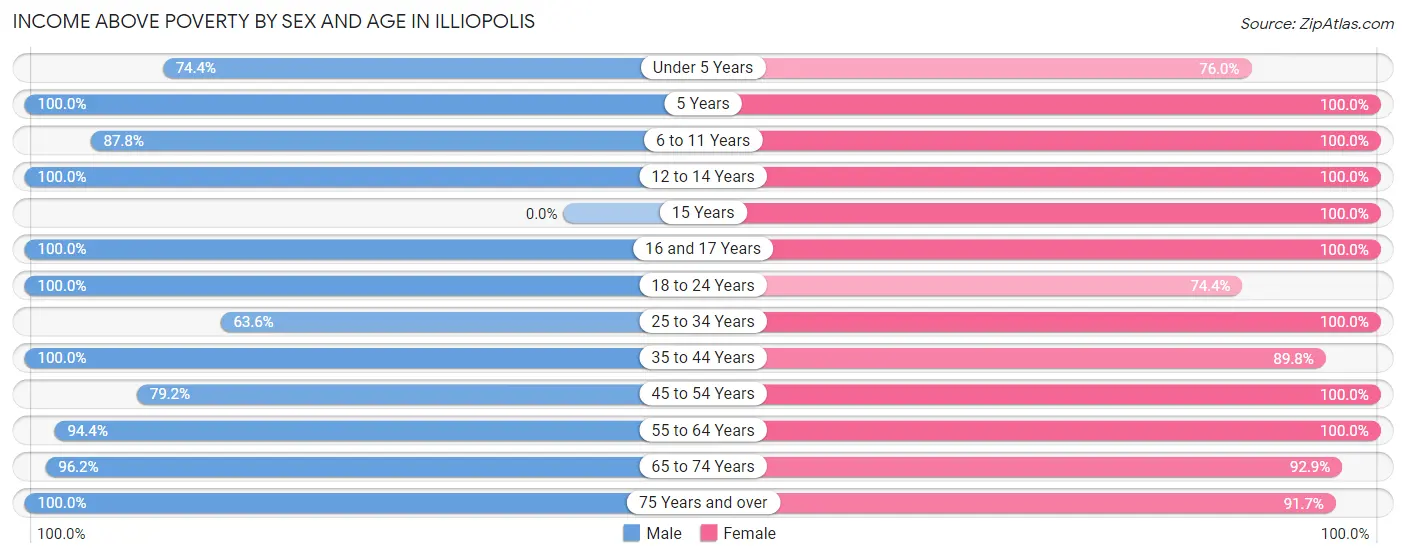
| Age Bracket | Male | Female |
| Under 5 Years | 29 (74.4%) | 19 (76.0%) |
| 5 Years | 3 (100.0%) | 5 (100.0%) |
| 6 to 11 Years | 43 (87.8%) | 21 (100.0%) |
| 12 to 14 Years | 27 (100.0%) | 20 (100.0%) |
| 15 Years | 0 (0.0%) | 7 (100.0%) |
| 16 and 17 Years | 13 (100.0%) | 8 (100.0%) |
| 18 to 24 Years | 11 (100.0%) | 29 (74.4%) |
| 25 to 34 Years | 28 (63.6%) | 27 (100.0%) |
| 35 to 44 Years | 61 (100.0%) | 44 (89.8%) |
| 45 to 54 Years | 19 (79.2%) | 43 (100.0%) |
| 55 to 64 Years | 85 (94.4%) | 81 (100.0%) |
| 65 to 74 Years | 50 (96.2%) | 26 (92.9%) |
| 75 Years and over | 20 (100.0%) | 33 (91.7%) |
| Total | 389 (89.8%) | 363 (93.3%) |
Income Below Poverty Among Married-Couple Families in Illiopolis
The poverty statistics for married-couple families in Illiopolis show that 4.6% or 8 of the total 175 families live below the poverty line. Families with 3 or 4 children have the highest poverty rate of 28.6%, comprising of 6 families. On the other hand, families with 1 or 2 children have the lowest poverty rate of 0.0%, which includes 0 families.
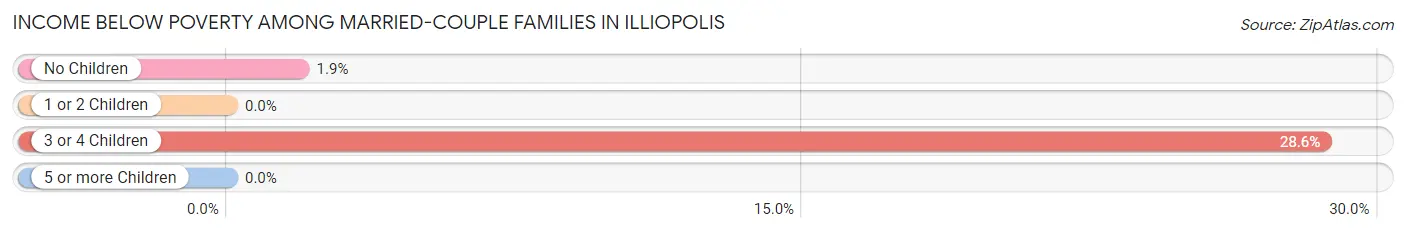
| Children | Above Poverty | Below Poverty |
| No Children | 105 (98.1%) | 2 (1.9%) |
| 1 or 2 Children | 45 (100.0%) | 0 (0.0%) |
| 3 or 4 Children | 15 (71.4%) | 6 (28.6%) |
| 5 or more Children | 2 (100.0%) | 0 (0.0%) |
| Total | 167 (95.4%) | 8 (4.6%) |
Income Below Poverty Among Single-Parent Households in Illiopolis
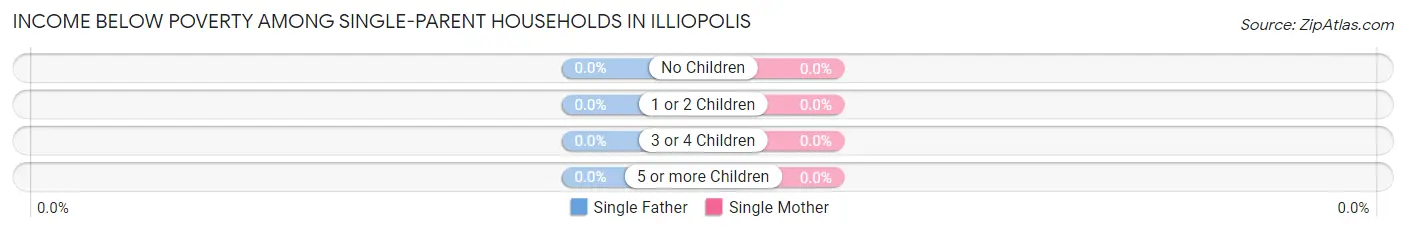
| Children | Single Father | Single Mother |
| No Children | 0 (0.0%) | 0 (0.0%) |
| 1 or 2 Children | 0 (0.0%) | 0 (0.0%) |
| 3 or 4 Children | 0 (0.0%) | 0 (0.0%) |
| 5 or more Children | 0 (0.0%) | 0 (0.0%) |
| Total | 0 (0.0%) | 0 (0.0%) |
Income Below Poverty Among Married-Couple vs Single-Parent Households in Illiopolis
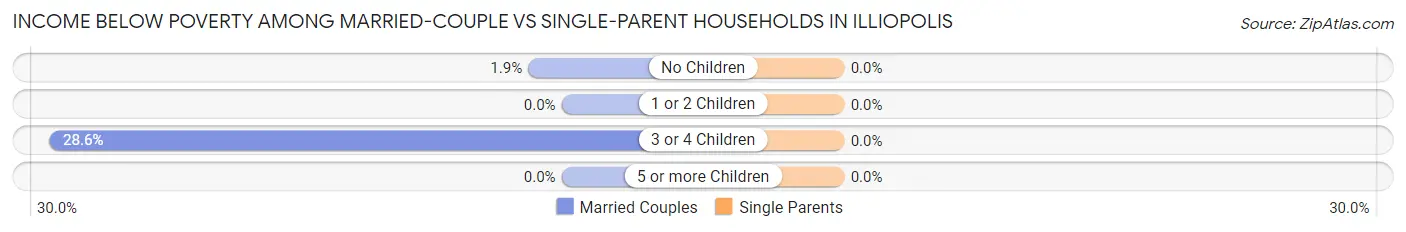
| Children | Married-Couple Families | Single-Parent Households |
| No Children | 2 (1.9%) | 0 (0.0%) |
| 1 or 2 Children | 0 (0.0%) | 0 (0.0%) |
| 3 or 4 Children | 6 (28.6%) | 0 (0.0%) |
| 5 or more Children | 0 (0.0%) | 0 (0.0%) |
| Total | 8 (4.6%) | 0 (0.0%) |
Employment Characteristics in Illiopolis
Employment by Class of Employer in Illiopolis
Among the 380 employed individuals in Illiopolis, private company employees (256 | 67.4%), state government employees (41 | 10.8%), and local government employees (35 | 9.2%) make up the most common classes of employment.
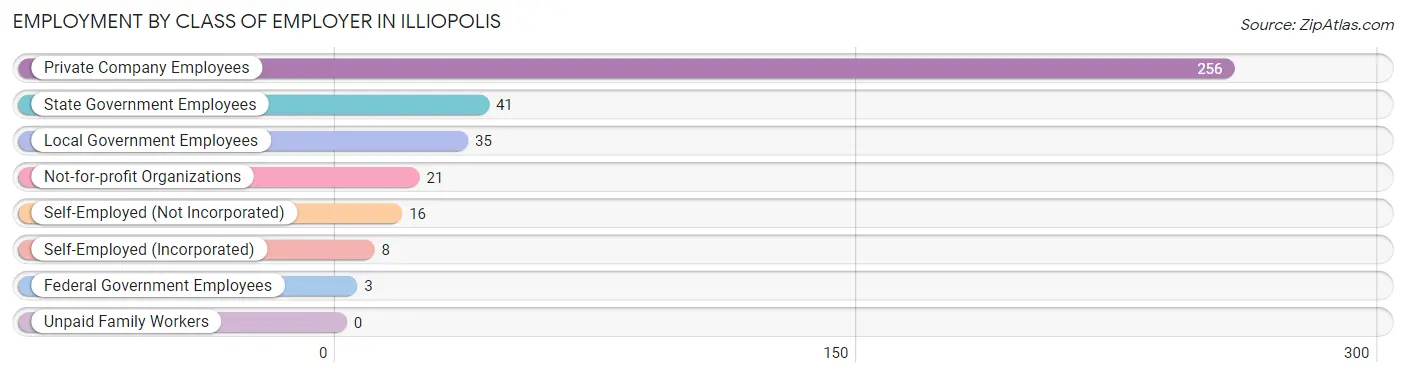
| Employer Class | # Employees | % Employees |
| Private Company Employees | 256 | 67.4% |
| Self-Employed (Incorporated) | 8 | 2.1% |
| Self-Employed (Not Incorporated) | 16 | 4.2% |
| Not-for-profit Organizations | 21 | 5.5% |
| Local Government Employees | 35 | 9.2% |
| State Government Employees | 41 | 10.8% |
| Federal Government Employees | 3 | 0.8% |
| Unpaid Family Workers | 0 | 0.0% |
| Total | 380 | 100.0% |
Employment Status by Age in Illiopolis
According to the labor force statistics for Illiopolis, out of the total population over 16 years of age (626), 63.9% or 400 individuals are in the labor force, with 2.5% or 10 of them unemployed. The age group with the highest labor force participation rate is 30 to 34 years, with 93.8% or 30 individuals in the labor force. Within the labor force, the 20 to 24 years age range has the highest percentage of unemployed individuals, with 17.9% or 5 of them being unemployed.
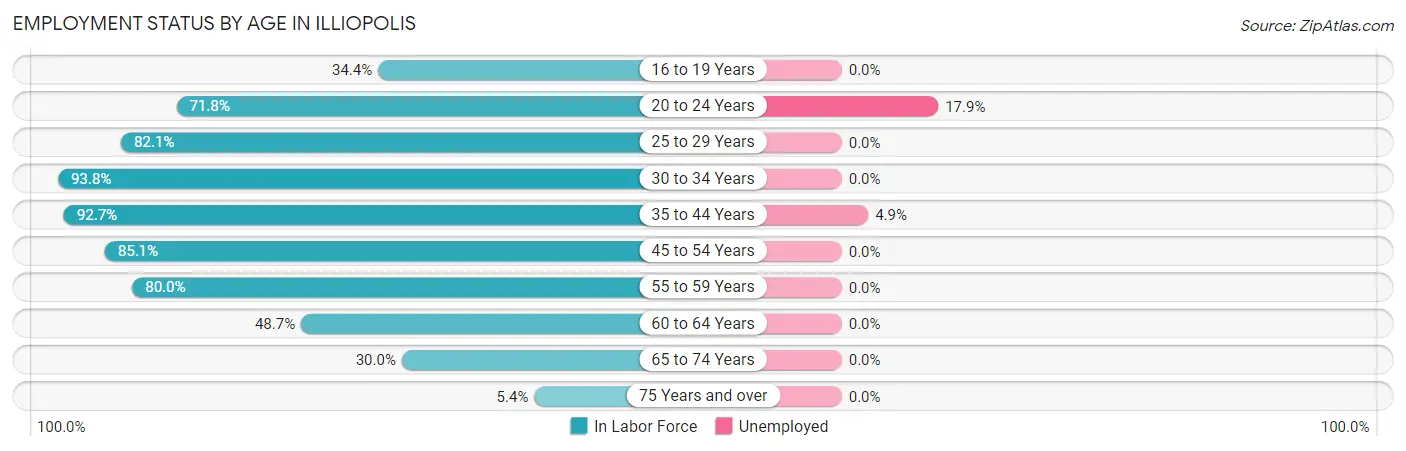
| Age Bracket | In Labor Force | Unemployed |
| 16 to 19 Years | 11 (34.4%) | 0 (0.0%) |
| 20 to 24 Years | 28 (71.8%) | 5 (17.9%) |
| 25 to 29 Years | 32 (82.1%) | 0 (0.0%) |
| 30 to 34 Years | 30 (93.8%) | 0 (0.0%) |
| 35 to 44 Years | 102 (92.7%) | 5 (4.9%) |
| 45 to 54 Years | 57 (85.1%) | 0 (0.0%) |
| 55 to 59 Years | 76 (80.0%) | 0 (0.0%) |
| 60 to 64 Years | 37 (48.7%) | 0 (0.0%) |
| 65 to 74 Years | 24 (30.0%) | 0 (0.0%) |
| 75 Years and over | 3 (5.4%) | 0 (0.0%) |
| Total | 400 (63.9%) | 10 (2.5%) |
Employment Status by Educational Attainment in Illiopolis
According to labor force statistics for Illiopolis, 79.7% of individuals (334) out of the total population between 25 and 64 years of age (419) are in the labor force, with 1.5% or 5 of them being unemployed. The group with the highest labor force participation rate are those with the educational attainment of bachelor's degree or higher, with 87.0% or 67 individuals in the labor force. Within the labor force, individuals with less than high school education have the highest percentage of unemployment, with 17.6% or 3 of them being unemployed.
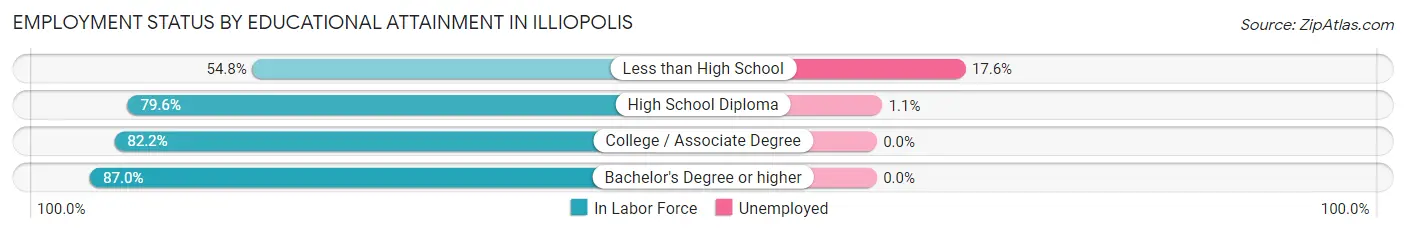
| Educational Attainment | In Labor Force | Unemployed |
| Less than High School | 17 (54.8%) | 5 (17.6%) |
| High School Diploma | 176 (79.6%) | 2 (1.1%) |
| College / Associate Degree | 74 (82.2%) | 0 (0.0%) |
| Bachelor's Degree or higher | 67 (87.0%) | 0 (0.0%) |
| Total | 334 (79.7%) | 6 (1.5%) |
Employment Occupations by Sex in Illiopolis
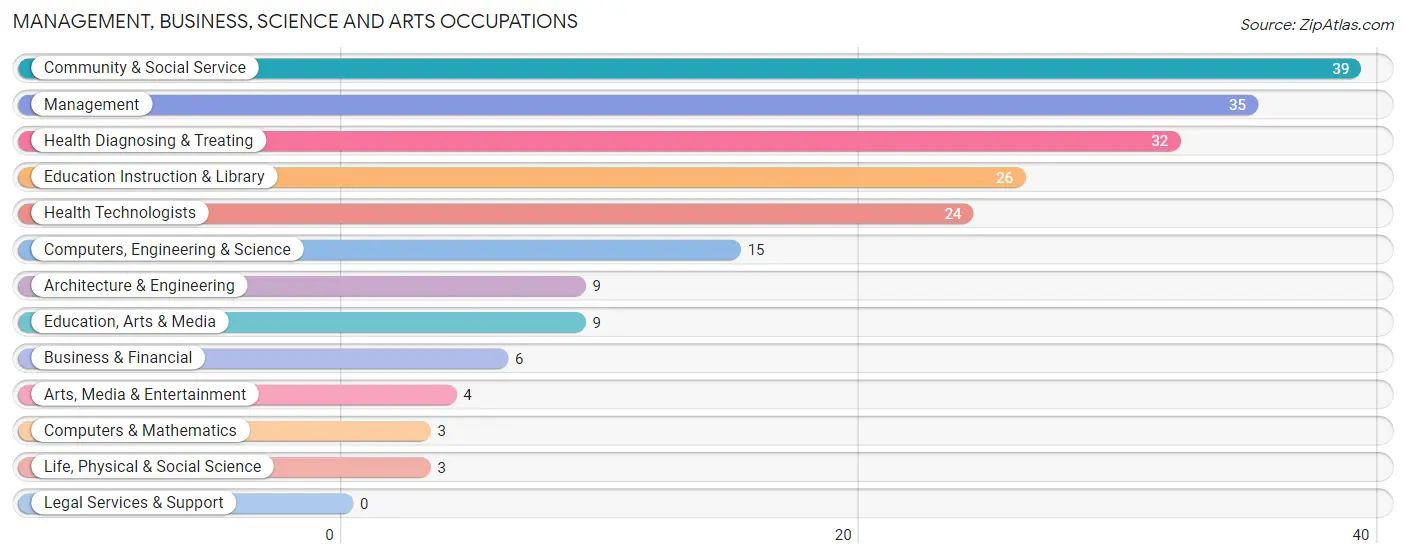
Management, Business, Science and Arts Occupations
The most common Management, Business, Science and Arts occupations in Illiopolis are Community & Social Service (39 | 10.0%), Management (35 | 9.0%), Health Diagnosing & Treating (32 | 8.2%), Education Instruction & Library (26 | 6.7%), and Health Technologists (24 | 6.1%).
Management, Business, Science and Arts Occupations by Sex
Within the Management, Business, Science and Arts occupations in Illiopolis, the most male-oriented occupations are Computers & Mathematics (100.0%), Life, Physical & Social Science (100.0%), and Management (77.1%), while the most female-oriented occupations are Business & Financial (100.0%), Education Instruction & Library (100.0%), and Community & Social Service (84.6%).
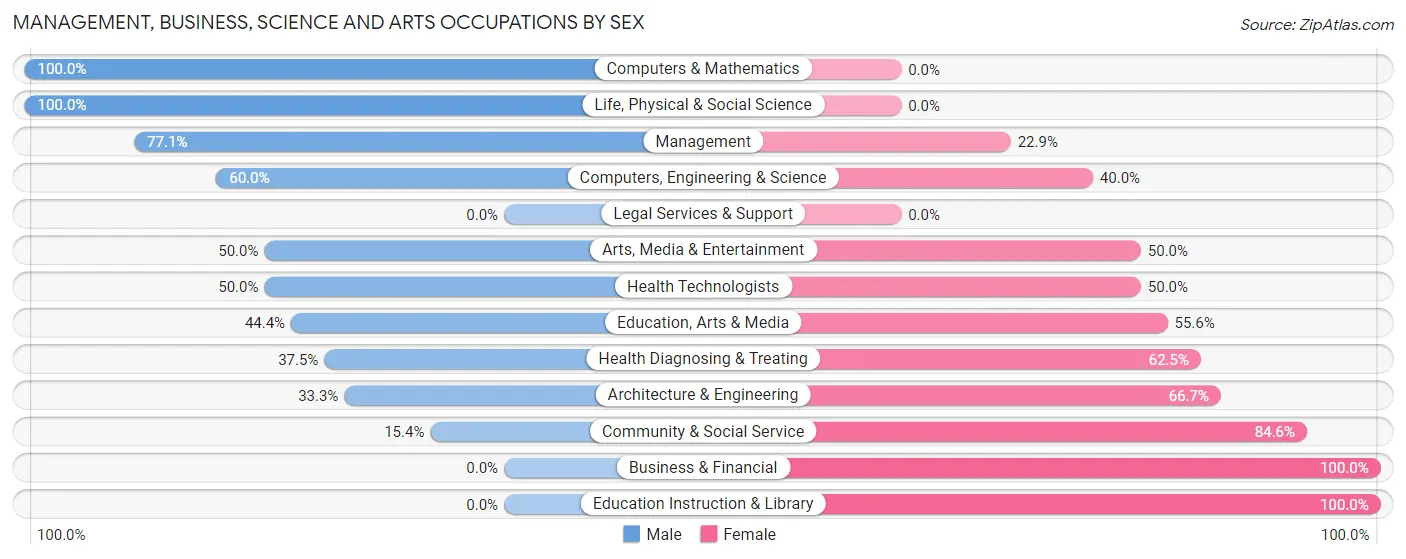
| Occupation | Male | Female |
| Management | 27 (77.1%) | 8 (22.9%) |
| Business & Financial | 0 (0.0%) | 6 (100.0%) |
| Computers, Engineering & Science | 9 (60.0%) | 6 (40.0%) |
| Computers & Mathematics | 3 (100.0%) | 0 (0.0%) |
| Architecture & Engineering | 3 (33.3%) | 6 (66.7%) |
| Life, Physical & Social Science | 3 (100.0%) | 0 (0.0%) |
| Community & Social Service | 6 (15.4%) | 33 (84.6%) |
| Education, Arts & Media | 4 (44.4%) | 5 (55.6%) |
| Legal Services & Support | 0 (0.0%) | 0 (0.0%) |
| Education Instruction & Library | 0 (0.0%) | 26 (100.0%) |
| Arts, Media & Entertainment | 2 (50.0%) | 2 (50.0%) |
| Health Diagnosing & Treating | 12 (37.5%) | 20 (62.5%) |
| Health Technologists | 12 (50.0%) | 12 (50.0%) |
| Total (Category) | 54 (42.5%) | 73 (57.5%) |
| Total (Overall) | 201 (51.5%) | 189 (48.5%) |
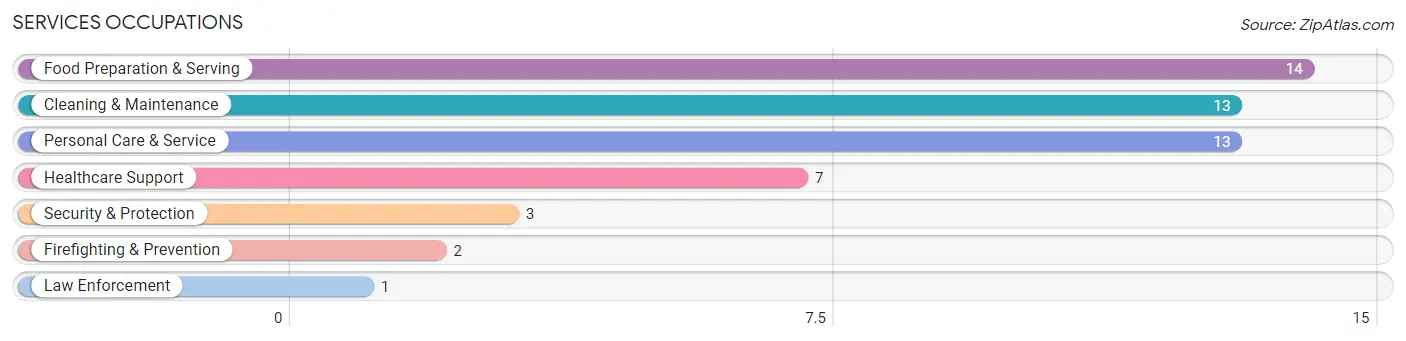
Services Occupations
The most common Services occupations in Illiopolis are Food Preparation & Serving (14 | 3.6%), Cleaning & Maintenance (13 | 3.3%), Personal Care & Service (13 | 3.3%), Healthcare Support (7 | 1.8%), and Security & Protection (3 | 0.8%).
Services Occupations by Sex
Within the Services occupations in Illiopolis, the most male-oriented occupations are Firefighting & Prevention (100.0%), Security & Protection (66.7%), and Food Preparation & Serving (57.1%), while the most female-oriented occupations are Healthcare Support (100.0%), Law Enforcement (100.0%), and Personal Care & Service (100.0%).
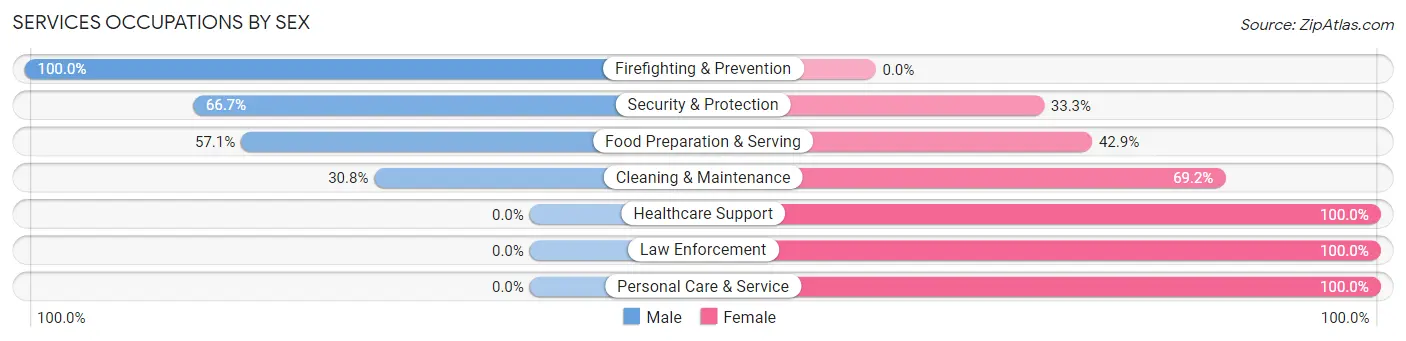
| Occupation | Male | Female |
| Healthcare Support | 0 (0.0%) | 7 (100.0%) |
| Security & Protection | 2 (66.7%) | 1 (33.3%) |
| Firefighting & Prevention | 2 (100.0%) | 0 (0.0%) |
| Law Enforcement | 0 (0.0%) | 1 (100.0%) |
| Food Preparation & Serving | 8 (57.1%) | 6 (42.9%) |
| Cleaning & Maintenance | 4 (30.8%) | 9 (69.2%) |
| Personal Care & Service | 0 (0.0%) | 13 (100.0%) |
| Total (Category) | 14 (28.0%) | 36 (72.0%) |
| Total (Overall) | 201 (51.5%) | 189 (48.5%) |
Sales and Office Occupations
The most common Sales and Office occupations in Illiopolis are Office & Administration (56 | 14.4%), and Sales & Related (34 | 8.7%).

Sales and Office Occupations by Sex
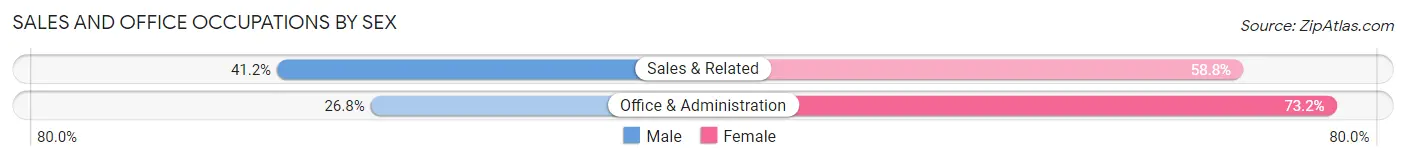
| Occupation | Male | Female |
| Sales & Related | 14 (41.2%) | 20 (58.8%) |
| Office & Administration | 15 (26.8%) | 41 (73.2%) |
| Total (Category) | 29 (32.2%) | 61 (67.8%) |
| Total (Overall) | 201 (51.5%) | 189 (48.5%) |
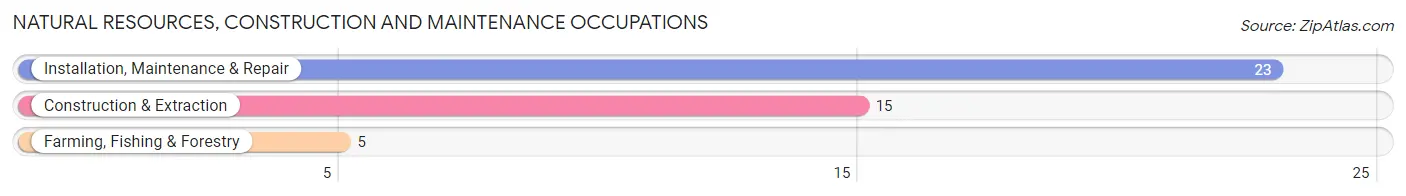
Natural Resources, Construction and Maintenance Occupations
The most common Natural Resources, Construction and Maintenance occupations in Illiopolis are Installation, Maintenance & Repair (23 | 5.9%), Construction & Extraction (15 | 3.8%), and Farming, Fishing & Forestry (5 | 1.3%).
Natural Resources, Construction and Maintenance Occupations by Sex

| Occupation | Male | Female |
| Farming, Fishing & Forestry | 5 (100.0%) | 0 (0.0%) |
| Construction & Extraction | 15 (100.0%) | 0 (0.0%) |
| Installation, Maintenance & Repair | 23 (100.0%) | 0 (0.0%) |
| Total (Category) | 43 (100.0%) | 0 (0.0%) |
| Total (Overall) | 201 (51.5%) | 189 (48.5%) |
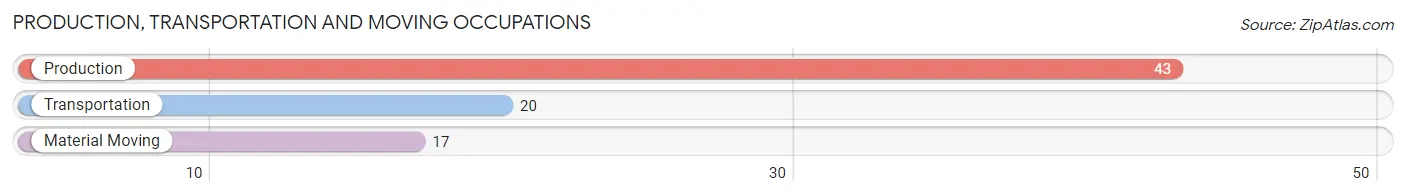
Production, Transportation and Moving Occupations
The most common Production, Transportation and Moving occupations in Illiopolis are Production (43 | 11.0%), Transportation (20 | 5.1%), and Material Moving (17 | 4.4%).
Production, Transportation and Moving Occupations by Sex
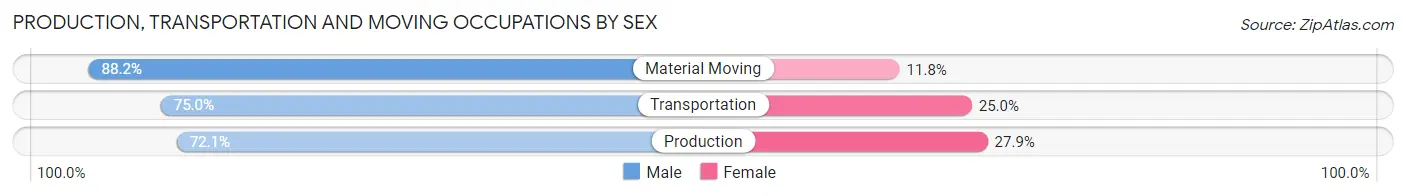
| Occupation | Male | Female |
| Production | 31 (72.1%) | 12 (27.9%) |
| Transportation | 15 (75.0%) | 5 (25.0%) |
| Material Moving | 15 (88.2%) | 2 (11.8%) |
| Total (Category) | 61 (76.2%) | 19 (23.7%) |
| Total (Overall) | 201 (51.5%) | 189 (48.5%) |
Employment Industries by Sex in Illiopolis
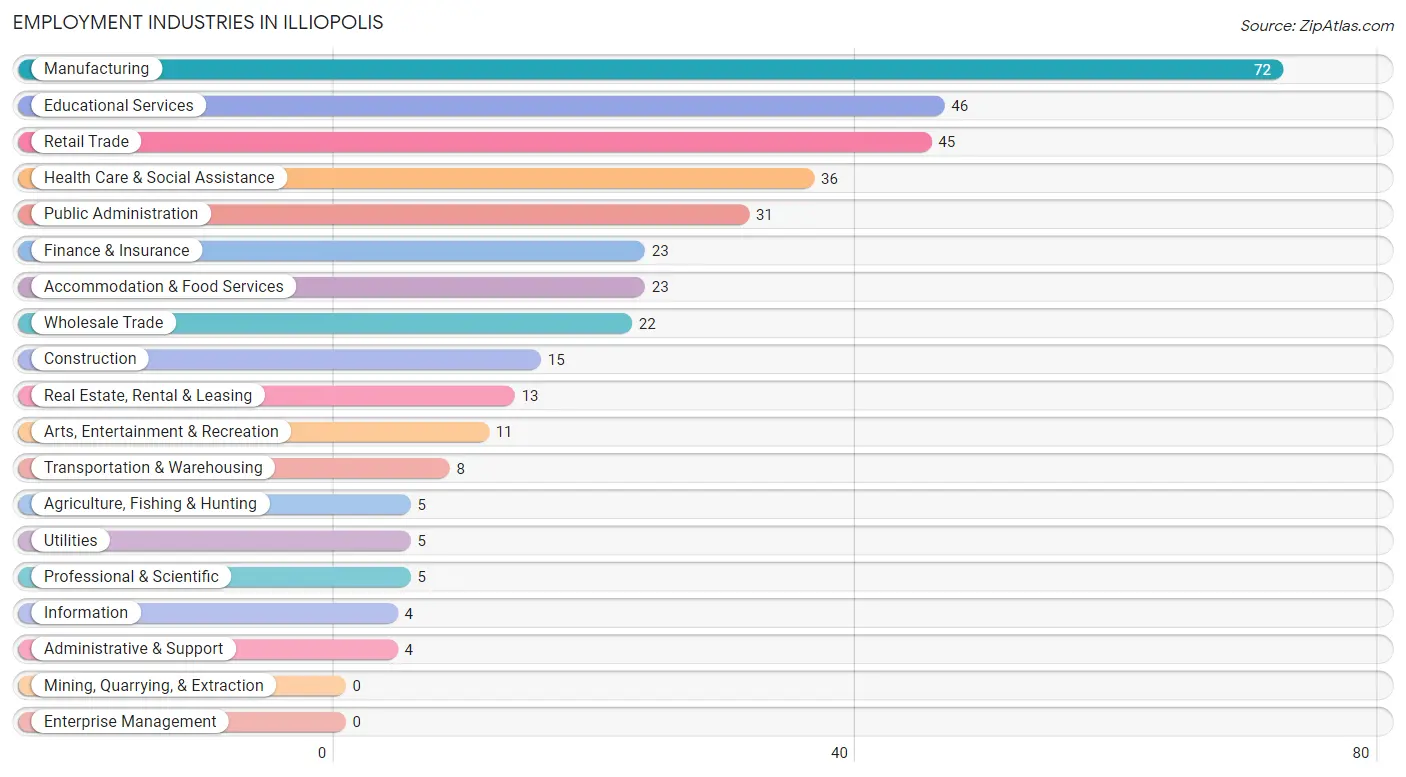
Employment Industries in Illiopolis
The major employment industries in Illiopolis include Manufacturing (72 | 18.5%), Educational Services (46 | 11.8%), Retail Trade (45 | 11.5%), Health Care & Social Assistance (36 | 9.2%), and Public Administration (31 | 8.0%).
Employment Industries by Sex in Illiopolis
The Illiopolis industries that see more men than women are Agriculture, Fishing & Hunting (100.0%), Construction (100.0%), and Wholesale Trade (100.0%), whereas the industries that tend to have a higher number of women are Health Care & Social Assistance (94.4%), Educational Services (89.1%), and Finance & Insurance (87.0%).
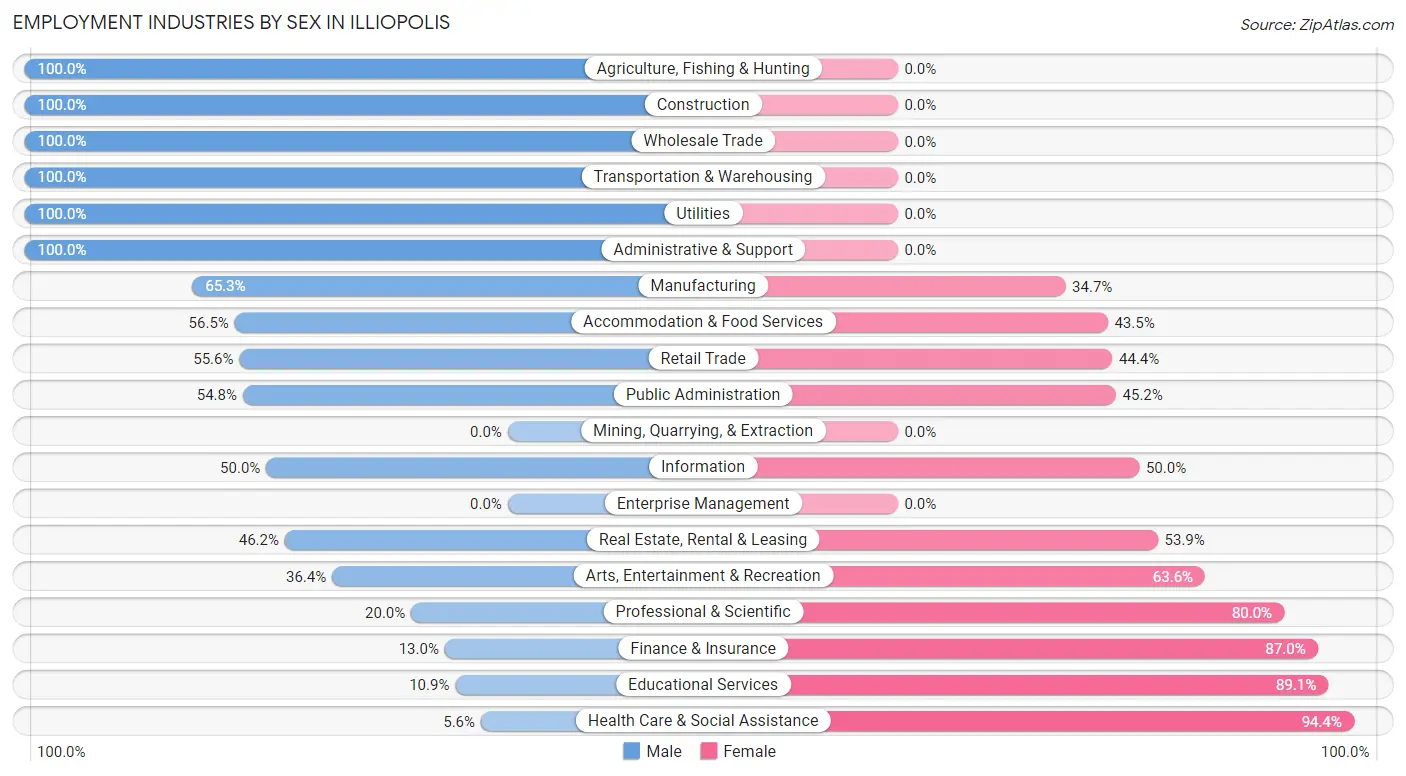
| Industry | Male | Female |
| Agriculture, Fishing & Hunting | 5 (100.0%) | 0 (0.0%) |
| Mining, Quarrying, & Extraction | 0 (0.0%) | 0 (0.0%) |
| Construction | 15 (100.0%) | 0 (0.0%) |
| Manufacturing | 47 (65.3%) | 25 (34.7%) |
| Wholesale Trade | 22 (100.0%) | 0 (0.0%) |
| Retail Trade | 25 (55.6%) | 20 (44.4%) |
| Transportation & Warehousing | 8 (100.0%) | 0 (0.0%) |
| Utilities | 5 (100.0%) | 0 (0.0%) |
| Information | 2 (50.0%) | 2 (50.0%) |
| Finance & Insurance | 3 (13.0%) | 20 (87.0%) |
| Real Estate, Rental & Leasing | 6 (46.2%) | 7 (53.8%) |
| Professional & Scientific | 1 (20.0%) | 4 (80.0%) |
| Enterprise Management | 0 (0.0%) | 0 (0.0%) |
| Administrative & Support | 4 (100.0%) | 0 (0.0%) |
| Educational Services | 5 (10.9%) | 41 (89.1%) |
| Health Care & Social Assistance | 2 (5.6%) | 34 (94.4%) |
| Arts, Entertainment & Recreation | 4 (36.4%) | 7 (63.6%) |
| Accommodation & Food Services | 13 (56.5%) | 10 (43.5%) |
| Public Administration | 17 (54.8%) | 14 (45.2%) |
| Total | 201 (51.5%) | 189 (48.5%) |
Education in Illiopolis
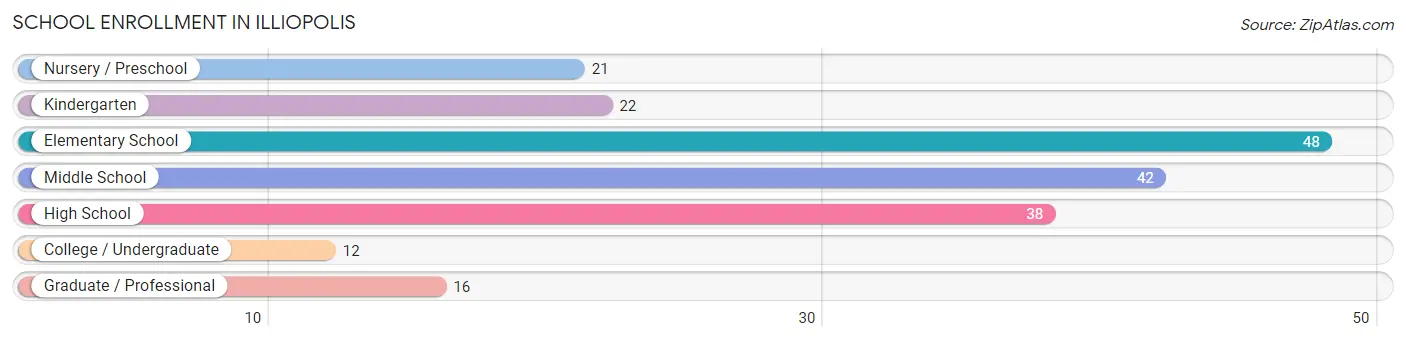
School Enrollment in Illiopolis
The most common levels of schooling among the 199 students in Illiopolis are elementary school (48 | 24.1%), middle school (42 | 21.1%), and high school (38 | 19.1%).
| School Level | # Students | % Students |
| Nursery / Preschool | 21 | 10.5% |
| Kindergarten | 22 | 11.1% |
| Elementary School | 48 | 24.1% |
| Middle School | 42 | 21.1% |
| High School | 38 | 19.1% |
| College / Undergraduate | 12 | 6.0% |
| Graduate / Professional | 16 | 8.0% |
| Total | 199 | 100.0% |
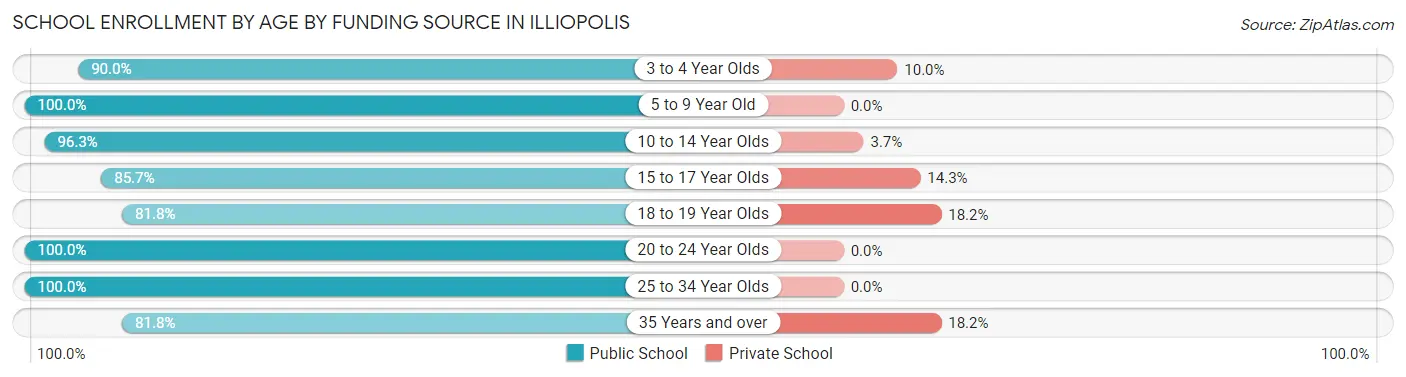
School Enrollment by Age by Funding Source in Illiopolis
Out of a total of 199 students who are enrolled in schools in Illiopolis, 14 (7.0%) attend a private institution, while the remaining 185 (93.0%) are enrolled in public schools. The age group of 18 to 19 year olds has the highest likelihood of being enrolled in private schools, with 2 (18.2% in the age bracket) enrolled. Conversely, the age group of 5 to 9 year old has the lowest likelihood of being enrolled in a private school, with 59 (100.0% in the age bracket) attending a public institution.
| Age Bracket | Public School | Private School |
| 3 to 4 Year Olds | 18 (90.0%) | 2 (10.0%) |
| 5 to 9 Year Old | 59 (100.0%) | 0 (0.0%) |
| 10 to 14 Year Olds | 52 (96.3%) | 2 (3.7%) |
| 15 to 17 Year Olds | 24 (85.7%) | 4 (14.3%) |
| 18 to 19 Year Olds | 9 (81.8%) | 2 (18.2%) |
| 20 to 24 Year Olds | 3 (100.0%) | 0 (0.0%) |
| 25 to 34 Year Olds | 2 (100.0%) | 0 (0.0%) |
| 35 Years and over | 18 (81.8%) | 4 (18.2%) |
| Total | 185 (93.0%) | 14 (7.0%) |
Educational Attainment by Field of Study in Illiopolis
Education (20 | 19.4%), arts & humanities (20 | 19.4%), bio, nature & agricultural (17 | 16.5%), science & technology (11 | 10.7%), and business (9 | 8.7%) are the most common fields of study among 103 individuals in Illiopolis who have obtained a bachelor's degree or higher.
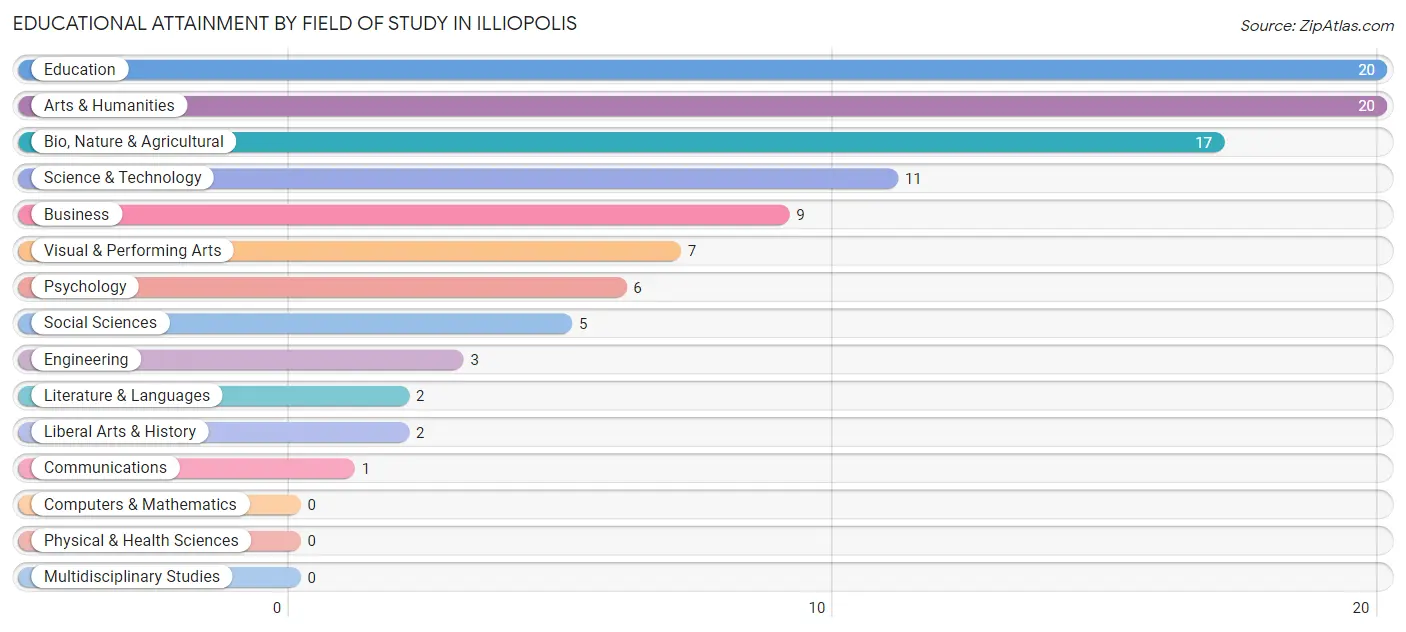
| Field of Study | # Graduates | % Graduates |
| Computers & Mathematics | 0 | 0.0% |
| Bio, Nature & Agricultural | 17 | 16.5% |
| Physical & Health Sciences | 0 | 0.0% |
| Psychology | 6 | 5.8% |
| Social Sciences | 5 | 4.9% |
| Engineering | 3 | 2.9% |
| Multidisciplinary Studies | 0 | 0.0% |
| Science & Technology | 11 | 10.7% |
| Business | 9 | 8.7% |
| Education | 20 | 19.4% |
| Literature & Languages | 2 | 1.9% |
| Liberal Arts & History | 2 | 1.9% |
| Visual & Performing Arts | 7 | 6.8% |
| Communications | 1 | 1.0% |
| Arts & Humanities | 20 | 19.4% |
| Total | 103 | 100.0% |
Transportation & Commute in Illiopolis
Vehicle Availability by Sex in Illiopolis
The most prevalent vehicle ownership categories in Illiopolis are males with 2 vehicles (77, accounting for 38.3%) and females with 2 vehicles (62, making up 43.0%).
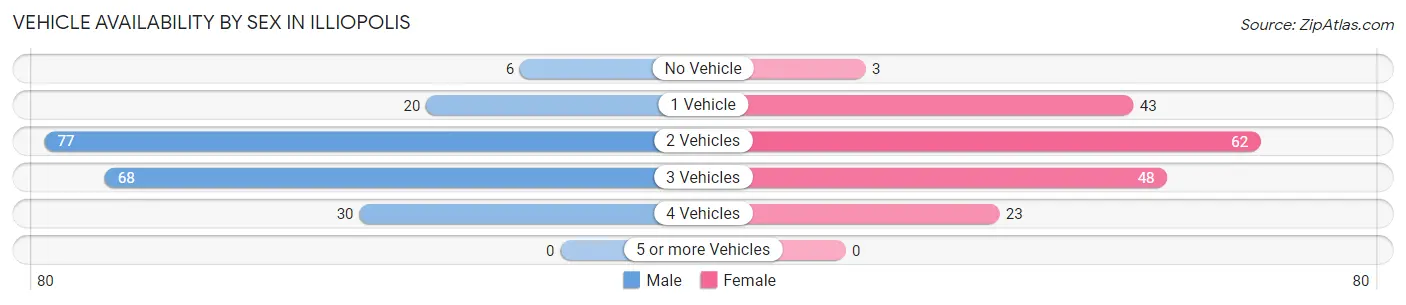
| Vehicles Available | Male | Female |
| No Vehicle | 6 (3.0%) | 3 (1.7%) |
| 1 Vehicle | 20 (10.0%) | 43 (24.0%) |
| 2 Vehicles | 77 (38.3%) | 62 (34.6%) |
| 3 Vehicles | 68 (33.8%) | 48 (26.8%) |
| 4 Vehicles | 30 (14.9%) | 23 (12.9%) |
| 5 or more Vehicles | 0 (0.0%) | 0 (0.0%) |
| Total | 201 (100.0%) | 179 (100.0%) |
Commute Time in Illiopolis
The most frequently occuring commute durations in Illiopolis are 30 to 34 minutes (76 commuters, 21.5%), 25 to 29 minutes (57 commuters, 16.1%), and 35 to 39 minutes (55 commuters, 15.5%).
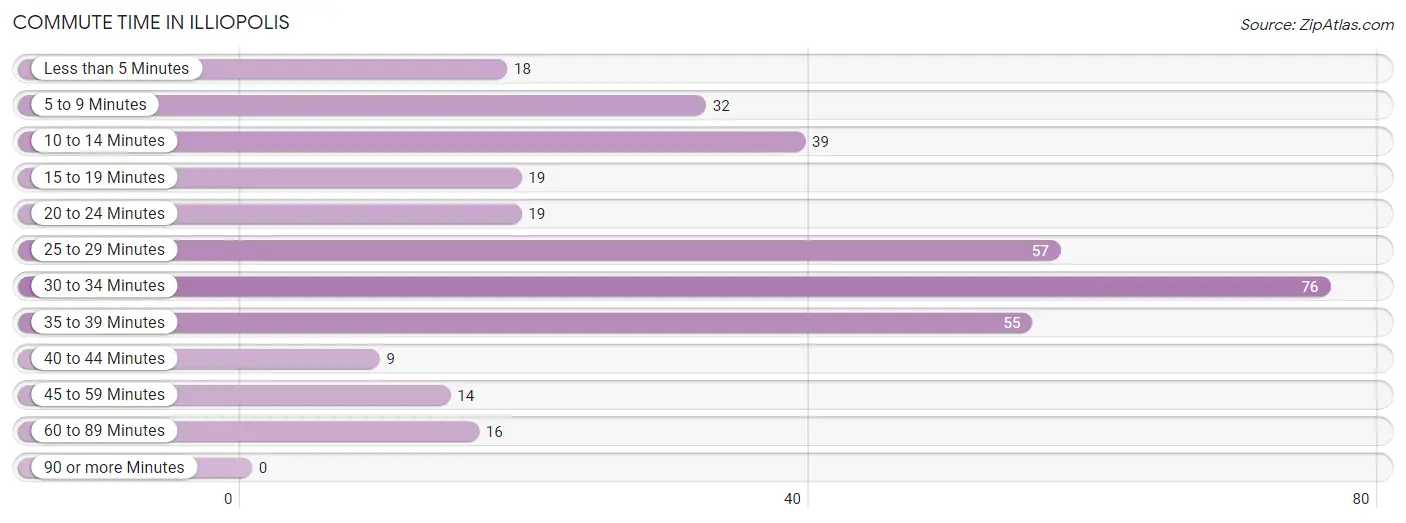
| Commute Time | # Commuters | % Commuters |
| Less than 5 Minutes | 18 | 5.1% |
| 5 to 9 Minutes | 32 | 9.0% |
| 10 to 14 Minutes | 39 | 11.0% |
| 15 to 19 Minutes | 19 | 5.4% |
| 20 to 24 Minutes | 19 | 5.4% |
| 25 to 29 Minutes | 57 | 16.1% |
| 30 to 34 Minutes | 76 | 21.5% |
| 35 to 39 Minutes | 55 | 15.5% |
| 40 to 44 Minutes | 9 | 2.5% |
| 45 to 59 Minutes | 14 | 4.0% |
| 60 to 89 Minutes | 16 | 4.5% |
| 90 or more Minutes | 0 | 0.0% |
Commute Time by Sex in Illiopolis
The most common commute times in Illiopolis are 30 to 34 minutes (44 commuters, 22.1%) for males and 35 to 39 minutes (34 commuters, 21.9%) for females.
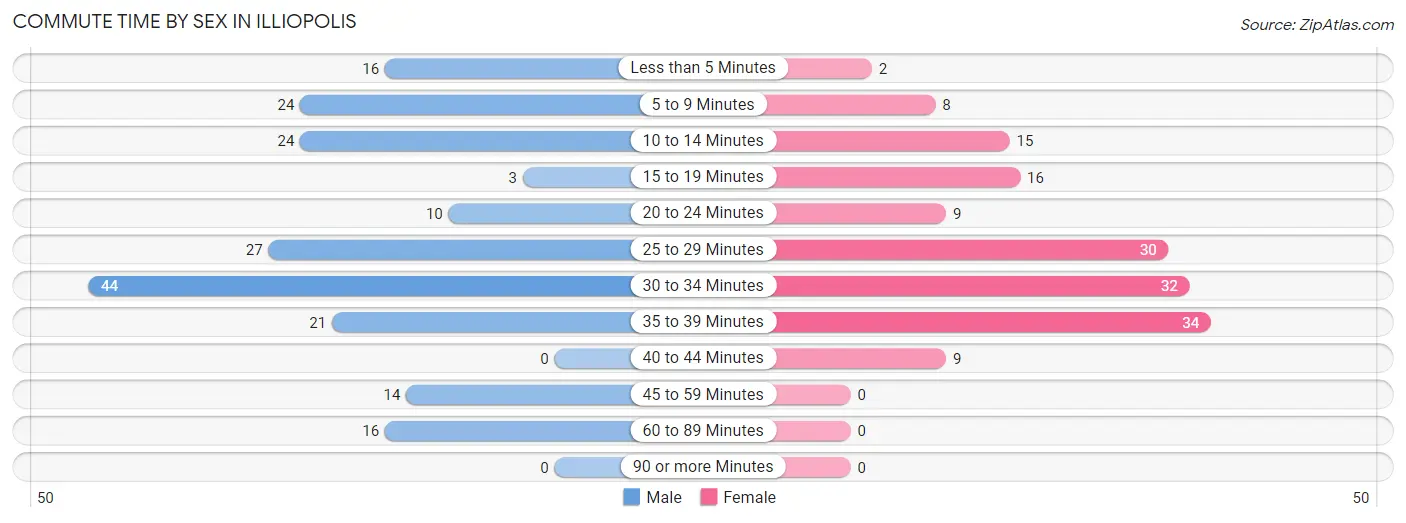
| Commute Time | Male | Female |
| Less than 5 Minutes | 16 (8.0%) | 2 (1.3%) |
| 5 to 9 Minutes | 24 (12.1%) | 8 (5.2%) |
| 10 to 14 Minutes | 24 (12.1%) | 15 (9.7%) |
| 15 to 19 Minutes | 3 (1.5%) | 16 (10.3%) |
| 20 to 24 Minutes | 10 (5.0%) | 9 (5.8%) |
| 25 to 29 Minutes | 27 (13.6%) | 30 (19.4%) |
| 30 to 34 Minutes | 44 (22.1%) | 32 (20.6%) |
| 35 to 39 Minutes | 21 (10.5%) | 34 (21.9%) |
| 40 to 44 Minutes | 0 (0.0%) | 9 (5.8%) |
| 45 to 59 Minutes | 14 (7.0%) | 0 (0.0%) |
| 60 to 89 Minutes | 16 (8.0%) | 0 (0.0%) |
| 90 or more Minutes | 0 (0.0%) | 0 (0.0%) |
Time of Departure to Work by Sex in Illiopolis
The most frequent times of departure to work in Illiopolis are 7:00 AM to 7:29 AM (37, 18.6%) for males and 7:00 AM to 7:29 AM (61, 39.4%) for females.
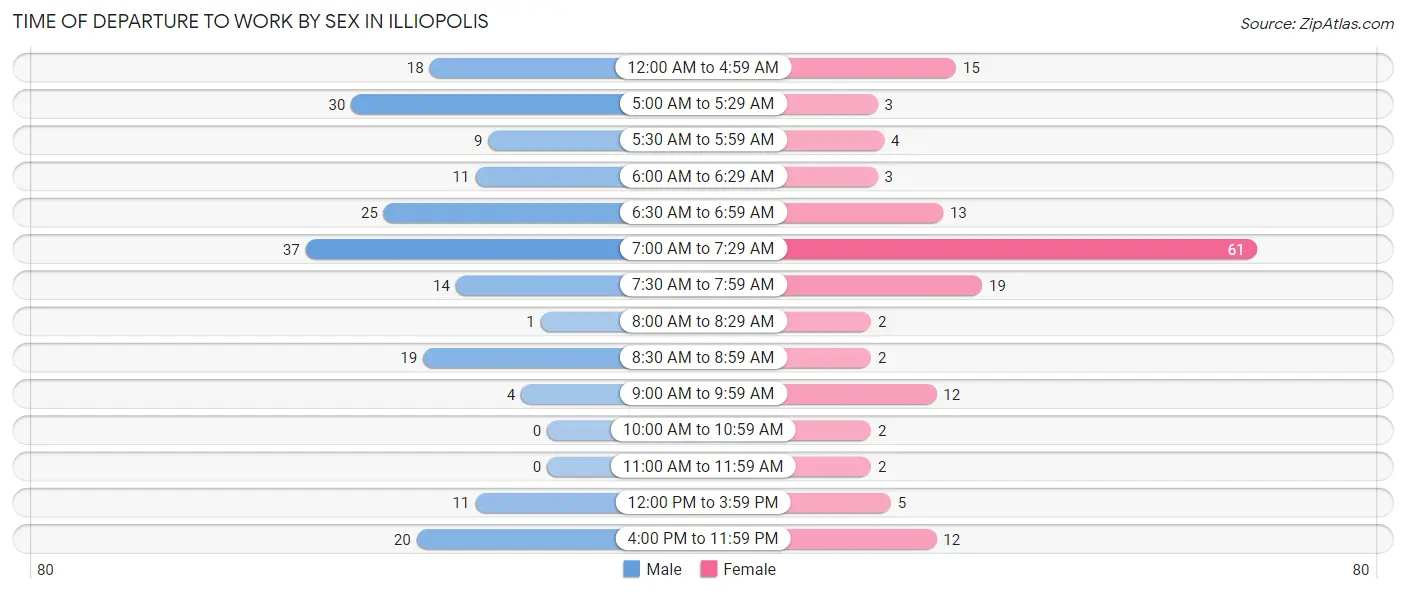
| Time of Departure | Male | Female |
| 12:00 AM to 4:59 AM | 18 (9.0%) | 15 (9.7%) |
| 5:00 AM to 5:29 AM | 30 (15.1%) | 3 (1.9%) |
| 5:30 AM to 5:59 AM | 9 (4.5%) | 4 (2.6%) |
| 6:00 AM to 6:29 AM | 11 (5.5%) | 3 (1.9%) |
| 6:30 AM to 6:59 AM | 25 (12.6%) | 13 (8.4%) |
| 7:00 AM to 7:29 AM | 37 (18.6%) | 61 (39.4%) |
| 7:30 AM to 7:59 AM | 14 (7.0%) | 19 (12.3%) |
| 8:00 AM to 8:29 AM | 1 (0.5%) | 2 (1.3%) |
| 8:30 AM to 8:59 AM | 19 (9.6%) | 2 (1.3%) |
| 9:00 AM to 9:59 AM | 4 (2.0%) | 12 (7.7%) |
| 10:00 AM to 10:59 AM | 0 (0.0%) | 2 (1.3%) |
| 11:00 AM to 11:59 AM | 0 (0.0%) | 2 (1.3%) |
| 12:00 PM to 3:59 PM | 11 (5.5%) | 5 (3.2%) |
| 4:00 PM to 11:59 PM | 20 (10.1%) | 12 (7.7%) |
| Total | 199 (100.0%) | 155 (100.0%) |
Housing Occupancy in Illiopolis
Occupancy by Ownership in Illiopolis
Of the total 331 dwellings in Illiopolis, owner-occupied units account for 251 (75.8%), while renter-occupied units make up 80 (24.2%).
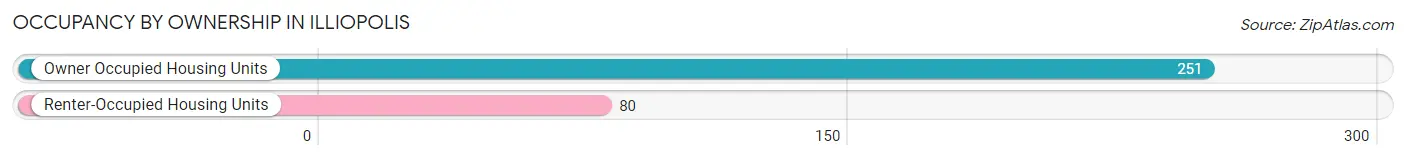
| Occupancy | # Housing Units | % Housing Units |
| Owner Occupied Housing Units | 251 | 75.8% |
| Renter-Occupied Housing Units | 80 | 24.2% |
| Total Occupied Housing Units | 331 | 100.0% |
Occupancy by Household Size in Illiopolis
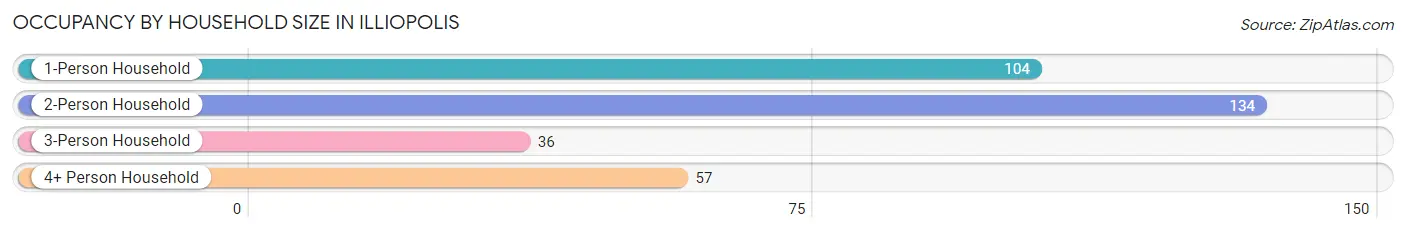
| Household Size | # Housing Units | % Housing Units |
| 1-Person Household | 104 | 31.4% |
| 2-Person Household | 134 | 40.5% |
| 3-Person Household | 36 | 10.9% |
| 4+ Person Household | 57 | 17.2% |
| Total Housing Units | 331 | 100.0% |
Occupancy by Ownership by Household Size in Illiopolis
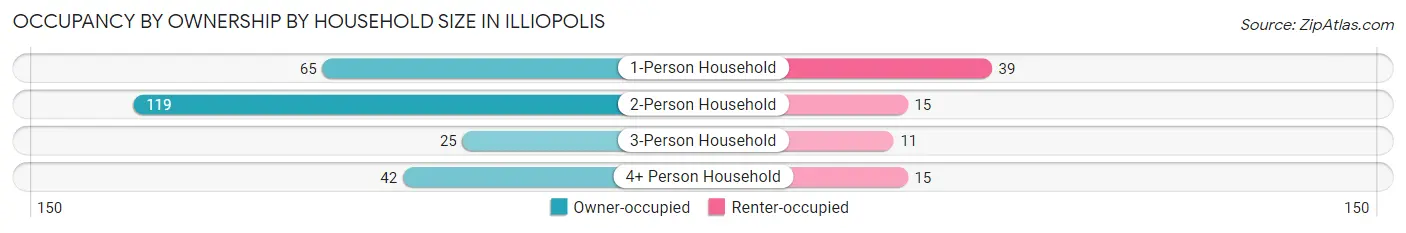
| Household Size | Owner-occupied | Renter-occupied |
| 1-Person Household | 65 (62.5%) | 39 (37.5%) |
| 2-Person Household | 119 (88.8%) | 15 (11.2%) |
| 3-Person Household | 25 (69.4%) | 11 (30.6%) |
| 4+ Person Household | 42 (73.7%) | 15 (26.3%) |
| Total Housing Units | 251 (75.8%) | 80 (24.2%) |
Occupancy by Educational Attainment in Illiopolis
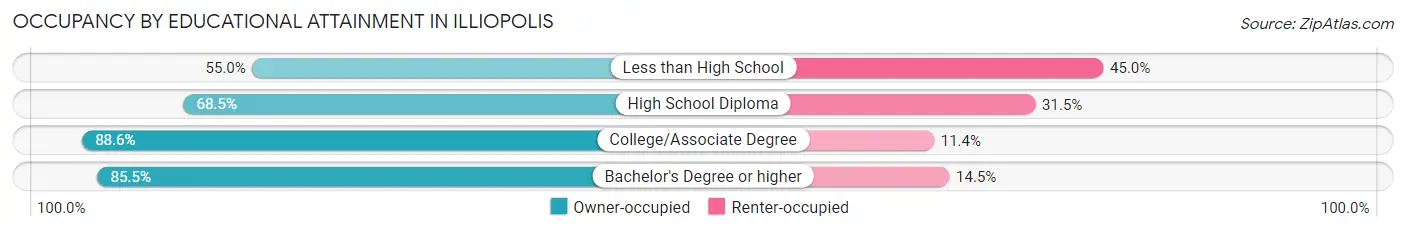
| Household Size | Owner-occupied | Renter-occupied |
| Less than High School | 11 (55.0%) | 9 (45.0%) |
| High School Diploma | 113 (68.5%) | 52 (31.5%) |
| College/Associate Degree | 62 (88.6%) | 8 (11.4%) |
| Bachelor's Degree or higher | 65 (85.5%) | 11 (14.5%) |
Occupancy by Age of Householder in Illiopolis
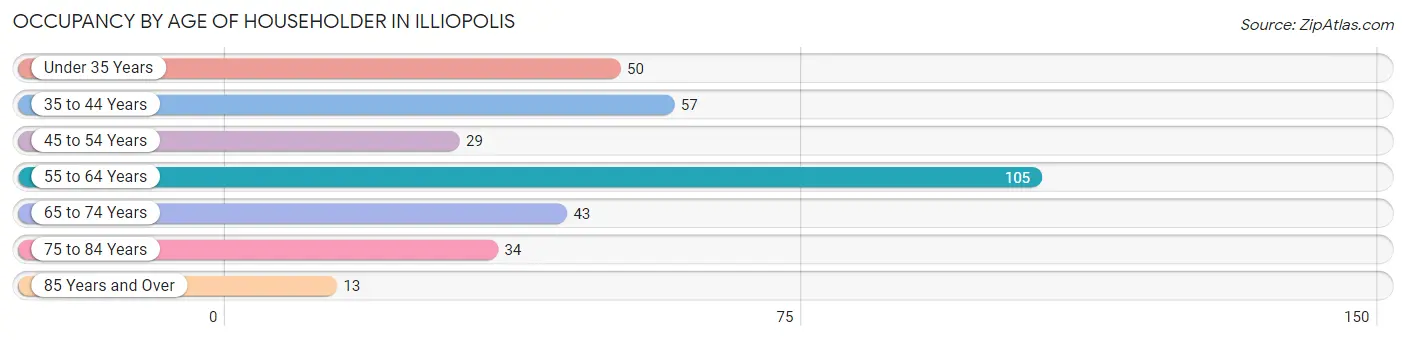
| Age Bracket | # Households | % Households |
| Under 35 Years | 50 | 15.1% |
| 35 to 44 Years | 57 | 17.2% |
| 45 to 54 Years | 29 | 8.8% |
| 55 to 64 Years | 105 | 31.7% |
| 65 to 74 Years | 43 | 13.0% |
| 75 to 84 Years | 34 | 10.3% |
| 85 Years and Over | 13 | 3.9% |
| Total | 331 | 100.0% |
Housing Finances in Illiopolis
Median Income by Occupancy in Illiopolis
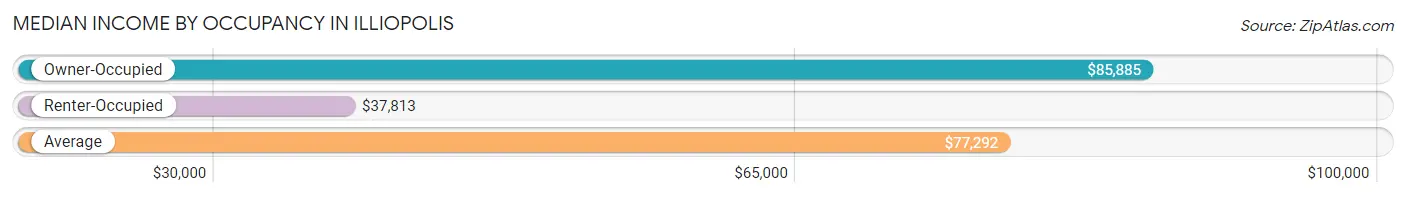
| Occupancy Type | # Households | Median Income |
| Owner-Occupied | 251 (75.8%) | $85,885 |
| Renter-Occupied | 80 (24.2%) | $37,813 |
| Average | 331 (100.0%) | $77,292 |
Occupancy by Householder Income Bracket in Illiopolis
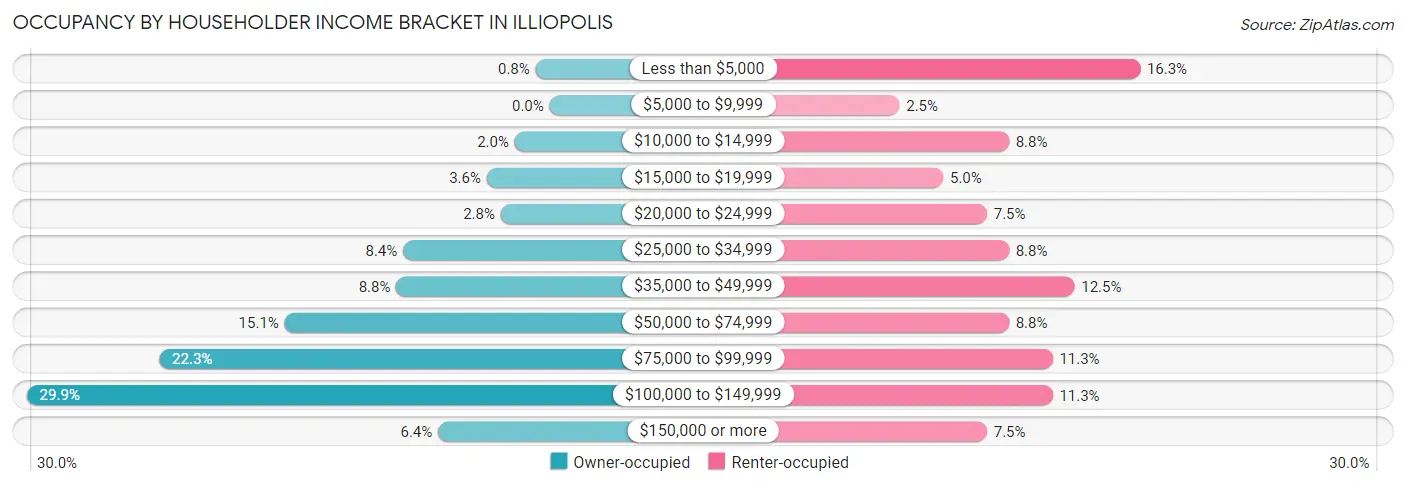
| Income Bracket | Owner-occupied | Renter-occupied |
| Less than $5,000 | 2 (0.8%) | 13 (16.3%) |
| $5,000 to $9,999 | 0 (0.0%) | 2 (2.5%) |
| $10,000 to $14,999 | 5 (2.0%) | 7 (8.7%) |
| $15,000 to $19,999 | 9 (3.6%) | 4 (5.0%) |
| $20,000 to $24,999 | 7 (2.8%) | 6 (7.5%) |
| $25,000 to $34,999 | 21 (8.4%) | 7 (8.7%) |
| $35,000 to $49,999 | 22 (8.8%) | 10 (12.5%) |
| $50,000 to $74,999 | 38 (15.1%) | 7 (8.7%) |
| $75,000 to $99,999 | 56 (22.3%) | 9 (11.3%) |
| $100,000 to $149,999 | 75 (29.9%) | 9 (11.3%) |
| $150,000 or more | 16 (6.4%) | 6 (7.5%) |
| Total | 251 (100.0%) | 80 (100.0%) |
Monthly Housing Cost Tiers in Illiopolis
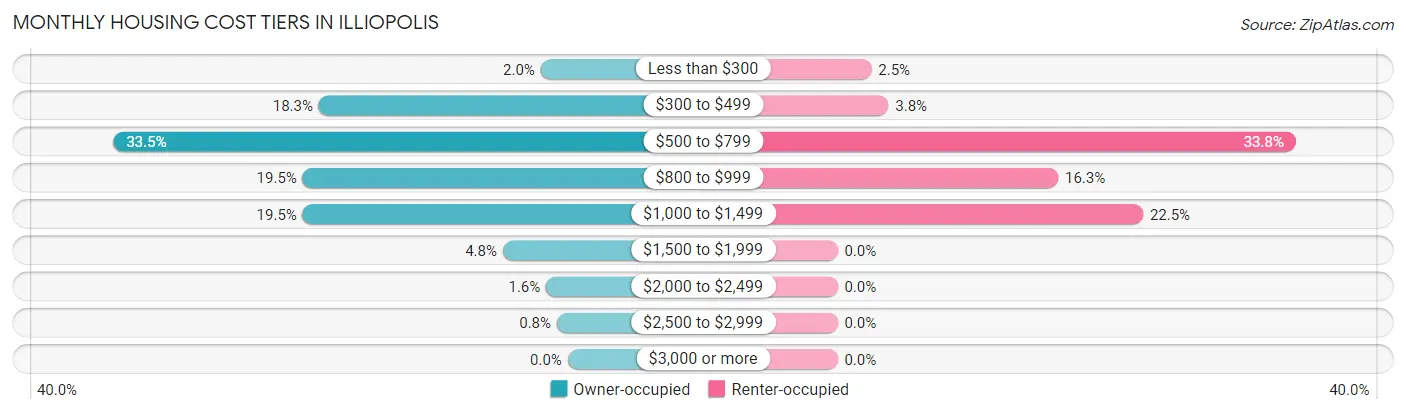
| Monthly Cost | Owner-occupied | Renter-occupied |
| Less than $300 | 5 (2.0%) | 2 (2.5%) |
| $300 to $499 | 46 (18.3%) | 3 (3.7%) |
| $500 to $799 | 84 (33.5%) | 27 (33.8%) |
| $800 to $999 | 49 (19.5%) | 13 (16.3%) |
| $1,000 to $1,499 | 49 (19.5%) | 18 (22.5%) |
| $1,500 to $1,999 | 12 (4.8%) | 0 (0.0%) |
| $2,000 to $2,499 | 4 (1.6%) | 0 (0.0%) |
| $2,500 to $2,999 | 2 (0.8%) | 0 (0.0%) |
| $3,000 or more | 0 (0.0%) | 0 (0.0%) |
| Total | 251 (100.0%) | 80 (100.0%) |
Physical Housing Characteristics in Illiopolis
Housing Structures in Illiopolis
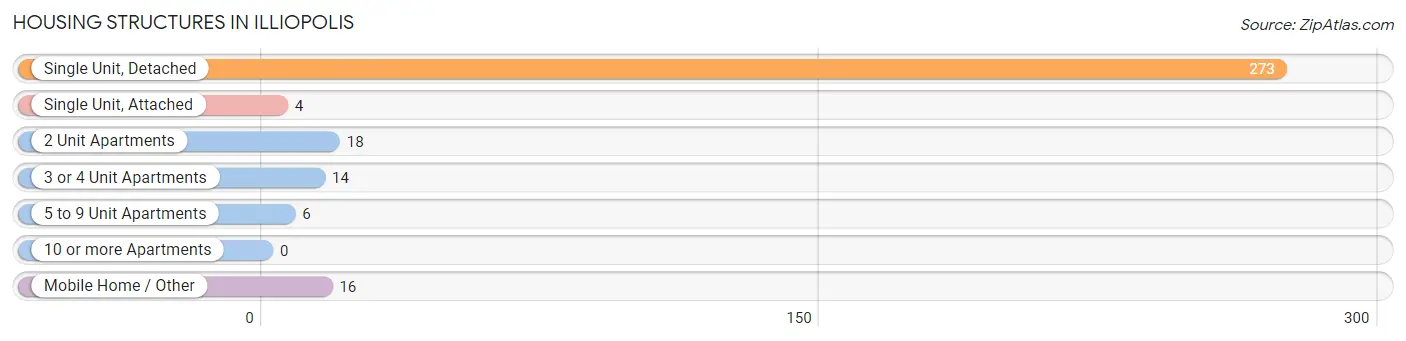
| Structure Type | # Housing Units | % Housing Units |
| Single Unit, Detached | 273 | 82.5% |
| Single Unit, Attached | 4 | 1.2% |
| 2 Unit Apartments | 18 | 5.4% |
| 3 or 4 Unit Apartments | 14 | 4.2% |
| 5 to 9 Unit Apartments | 6 | 1.8% |
| 10 or more Apartments | 0 | 0.0% |
| Mobile Home / Other | 16 | 4.8% |
| Total | 331 | 100.0% |
Housing Structures by Occupancy in Illiopolis
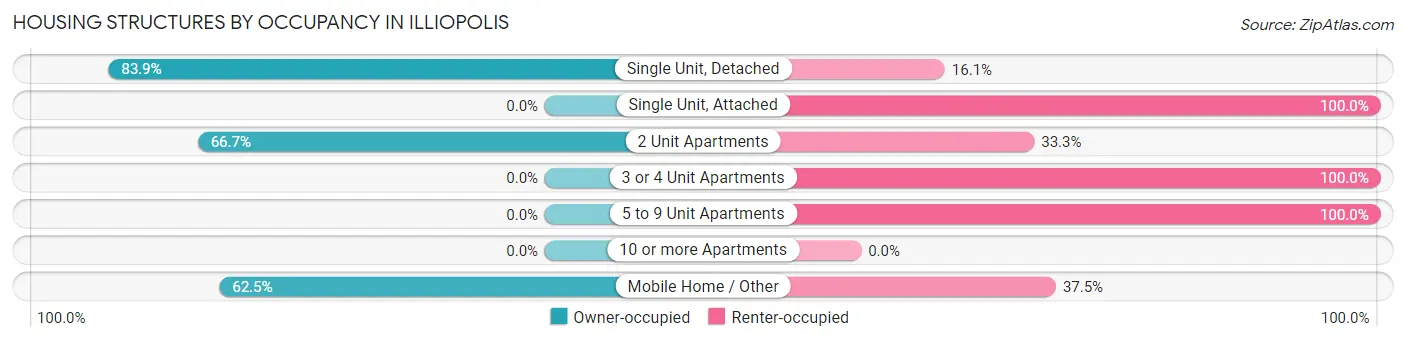
| Structure Type | Owner-occupied | Renter-occupied |
| Single Unit, Detached | 229 (83.9%) | 44 (16.1%) |
| Single Unit, Attached | 0 (0.0%) | 4 (100.0%) |
| 2 Unit Apartments | 12 (66.7%) | 6 (33.3%) |
| 3 or 4 Unit Apartments | 0 (0.0%) | 14 (100.0%) |
| 5 to 9 Unit Apartments | 0 (0.0%) | 6 (100.0%) |
| 10 or more Apartments | 0 (0.0%) | 0 (0.0%) |
| Mobile Home / Other | 10 (62.5%) | 6 (37.5%) |
| Total | 251 (75.8%) | 80 (24.2%) |
Housing Structures by Number of Rooms in Illiopolis
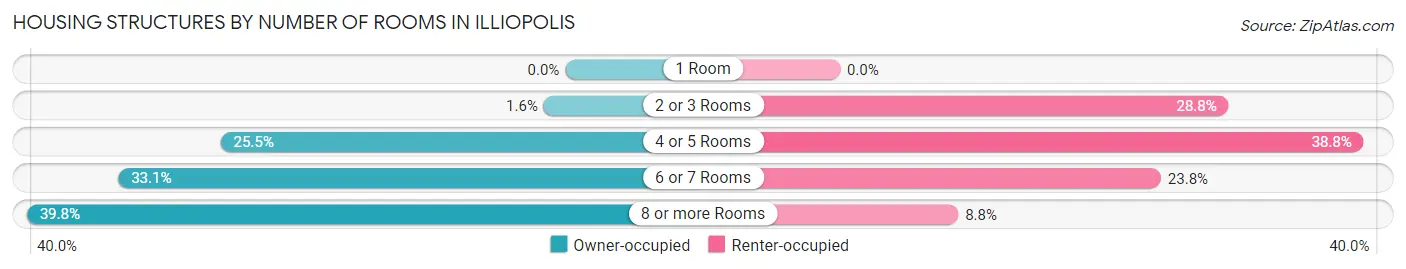
| Number of Rooms | Owner-occupied | Renter-occupied |
| 1 Room | 0 (0.0%) | 0 (0.0%) |
| 2 or 3 Rooms | 4 (1.6%) | 23 (28.7%) |
| 4 or 5 Rooms | 64 (25.5%) | 31 (38.8%) |
| 6 or 7 Rooms | 83 (33.1%) | 19 (23.7%) |
| 8 or more Rooms | 100 (39.8%) | 7 (8.7%) |
| Total | 251 (100.0%) | 80 (100.0%) |
Housing Structure by Heating Type in Illiopolis
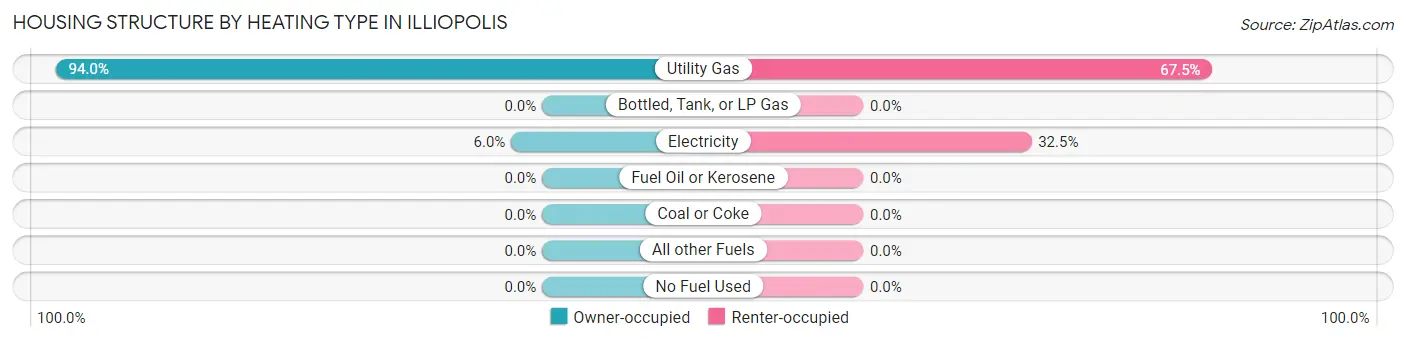
| Heating Type | Owner-occupied | Renter-occupied |
| Utility Gas | 236 (94.0%) | 54 (67.5%) |
| Bottled, Tank, or LP Gas | 0 (0.0%) | 0 (0.0%) |
| Electricity | 15 (6.0%) | 26 (32.5%) |
| Fuel Oil or Kerosene | 0 (0.0%) | 0 (0.0%) |
| Coal or Coke | 0 (0.0%) | 0 (0.0%) |
| All other Fuels | 0 (0.0%) | 0 (0.0%) |
| No Fuel Used | 0 (0.0%) | 0 (0.0%) |
| Total | 251 (100.0%) | 80 (100.0%) |
Household Vehicle Usage in Illiopolis
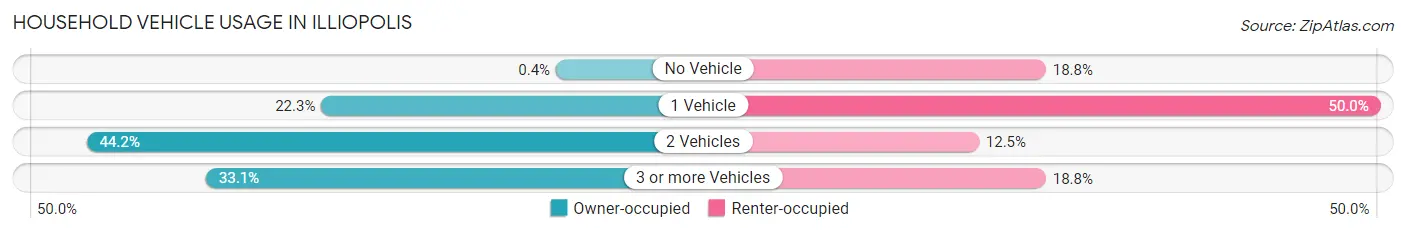
| Vehicles per Household | Owner-occupied | Renter-occupied |
| No Vehicle | 1 (0.4%) | 15 (18.8%) |
| 1 Vehicle | 56 (22.3%) | 40 (50.0%) |
| 2 Vehicles | 111 (44.2%) | 10 (12.5%) |
| 3 or more Vehicles | 83 (33.1%) | 15 (18.8%) |
| Total | 251 (100.0%) | 80 (100.0%) |
Real Estate & Mortgages in Illiopolis
Real Estate and Mortgage Overview in Illiopolis
| Characteristic | Without Mortgage | With Mortgage |
| Housing Units | 115 | 136 |
| Median Property Value | $93,200 | $90,000 |
| Median Household Income | $68,750 | $7 |
| Monthly Housing Costs | $519 | $0 |
| Real Estate Taxes | $1,708 | $0 |
Property Value by Mortgage Status in Illiopolis
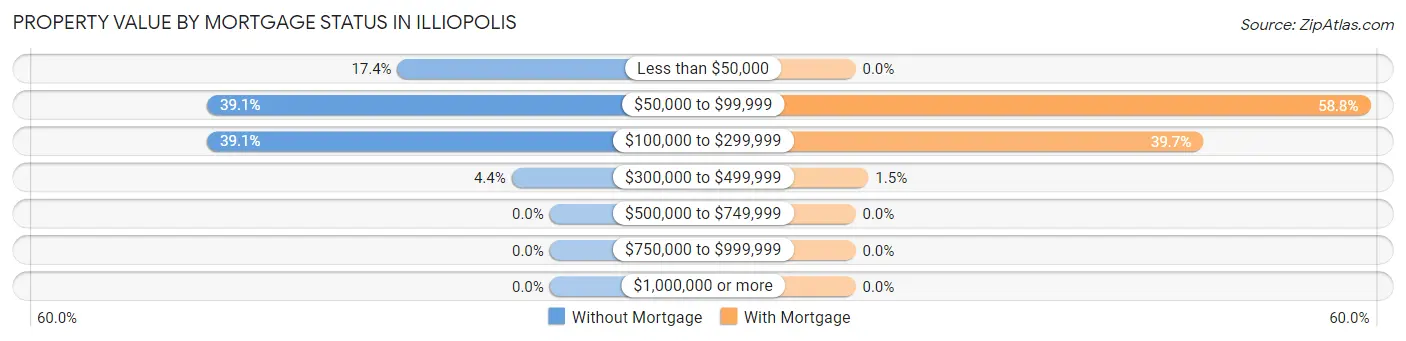
| Property Value | Without Mortgage | With Mortgage |
| Less than $50,000 | 20 (17.4%) | 0 (0.0%) |
| $50,000 to $99,999 | 45 (39.1%) | 80 (58.8%) |
| $100,000 to $299,999 | 45 (39.1%) | 54 (39.7%) |
| $300,000 to $499,999 | 5 (4.3%) | 2 (1.5%) |
| $500,000 to $749,999 | 0 (0.0%) | 0 (0.0%) |
| $750,000 to $999,999 | 0 (0.0%) | 0 (0.0%) |
| $1,000,000 or more | 0 (0.0%) | 0 (0.0%) |
| Total | 115 (100.0%) | 136 (100.0%) |
Household Income by Mortgage Status in Illiopolis
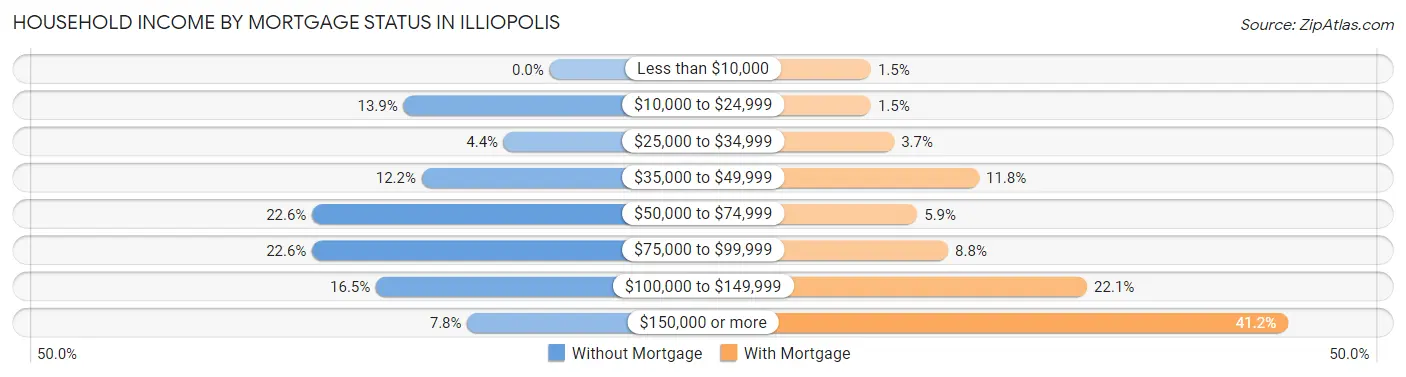
| Household Income | Without Mortgage | With Mortgage |
| Less than $10,000 | 0 (0.0%) | 2 (1.5%) |
| $10,000 to $24,999 | 16 (13.9%) | 2 (1.5%) |
| $25,000 to $34,999 | 5 (4.3%) | 5 (3.7%) |
| $35,000 to $49,999 | 14 (12.2%) | 16 (11.8%) |
| $50,000 to $74,999 | 26 (22.6%) | 8 (5.9%) |
| $75,000 to $99,999 | 26 (22.6%) | 12 (8.8%) |
| $100,000 to $149,999 | 19 (16.5%) | 30 (22.1%) |
| $150,000 or more | 9 (7.8%) | 56 (41.2%) |
| Total | 115 (100.0%) | 136 (100.0%) |
Property Value to Household Income Ratio in Illiopolis
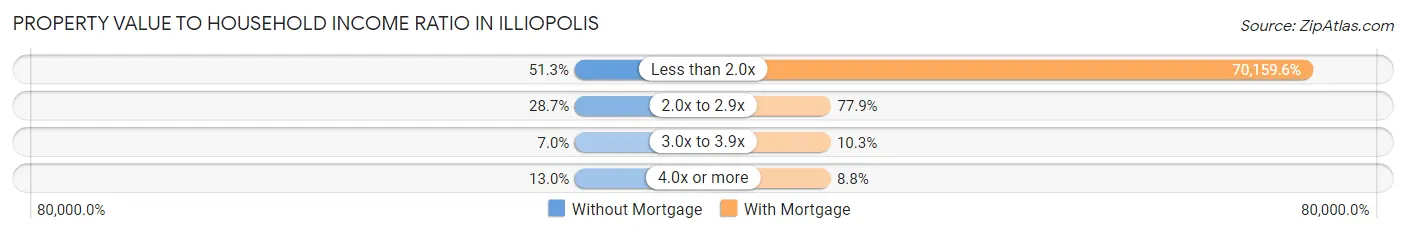
| Value-to-Income Ratio | Without Mortgage | With Mortgage |
| Less than 2.0x | 59 (51.3%) | 95,417 (70,159.6%) |
| 2.0x to 2.9x | 33 (28.7%) | 106 (77.9%) |
| 3.0x to 3.9x | 8 (7.0%) | 14 (10.3%) |
| 4.0x or more | 15 (13.0%) | 12 (8.8%) |
| Total | 115 (100.0%) | 136 (100.0%) |
Real Estate Taxes by Mortgage Status in Illiopolis
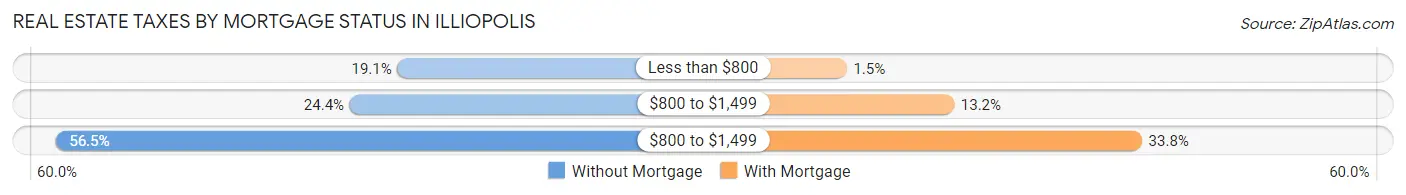
| Property Taxes | Without Mortgage | With Mortgage |
| Less than $800 | 22 (19.1%) | 2 (1.5%) |
| $800 to $1,499 | 28 (24.3%) | 18 (13.2%) |
| $800 to $1,499 | 65 (56.5%) | 46 (33.8%) |
| Total | 115 (100.0%) | 136 (100.0%) |
Health & Disability in Illiopolis
Health Insurance Coverage by Age in Illiopolis
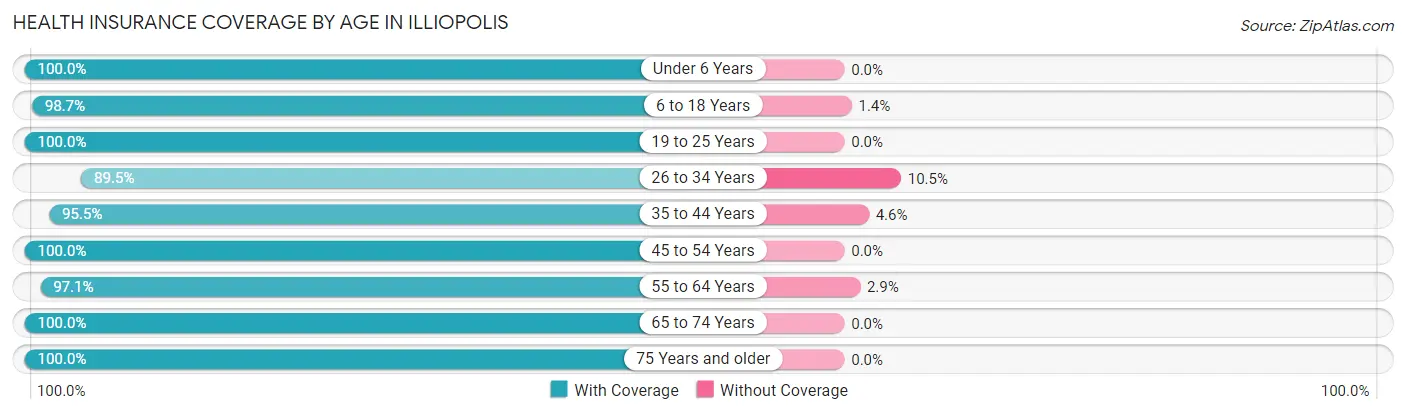
| Age Bracket | With Coverage | Without Coverage |
| Under 6 Years | 72 (100.0%) | 0 (0.0%) |
| 6 to 18 Years | 146 (98.7%) | 2 (1.3%) |
| 19 to 25 Years | 61 (100.0%) | 0 (0.0%) |
| 26 to 34 Years | 51 (89.5%) | 6 (10.5%) |
| 35 to 44 Years | 105 (95.5%) | 5 (4.5%) |
| 45 to 54 Years | 67 (100.0%) | 0 (0.0%) |
| 55 to 64 Years | 166 (97.1%) | 5 (2.9%) |
| 65 to 74 Years | 80 (100.0%) | 0 (0.0%) |
| 75 Years and older | 56 (100.0%) | 0 (0.0%) |
| Total | 804 (97.8%) | 18 (2.2%) |
Health Insurance Coverage by Citizenship Status in Illiopolis
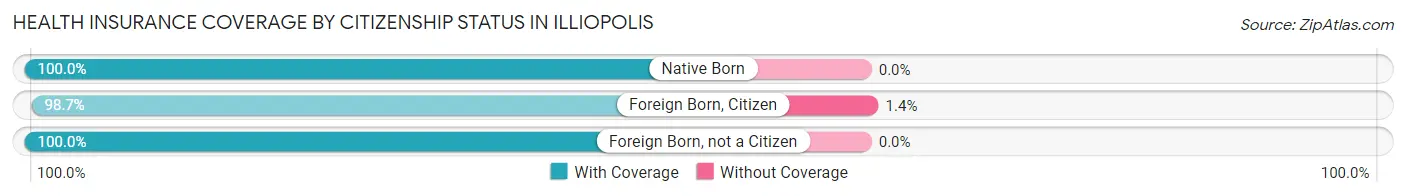
| Citizenship Status | With Coverage | Without Coverage |
| Native Born | 72 (100.0%) | 0 (0.0%) |
| Foreign Born, Citizen | 146 (98.7%) | 2 (1.3%) |
| Foreign Born, not a Citizen | 61 (100.0%) | 0 (0.0%) |
Health Insurance Coverage by Household Income in Illiopolis
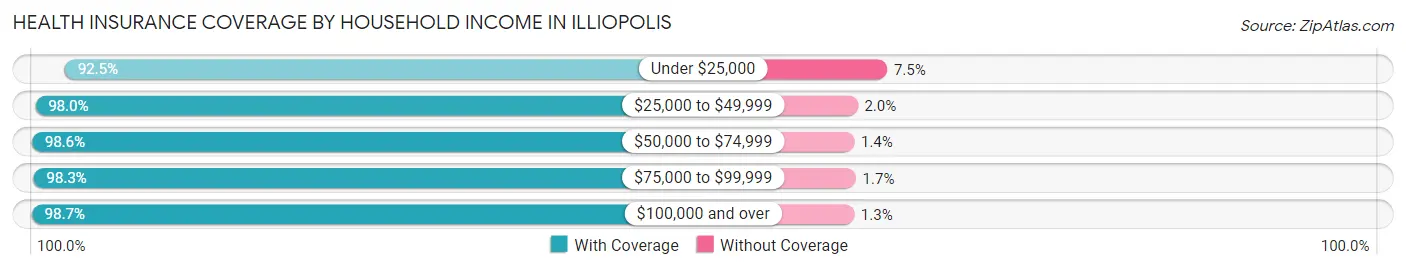
| Household Income | With Coverage | Without Coverage |
| Under $25,000 | 86 (92.5%) | 7 (7.5%) |
| $25,000 to $49,999 | 98 (98.0%) | 2 (2.0%) |
| $50,000 to $74,999 | 145 (98.6%) | 2 (1.4%) |
| $75,000 to $99,999 | 178 (98.3%) | 3 (1.7%) |
| $100,000 and over | 297 (98.7%) | 4 (1.3%) |
Public vs Private Health Insurance Coverage by Age in Illiopolis
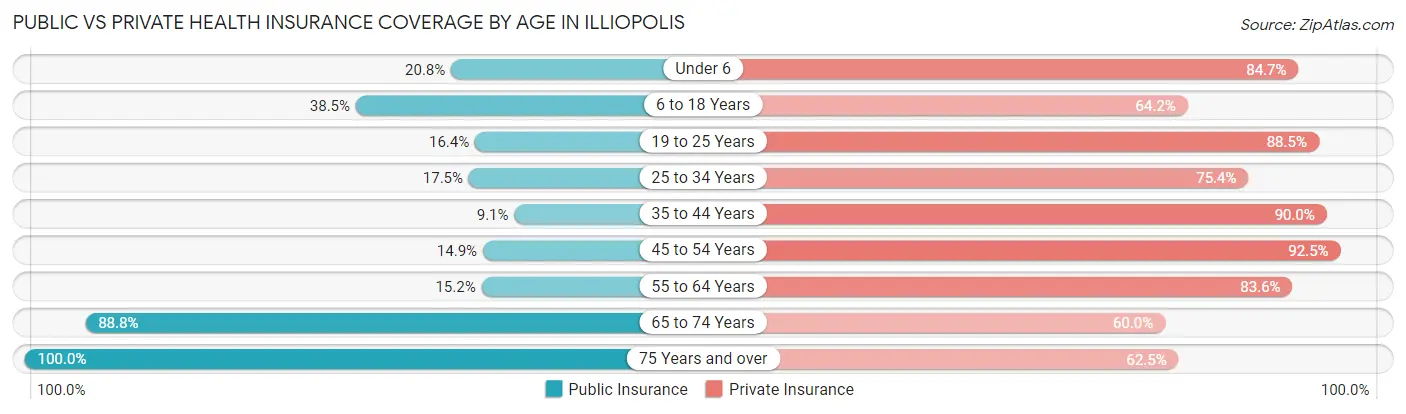
| Age Bracket | Public Insurance | Private Insurance |
| Under 6 | 15 (20.8%) | 61 (84.7%) |
| 6 to 18 Years | 57 (38.5%) | 95 (64.2%) |
| 19 to 25 Years | 10 (16.4%) | 54 (88.5%) |
| 25 to 34 Years | 10 (17.5%) | 43 (75.4%) |
| 35 to 44 Years | 10 (9.1%) | 99 (90.0%) |
| 45 to 54 Years | 10 (14.9%) | 62 (92.5%) |
| 55 to 64 Years | 26 (15.2%) | 143 (83.6%) |
| 65 to 74 Years | 71 (88.7%) | 48 (60.0%) |
| 75 Years and over | 56 (100.0%) | 35 (62.5%) |
| Total | 265 (32.2%) | 640 (77.9%) |
Disability Status by Sex by Age in Illiopolis
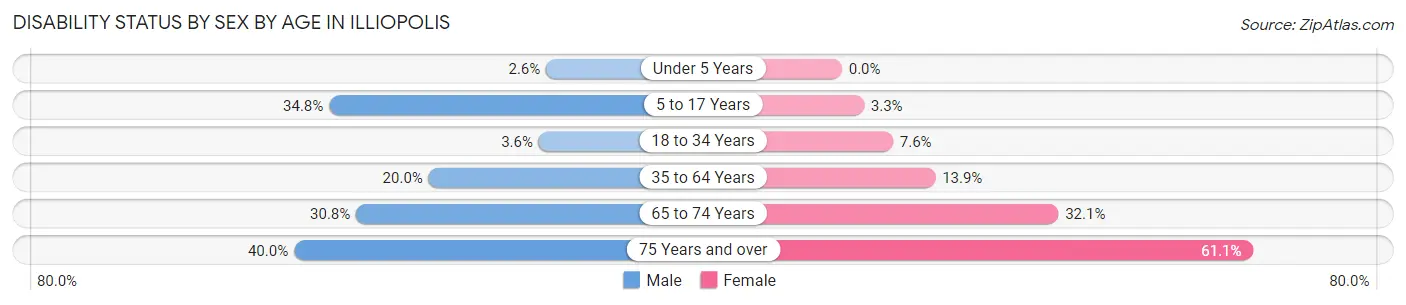
| Age Bracket | Male | Female |
| Under 5 Years | 1 (2.6%) | 0 (0.0%) |
| 5 to 17 Years | 32 (34.8%) | 2 (3.3%) |
| 18 to 34 Years | 2 (3.6%) | 5 (7.6%) |
| 35 to 64 Years | 35 (20.0%) | 24 (13.9%) |
| 65 to 74 Years | 16 (30.8%) | 9 (32.1%) |
| 75 Years and over | 8 (40.0%) | 22 (61.1%) |
Disability Class by Sex by Age in Illiopolis
Disability Class: Hearing Difficulty
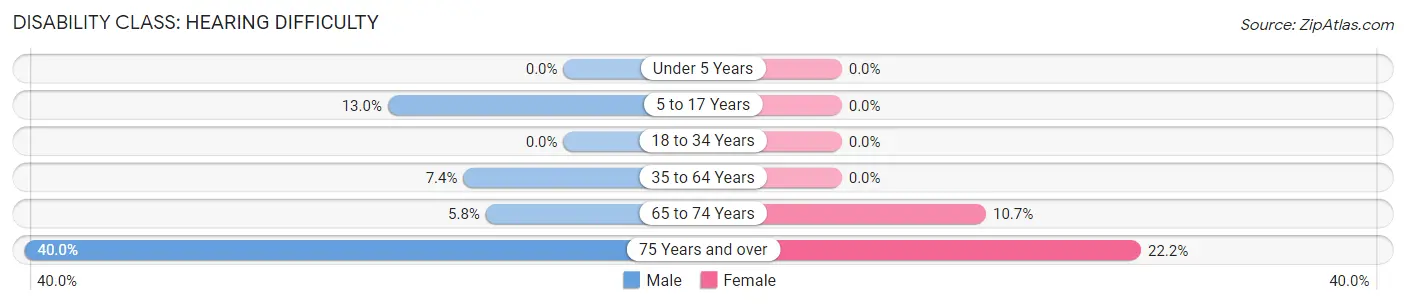
| Age Bracket | Male | Female |
| Under 5 Years | 0 (0.0%) | 0 (0.0%) |
| 5 to 17 Years | 12 (13.0%) | 0 (0.0%) |
| 18 to 34 Years | 0 (0.0%) | 0 (0.0%) |
| 35 to 64 Years | 13 (7.4%) | 0 (0.0%) |
| 65 to 74 Years | 3 (5.8%) | 3 (10.7%) |
| 75 Years and over | 8 (40.0%) | 8 (22.2%) |
Disability Class: Vision Difficulty
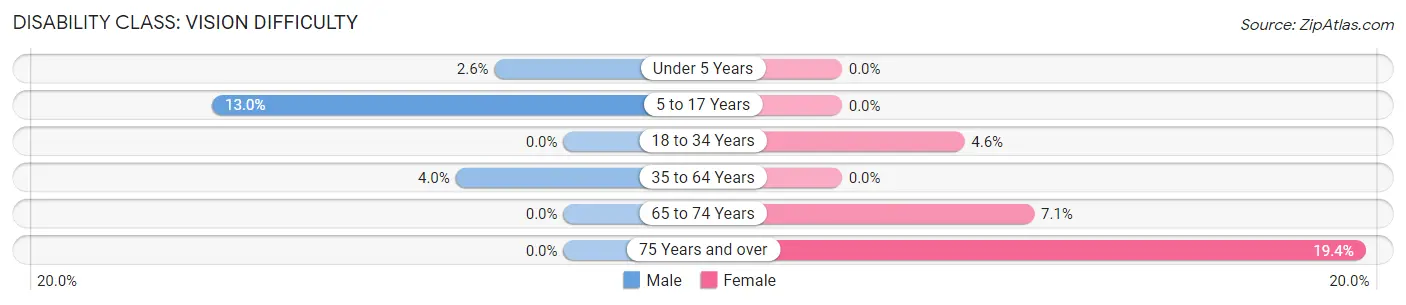
| Age Bracket | Male | Female |
| Under 5 Years | 1 (2.6%) | 0 (0.0%) |
| 5 to 17 Years | 12 (13.0%) | 0 (0.0%) |
| 18 to 34 Years | 0 (0.0%) | 3 (4.5%) |
| 35 to 64 Years | 7 (4.0%) | 0 (0.0%) |
| 65 to 74 Years | 0 (0.0%) | 2 (7.1%) |
| 75 Years and over | 0 (0.0%) | 7 (19.4%) |
Disability Class: Cognitive Difficulty
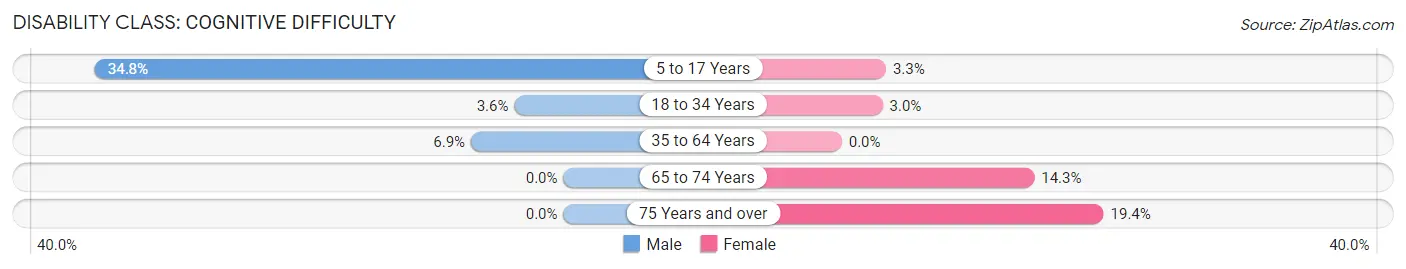
| Age Bracket | Male | Female |
| 5 to 17 Years | 32 (34.8%) | 2 (3.3%) |
| 18 to 34 Years | 2 (3.6%) | 2 (3.0%) |
| 35 to 64 Years | 12 (6.9%) | 0 (0.0%) |
| 65 to 74 Years | 0 (0.0%) | 4 (14.3%) |
| 75 Years and over | 0 (0.0%) | 7 (19.4%) |
Disability Class: Ambulatory Difficulty
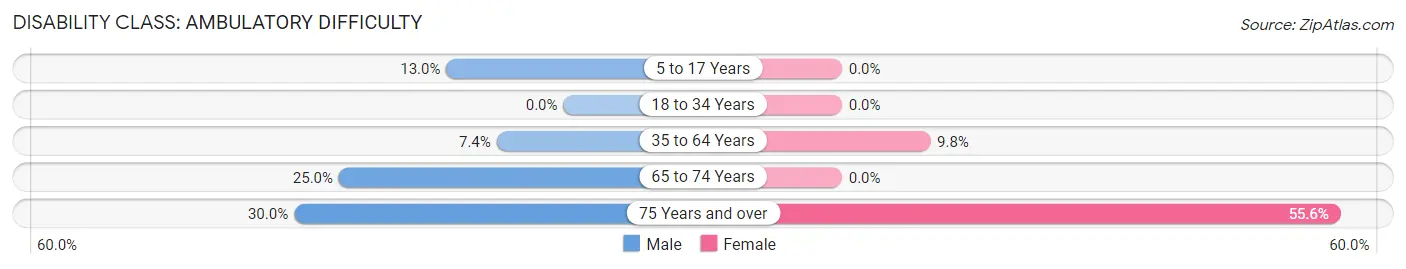
| Age Bracket | Male | Female |
| 5 to 17 Years | 12 (13.0%) | 0 (0.0%) |
| 18 to 34 Years | 0 (0.0%) | 0 (0.0%) |
| 35 to 64 Years | 13 (7.4%) | 17 (9.8%) |
| 65 to 74 Years | 13 (25.0%) | 0 (0.0%) |
| 75 Years and over | 6 (30.0%) | 20 (55.6%) |
Disability Class: Self-Care Difficulty
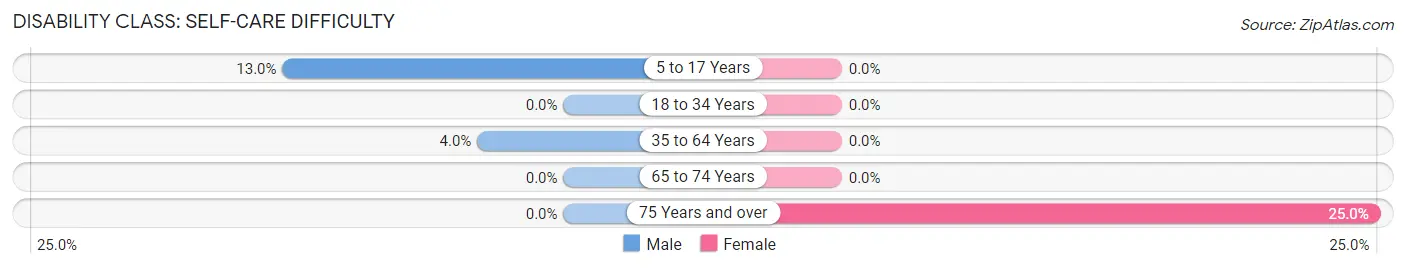
| Age Bracket | Male | Female |
| 5 to 17 Years | 12 (13.0%) | 0 (0.0%) |
| 18 to 34 Years | 0 (0.0%) | 0 (0.0%) |
| 35 to 64 Years | 7 (4.0%) | 0 (0.0%) |
| 65 to 74 Years | 0 (0.0%) | 0 (0.0%) |
| 75 Years and over | 0 (0.0%) | 9 (25.0%) |
Technology Access in Illiopolis
Computing Device Access in Illiopolis
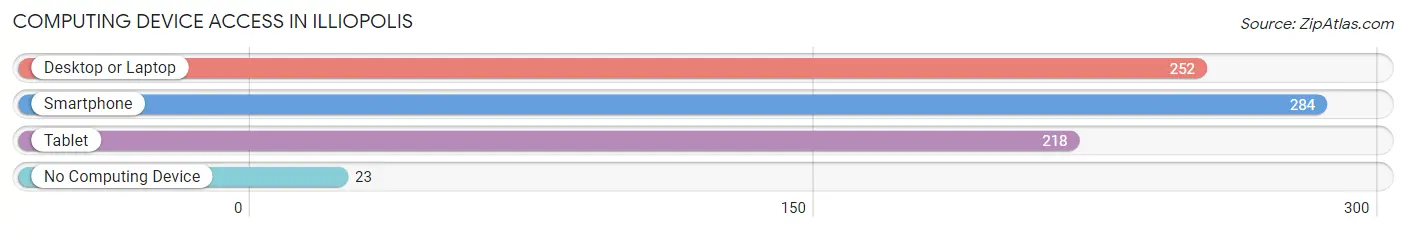
| Device Type | # Households | % Households |
| Desktop or Laptop | 252 | 76.1% |
| Smartphone | 284 | 85.8% |
| Tablet | 218 | 65.9% |
| No Computing Device | 23 | 7.0% |
| Total | 331 | 100.0% |
Internet Access in Illiopolis
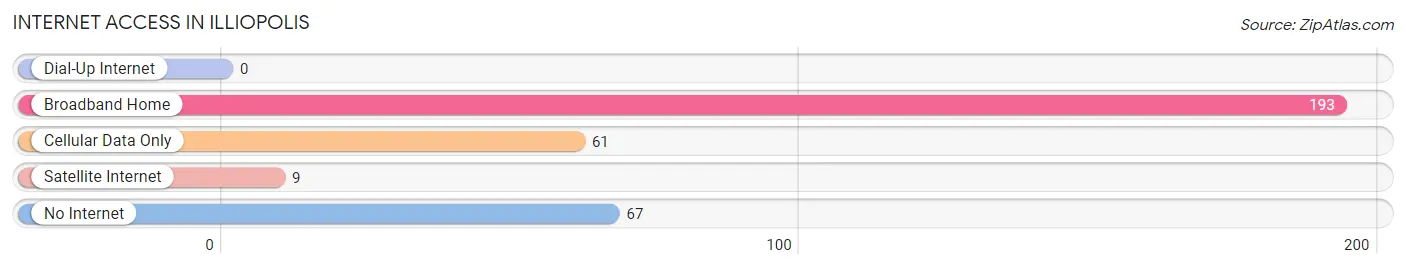
| Internet Type | # Households | % Households |
| Dial-Up Internet | 0 | 0.0% |
| Broadband Home | 193 | 58.3% |
| Cellular Data Only | 61 | 18.4% |
| Satellite Internet | 9 | 2.7% |
| No Internet | 67 | 20.2% |
| Total | 331 | 100.0% |
Illiopolis Summary
Illiopolis is a village located in Sangamon County, Illinois, United States. The population was 1,039 at the 2010 census. It is part of the Springfield, Illinois Metropolitan Statistical Area.
History
Illiopolis was founded in 1854 by a group of settlers from New York. The village was named after the Illini tribe, which had inhabited the area prior to the settlers' arrival. The first post office was established in 1855.
In 1858, the village was incorporated and the first mayor was elected. The first school was built in 1859 and the first church was built in 1860.
In 1867, the first railroad line was built through the village, connecting it to Springfield and Decatur. This allowed Illiopolis to become a major shipping center for the surrounding area.
In 1871, the village was connected to the telegraph system, allowing for faster communication with the outside world.
In 1872 the first bank was established in Illiopolis
In 1873 the first newspaper the Illiopolis Gazette was published
In 1876 the first telephone line was established in the village
In 1877 the first fire department was established
In 1878 the first public library was established
In 1879 the first electric lights were installed in the village
In 1881 the first waterworks system was established
In 1882 the first sewer system was established
In 1883 the first gas lights were installed in the village
In 1884 the first electric street lights were installed
In 1885 the first public park was established
In 1886 the first public swimming pool was established
In 1887 the first public library building was constructed
In 1888 the first public high school was established
In 1889 the first public hospital was established
In 1890 the first public library building was expanded
In 1891 the first public library building was remodeled
In 1892 the first public library building was enlarged
In 1893 the first public library building was renovated
In 1894 the first public library building was remodeled again
In 1895 the first public library building was expanded again
In 1896 the first public library building was remodeled yet again
In 1897 the first public library building was remodeled yet again
In 1898 the first public library building was remodeled yet again
In 1899 the first public library building was remodeled yet again
In 1900 the first public library building was remodeled yet again
Geography
Illiopolis is located at 39 48 25 North 89 25 45 West 39 806944 89 429167
According to the 2010 census the village has a total area of 0 9 square miles 2 3 km2 all land
Economy
The economy of Illiopolis is largely based on agriculture. The village is home to several farms, which produce a variety of crops, including corn, soybeans, wheat, and hay.
The village also has several small businesses, including a grocery store, a hardware store, a restaurant, and a gas station.
Demographics
As of the census of 2010, there were 1,039 people, 431 households, and 287 families residing in the village. The population density was 1,148.9 people per square mile (444.3/km2). There were 471 housing units at an average density of 517.8 per square mile (199.7/km2). The racial makeup of the village was 97.7% White, 0.2% African American, 0.2% Native American, 0.2% Asian, 0.2% from other races, and 1.7% from two or more races. Hispanic or Latino of any race were 1.2% of the population.
There were 431 households, out of which 28.7% had children under the age of 18 living with them, 51.2% were married couples living together, 10.2% had a female householder with no husband present, and 34.2% were non-families. 30.2% of all households were made up of individuals, and 15.2% had someone living alone who was 65 years of age or older. The average household size was 2.40 and the average family size was 2.97.
In the village, the population was spread out, with 24.2% under the age of 18, 7.2% from 18 to 24, 25.7% from 25 to 44, 24.2% from 45 to 64, and 18.7% who were 65 years of age or older. The median age was 40 years. For every 100 females, there were 91.2 males. For every 100 females age 18 and over, there were 87.2 males.
The median income for a household in the village was $37,500, and the median income for a family was $45,000. Males had a median income of $31,250 versus $21,250 for females. The per capita income for the village was $17,945. About 5.2% of families and 8.2% of the population were below the poverty line, including 10.2% of those under age 18 and 8.2% of those age 65 or over.
Common Questions
What is the Total Population of Illiopolis?
Total Population of Illiopolis is 822.
What is the Total Male Population of Illiopolis?
Total Male Population of Illiopolis is 433.
What is the Total Female Population of Illiopolis?
Total Female Population of Illiopolis is 389.
What is the Ratio of Males per 100 Females in Illiopolis?
There are 111.31 Males per 100 Females in Illiopolis.
What is the Ratio of Females per 100 Males in Illiopolis?
There are 89.84 Females per 100 Males in Illiopolis.
What is the Median Population Age in Illiopolis?
Median Population Age in Illiopolis is 40.3 Years.
What is the Average Family Size in Illiopolis
Average Family Size in Illiopolis is 3.2 People.
What is the Average Household Size in Illiopolis
Average Household Size in Illiopolis is 2.5 People.
What is Per Capita Income in Illiopolis?
Per Capita income in Illiopolis is $31,268.
What is the Median Family Income in Illiopolis?
Median Family Income in Illiopolis is $90,000.
What is the Median Household income in Illiopolis?
Median Household Income in Illiopolis is $77,292.
What is Income or Wage Gap in Illiopolis?
Income or Wage Gap in Illiopolis is 25.8%.
Women in Illiopolis earn 74.2 cents for every dollar earned by a man.
What is Inequality or Gini Index in Illiopolis?
Inequality or Gini Index in Illiopolis is 0.35.
How Large is the Labor Force in Illiopolis?
There are 400 People in the Labor Forcein in Illiopolis.
What is the Percentage of People in the Labor Force in Illiopolis?
63.9% of People are in the Labor Force in Illiopolis.
What is the Unemployment Rate in Illiopolis?
Unemployment Rate in Illiopolis is 2.5%.