Cities with the Highest Percentage of Immigrants from Central America in Utah
RELATED REPORTS & OPTIONS
Central America
Utah
Compare Cities
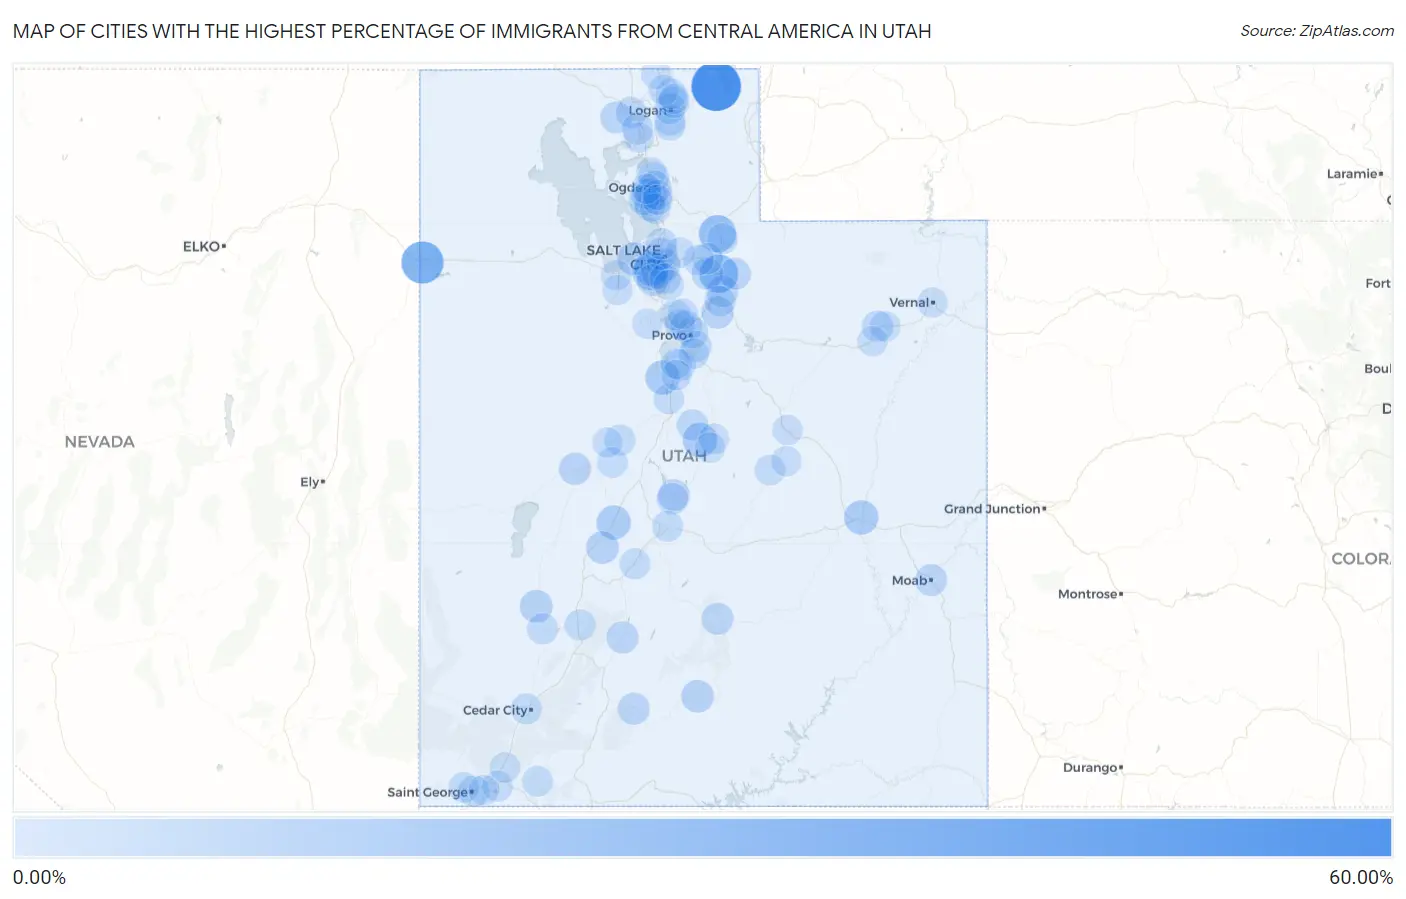
Map of Cities with the Highest Percentage of Immigrants from Central America in Utah
0.00%
60.00%
Cities with the Highest Percentage of Immigrants from Central America in Utah
| City | Central America | vs State | vs National | |
| 1. | Garden | 54.47% | 3.55%(+50.9)#-1 | 4.37%(+50.1)#0 |
| 2. | Wendover | 33.71% | 3.55%(+30.2)#0 | 4.37%(+29.3)#1 |
| 3. | Hideout | 23.73% | 3.55%(+20.2)#1 | 4.37%(+19.4)#2 |
| 4. | Coalville | 20.46% | 3.55%(+16.9)#2 | 4.37%(+16.1)#3 |
| 5. | Kearns | 14.53% | 3.55%(+11.0)#3 | 4.37%(+10.2)#4 |
| 6. | Moroni | 13.19% | 3.55%(+9.63)#4 | 4.37%(+8.82)#5 |
| 7. | West Valley City | 13.17% | 3.55%(+9.62)#5 | 4.37%(+8.80)#6 |
| 8. | Goshen | 12.49% | 3.55%(+8.93)#6 | 4.37%(+8.12)#7 |
| 9. | Green River | 12.44% | 3.55%(+8.88)#7 | 4.37%(+8.07)#8 |
| 10. | Fillmore | 12.21% | 3.55%(+8.66)#8 | 4.37%(+7.84)#9 |
| 11. | Magna | 9.32% | 3.55%(+5.77)#9 | 4.37%(+4.95)#10 |
| 12. | South Salt Lake | 8.71% | 3.55%(+5.15)#10 | 4.37%(+4.34)#11 |
| 13. | Milford | 8.29% | 3.55%(+4.73)#11 | 4.37%(+3.92)#12 |
| 14. | Kanosh | 8.05% | 3.55%(+4.50)#12 | 4.37%(+3.68)#13 |
| 15. | Escalante | 7.91% | 3.55%(+4.36)#13 | 4.37%(+3.54)#14 |
| 16. | Ogden | 7.63% | 3.55%(+4.07)#14 | 4.37%(+3.26)#15 |
| 17. | Wallsburg | 7.61% | 3.55%(+4.06)#15 | 4.37%(+3.24)#16 |
| 18. | Taylorsville | 7.47% | 3.55%(+3.91)#16 | 4.37%(+3.10)#17 |
| 19. | Hinckley | 6.84% | 3.55%(+3.28)#17 | 4.37%(+2.47)#18 |
| 20. | Circleville | 6.26% | 3.55%(+2.71)#18 | 4.37%(+1.89)#19 |
| 21. | Bryce Canyon City | 6.11% | 3.55%(+2.56)#19 | 4.37%(+1.74)#20 |
| 22. | Thatcher | 5.97% | 3.55%(+2.41)#20 | 4.37%(+1.60)#21 |
| 23. | Heber | 5.96% | 3.55%(+2.41)#21 | 4.37%(+1.59)#22 |
| 24. | Torrey | 5.94% | 3.55%(+2.38)#22 | 4.37%(+1.57)#23 |
| 25. | Moab | 5.89% | 3.55%(+2.34)#23 | 4.37%(+1.52)#24 |
| 26. | Salt Lake City | 5.72% | 3.55%(+2.16)#24 | 4.37%(+1.35)#25 |
| 27. | Kamas | 5.64% | 3.55%(+2.09)#25 | 4.37%(+1.27)#26 |
| 28. | Gunnison | 5.63% | 3.55%(+2.08)#26 | 4.37%(+1.26)#27 |
| 29. | West Jordan | 5.41% | 3.55%(+1.86)#27 | 4.37%(+1.04)#28 |
| 30. | Park City | 5.33% | 3.55%(+1.78)#28 | 4.37%(+0.965)#29 |
| 31. | Riverdale | 5.33% | 3.55%(+1.77)#29 | 4.37%(+0.956)#30 |
| 32. | Orem | 5.28% | 3.55%(+1.73)#30 | 4.37%(+0.910)#31 |
| 33. | Sunset | 4.96% | 3.55%(+1.41)#31 | 4.37%(+0.590)#32 |
| 34. | Centerfield | 4.95% | 3.55%(+1.40)#32 | 4.37%(+0.582)#33 |
| 35. | Fountain Green | 4.80% | 3.55%(+1.25)#33 | 4.37%(+0.428)#34 |
| 36. | Tremonton | 4.67% | 3.55%(+1.12)#34 | 4.37%(+0.302)#35 |
| 37. | Provo | 4.65% | 3.55%(+1.10)#35 | 4.37%(+0.283)#36 |
| 38. | Silver Summit | 4.40% | 3.55%(+0.852)#36 | 4.37%(+0.034)#37 |
| 39. | Bear River City | 4.36% | 3.55%(+0.813)#37 | 4.37%(-0.005)#38 |
| 40. | Roosevelt | 4.34% | 3.55%(+0.791)#38 | 4.37%(-0.027)#39 |
| 41. | Payson | 4.25% | 3.55%(+0.698)#39 | 4.37%(-0.120)#40 |
| 42. | North Salt Lake | 4.17% | 3.55%(+0.622)#40 | 4.37%(-0.196)#41 |
| 43. | Nibley | 4.06% | 3.55%(+0.503)#41 | 4.37%(-0.315)#42 |
| 44. | Minersville | 4.02% | 3.55%(+0.470)#42 | 4.37%(-0.348)#43 |
| 45. | Beaver | 3.99% | 3.55%(+0.435)#43 | 4.37%(-0.383)#44 |
| 46. | Leamington | 3.96% | 3.55%(+0.408)#44 | 4.37%(-0.410)#45 |
| 47. | Springville | 3.88% | 3.55%(+0.324)#45 | 4.37%(-0.494)#46 |
| 48. | Midvale | 3.85% | 3.55%(+0.301)#46 | 4.37%(-0.517)#47 |
| 49. | Vineyard | 3.84% | 3.55%(+0.286)#47 | 4.37%(-0.532)#48 |
| 50. | St George | 3.82% | 3.55%(+0.269)#48 | 4.37%(-0.549)#49 |
| 51. | Hyrum | 3.73% | 3.55%(+0.177)#49 | 4.37%(-0.641)#50 |
| 52. | Roy | 3.62% | 3.55%(+0.065)#50 | 4.37%(-0.753)#51 |
| 53. | Harrisville | 3.53% | 3.55%(-0.020)#51 | 4.37%(-0.838)#52 |
| 54. | Salina | 3.44% | 3.55%(-0.112)#52 | 4.37%(-0.930)#53 |
| 55. | Cedar City | 3.39% | 3.55%(-0.159)#53 | 4.37%(-0.977)#54 |
| 56. | Logan | 3.39% | 3.55%(-0.164)#54 | 4.37%(-0.982)#55 |
| 57. | Daniel | 3.38% | 3.55%(-0.176)#55 | 4.37%(-0.994)#56 |
| 58. | North Logan | 3.31% | 3.55%(-0.246)#56 | 4.37%(-1.06)#57 |
| 59. | Elsinore | 3.30% | 3.55%(-0.252)#57 | 4.37%(-1.07)#58 |
| 60. | Clearfield | 3.27% | 3.55%(-0.283)#58 | 4.37%(-1.10)#59 |
| 61. | Smithfield | 3.13% | 3.55%(-0.426)#59 | 4.37%(-1.24)#60 |
| 62. | Springdale | 3.08% | 3.55%(-0.468)#60 | 4.37%(-1.29)#61 |
| 63. | Hurricane | 3.07% | 3.55%(-0.480)#61 | 4.37%(-1.30)#62 |
| 64. | Hoytsville | 2.99% | 3.55%(-0.561)#62 | 4.37%(-1.38)#63 |
| 65. | Cornish | 2.97% | 3.55%(-0.586)#63 | 4.37%(-1.40)#64 |
| 66. | West Mountain | 2.84% | 3.55%(-0.711)#64 | 4.37%(-1.53)#65 |
| 67. | American Fork | 2.82% | 3.55%(-0.730)#65 | 4.37%(-1.55)#66 |
| 68. | Santa Clara | 2.81% | 3.55%(-0.745)#66 | 4.37%(-1.56)#67 |
| 69. | Summit Park | 2.78% | 3.55%(-0.773)#67 | 4.37%(-1.59)#68 |
| 70. | Clinton | 2.75% | 3.55%(-0.803)#68 | 4.37%(-1.62)#69 |
| 71. | Mona | 2.70% | 3.55%(-0.854)#69 | 4.37%(-1.67)#70 |
| 72. | Layton | 2.68% | 3.55%(-0.871)#70 | 4.37%(-1.69)#71 |
| 73. | Huntington | 2.65% | 3.55%(-0.906)#71 | 4.37%(-1.72)#72 |
| 74. | Ballard | 2.59% | 3.55%(-0.964)#72 | 4.37%(-1.78)#73 |
| 75. | East Basin | 2.55% | 3.55%(-1.00)#73 | 4.37%(-1.82)#74 |
| 76. | Washington | 2.51% | 3.55%(-1.04)#74 | 4.37%(-1.86)#75 |
| 77. | Spanish Fork | 2.49% | 3.55%(-1.06)#75 | 4.37%(-1.88)#76 |
| 78. | Oak City | 2.39% | 3.55%(-1.16)#76 | 4.37%(-1.98)#77 |
| 79. | Pleasant Grove | 2.37% | 3.55%(-1.18)#77 | 4.37%(-2.00)#78 |
| 80. | Santaquin | 2.32% | 3.55%(-1.23)#78 | 4.37%(-2.05)#79 |
| 81. | South Ogden | 2.29% | 3.55%(-1.26)#79 | 4.37%(-2.08)#80 |
| 82. | Elmo | 2.26% | 3.55%(-1.29)#80 | 4.37%(-2.11)#81 |
| 83. | Mount Pleasant | 2.26% | 3.55%(-1.29)#81 | 4.37%(-2.11)#82 |
| 84. | Pleasant View | 2.25% | 3.55%(-1.30)#82 | 4.37%(-2.12)#83 |
| 85. | Toquerville | 2.16% | 3.55%(-1.39)#83 | 4.37%(-2.21)#84 |
| 86. | Emigration Canyon | 2.13% | 3.55%(-1.42)#84 | 4.37%(-2.24)#85 |
| 87. | West Haven | 2.08% | 3.55%(-1.47)#85 | 4.37%(-2.29)#86 |
| 88. | Amalga | 2.02% | 3.55%(-1.53)#86 | 4.37%(-2.35)#87 |
| 89. | Hyde Park | 1.99% | 3.55%(-1.56)#87 | 4.37%(-2.38)#88 |
| 90. | Sandy | 1.99% | 3.55%(-1.56)#88 | 4.37%(-2.38)#89 |
| 91. | Spring City | 1.99% | 3.55%(-1.57)#89 | 4.37%(-2.38)#90 |
| 92. | South Weber | 1.98% | 3.55%(-1.57)#90 | 4.37%(-2.39)#91 |
| 93. | Myton | 1.95% | 3.55%(-1.60)#91 | 4.37%(-2.42)#92 |
| 94. | Eagle Mountain | 1.93% | 3.55%(-1.62)#92 | 4.37%(-2.44)#93 |
| 95. | Corinne | 1.93% | 3.55%(-1.62)#93 | 4.37%(-2.44)#94 |
| 96. | Price | 1.91% | 3.55%(-1.64)#94 | 4.37%(-2.46)#95 |
| 97. | Vernal | 1.89% | 3.55%(-1.66)#95 | 4.37%(-2.48)#96 |
| 98. | Stansbury Park | 1.84% | 3.55%(-1.72)#96 | 4.37%(-2.53)#97 |
| 99. | Tooele | 1.79% | 3.55%(-1.76)#97 | 4.37%(-2.58)#98 |
| 100. | Lynndyl | 1.68% | 3.55%(-1.87)#98 | 4.37%(-2.69)#99 |
Common Questions
What are the Top 10 Cities with the Highest Percentage of Immigrants from Central America in Utah?
Top 10 Cities with the Highest Percentage of Immigrants from Central America in Utah are:
#1
54.47%
#2
33.71%
#3
23.73%
#4
20.46%
#5
14.53%
#6
13.19%
#7
13.17%
#8
12.49%
#9
12.44%
#10
12.21%
What city has the Highest Percentage of Immigrants from Central America in Utah?
Garden has the Highest Percentage of Immigrants from Central America in Utah with 54.47%.
What is the Percentage of Immigrants from Central America in the State of Utah?
Percentage of Immigrants from Central America in Utah is 3.55%.
What is the Percentage of Immigrants from Central America in the United States?
Percentage of Immigrants from Central America in the United States is 4.37%.