Cities with the Highest Percentage of Immigrants from Central America in Indiana
RELATED REPORTS & OPTIONS
Central America
Indiana
Compare Cities
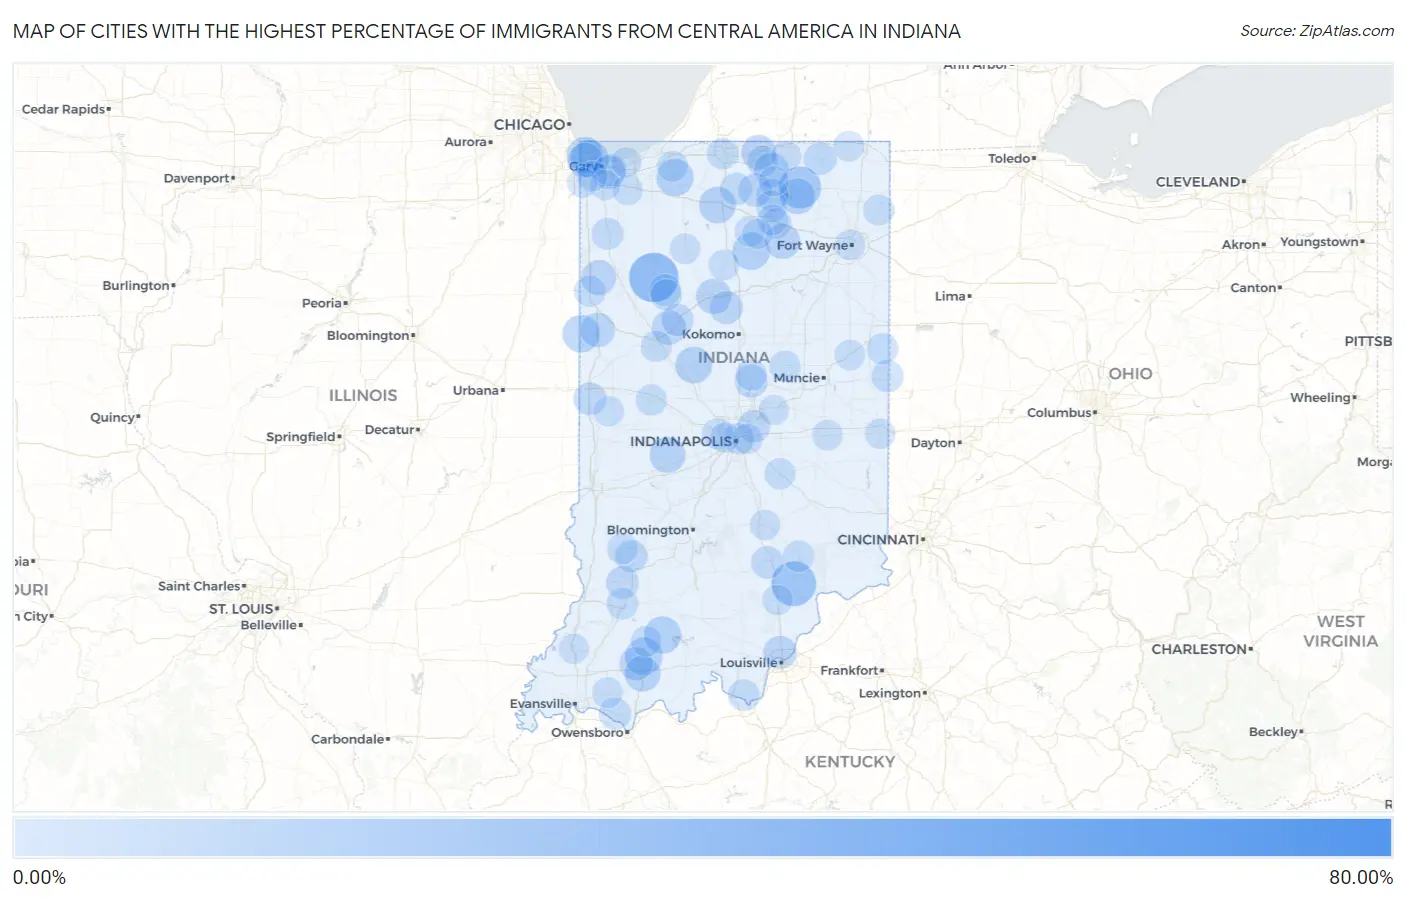
Map of Cities with the Highest Percentage of Immigrants from Central America in Indiana
0.00%
80.00%
Cities with the Highest Percentage of Immigrants from Central America in Indiana
| City | Central America | vs State | vs National | |
| 1. | Hillisburg | 77.38% | 1.89%(+75.5)#-1 | 4.37%(+73.0)#0 |
| 2. | Linn Grove | 59.83% | 1.89%(+57.9)#0 | 4.37%(+55.5)#1 |
| 3. | Fair Oaks | 54.26% | 1.89%(+52.4)#1 | 4.37%(+49.9)#2 |
| 4. | Monon | 34.07% | 1.89%(+32.2)#2 | 4.37%(+29.7)#3 |
| 5. | Deputy | 26.32% | 1.89%(+24.4)#3 | 4.37%(+21.9)#4 |
| 6. | Ligonier | 21.70% | 1.89%(+19.8)#4 | 4.37%(+17.3)#5 |
| 7. | Philadelphia | 16.72% | 1.89%(+14.8)#5 | 4.37%(+12.4)#6 |
| 8. | Huntingburg | 14.51% | 1.89%(+12.6)#6 | 4.37%(+10.1)#7 |
| 9. | East Chicago | 14.37% | 1.89%(+12.5)#7 | 4.37%(+10.0)#8 |
| 10. | Akron | 14.22% | 1.89%(+12.3)#8 | 4.37%(+9.85)#9 |
| 11. | Ambia | 13.91% | 1.89%(+12.0)#9 | 4.37%(+9.54)#10 |
| 12. | Dubois | 13.76% | 1.89%(+11.9)#10 | 4.37%(+9.39)#11 |
| 13. | Kingsbury | 13.66% | 1.89%(+11.8)#11 | 4.37%(+9.29)#12 |
| 14. | Brimfield | 13.03% | 1.89%(+11.1)#12 | 4.37%(+8.66)#13 |
| 15. | Frankfort | 12.97% | 1.89%(+11.1)#13 | 4.37%(+8.60)#14 |
| 16. | Plymouth | 12.96% | 1.89%(+11.1)#14 | 4.37%(+8.59)#15 |
| 17. | Whiting | 12.26% | 1.89%(+10.4)#15 | 4.37%(+7.89)#16 |
| 18. | Fillmore | 11.47% | 1.89%(+9.58)#16 | 4.37%(+7.10)#17 |
| 19. | Cromwell | 11.42% | 1.89%(+9.53)#17 | 4.37%(+7.05)#18 |
| 20. | Dale | 11.14% | 1.89%(+9.25)#18 | 4.37%(+6.77)#19 |
| 21. | Logansport | 10.62% | 1.89%(+8.73)#19 | 4.37%(+6.25)#20 |
| 22. | Sidney | 10.53% | 1.89%(+8.64)#20 | 4.37%(+6.16)#21 |
| 23. | Brook | 10.00% | 1.89%(+8.11)#21 | 4.37%(+5.63)#22 |
| 24. | Elkhart | 9.84% | 1.89%(+7.95)#22 | 4.37%(+5.47)#23 |
| 25. | Boswell | 9.48% | 1.89%(+7.59)#23 | 4.37%(+5.11)#24 |
| 26. | Hammond | 9.21% | 1.89%(+7.32)#24 | 4.37%(+4.84)#25 |
| 27. | Goshen | 9.04% | 1.89%(+7.15)#25 | 4.37%(+4.67)#26 |
| 28. | Americus | 8.74% | 1.89%(+6.85)#26 | 4.37%(+4.37)#27 |
| 29. | Holland | 8.01% | 1.89%(+6.12)#27 | 4.37%(+3.64)#28 |
| 30. | Clarksville | 7.47% | 1.89%(+5.57)#28 | 4.37%(+3.10)#29 |
| 31. | Nappanee | 7.23% | 1.89%(+5.34)#29 | 4.37%(+2.86)#30 |
| 32. | Walton | 7.14% | 1.89%(+5.25)#30 | 4.37%(+2.77)#31 |
| 33. | New Chicago | 7.11% | 1.89%(+5.21)#31 | 4.37%(+2.74)#32 |
| 34. | Arcadia | 6.72% | 1.89%(+4.83)#32 | 4.37%(+2.35)#33 |
| 35. | Romney | 6.71% | 1.89%(+4.82)#33 | 4.37%(+2.34)#34 |
| 36. | Lawrence | 6.36% | 1.89%(+4.47)#34 | 4.37%(+1.99)#35 |
| 37. | Plainville | 6.33% | 1.89%(+4.44)#35 | 4.37%(+1.96)#36 |
| 38. | Perrysville | 6.29% | 1.89%(+4.40)#36 | 4.37%(+1.92)#37 |
| 39. | Lagrange | 6.25% | 1.89%(+4.36)#37 | 4.37%(+1.88)#38 |
| 40. | Milford | 6.24% | 1.89%(+4.35)#38 | 4.37%(+1.87)#39 |
| 41. | Seymour | 6.20% | 1.89%(+4.31)#39 | 4.37%(+1.83)#40 |
| 42. | Lyons | 5.99% | 1.89%(+4.09)#40 | 4.37%(+1.62)#41 |
| 43. | Delphi | 5.93% | 1.89%(+4.04)#41 | 4.37%(+1.56)#42 |
| 44. | Bremen | 5.66% | 1.89%(+3.77)#42 | 4.37%(+1.29)#43 |
| 45. | Lake Station | 5.38% | 1.89%(+3.49)#43 | 4.37%(+1.01)#44 |
| 46. | Hatfield | 5.35% | 1.89%(+3.46)#44 | 4.37%(+0.978)#45 |
| 47. | Roselawn | 5.19% | 1.89%(+3.30)#45 | 4.37%(+0.818)#46 |
| 48. | Union City | 4.96% | 1.89%(+3.06)#46 | 4.37%(+0.586)#47 |
| 49. | Norway | 4.89% | 1.89%(+3.00)#47 | 4.37%(+0.517)#48 |
| 50. | Laconia | 4.76% | 1.89%(+2.87)#48 | 4.37%(+0.392)#49 |
| 51. | Benton | 4.47% | 1.89%(+2.58)#49 | 4.37%(+0.097)#50 |
| 52. | Vernon | 4.44% | 1.89%(+2.54)#50 | 4.37%(+0.065)#51 |
| 53. | Washington | 4.36% | 1.89%(+2.46)#51 | 4.37%(-0.014)#52 |
| 54. | Lafayette | 4.24% | 1.89%(+2.35)#52 | 4.37%(-0.129)#53 |
| 55. | Salamonia | 4.09% | 1.89%(+2.20)#53 | 4.37%(-0.276)#54 |
| 56. | Leesburg | 4.03% | 1.89%(+2.14)#54 | 4.37%(-0.336)#55 |
| 57. | Kentland | 4.03% | 1.89%(+2.14)#55 | 4.37%(-0.337)#56 |
| 58. | South Bend | 4.00% | 1.89%(+2.11)#56 | 4.37%(-0.371)#57 |
| 59. | Crawfordsville | 3.94% | 1.89%(+2.05)#57 | 4.37%(-0.428)#58 |
| 60. | Orestes | 3.86% | 1.89%(+1.96)#58 | 4.37%(-0.514)#59 |
| 61. | Monticello | 3.77% | 1.89%(+1.88)#59 | 4.37%(-0.598)#60 |
| 62. | Shelbyville | 3.64% | 1.89%(+1.75)#60 | 4.37%(-0.726)#61 |
| 63. | Indianapolis | 3.64% | 1.89%(+1.75)#61 | 4.37%(-0.730)#359 |
| 64. | Atlanta | 3.62% | 1.89%(+1.73)#62 | 4.37%(-0.748)#360 |
| 65. | Dunlap | 3.62% | 1.89%(+1.73)#63 | 4.37%(-0.752)#361 |
| 66. | Clermont | 3.51% | 1.89%(+1.62)#64 | 4.37%(-0.860)#362 |
| 67. | St Joe | 3.50% | 1.89%(+1.61)#65 | 4.37%(-0.874)#363 |
| 68. | La Porte | 3.49% | 1.89%(+1.59)#66 | 4.37%(-0.885)#364 |
| 69. | Young America | 3.33% | 1.89%(+1.44)#67 | 4.37%(-1.04)#365 |
| 70. | Linton | 3.24% | 1.89%(+1.35)#68 | 4.37%(-1.13)#366 |
| 71. | Boonville | 3.09% | 1.89%(+1.20)#69 | 4.37%(-1.28)#367 |
| 72. | Groverton | 3.06% | 1.89%(+1.17)#70 | 4.37%(-1.31)#368 |
| 73. | Lewisville | 3.00% | 1.89%(+1.11)#71 | 4.37%(-1.37)#369 |
| 74. | Winona Lake | 2.99% | 1.89%(+1.10)#72 | 4.37%(-1.38)#370 |
| 75. | Warsaw | 2.97% | 1.89%(+1.08)#73 | 4.37%(-1.40)#371 |
| 76. | Winamac | 2.91% | 1.89%(+1.02)#74 | 4.37%(-1.46)#372 |
| 77. | Jasper | 2.84% | 1.89%(+0.953)#75 | 4.37%(-1.53)#373 |
| 78. | Fulton | 2.82% | 1.89%(+0.932)#76 | 4.37%(-1.55)#374 |
| 79. | Redkey | 2.78% | 1.89%(+0.889)#77 | 4.37%(-1.59)#375 |
| 80. | Fort Wayne | 2.73% | 1.89%(+0.839)#78 | 4.37%(-1.64)#376 |
| 81. | Warren Park | 2.71% | 1.89%(+0.821)#79 | 4.37%(-1.66)#377 |
| 82. | Orland | 2.69% | 1.89%(+0.800)#80 | 4.37%(-1.68)#378 |
| 83. | Mentone | 2.65% | 1.89%(+0.762)#81 | 4.37%(-1.72)#379 |
| 84. | Columbus | 2.55% | 1.89%(+0.657)#82 | 4.37%(-1.82)#380 |
| 85. | Burket | 2.50% | 1.89%(+0.609)#83 | 4.37%(-1.87)#381 |
| 86. | Merrillville | 2.38% | 1.89%(+0.486)#84 | 4.37%(-1.99)#382 |
| 87. | Kingman | 2.33% | 1.89%(+0.435)#85 | 4.37%(-2.04)#383 |
| 88. | Griffith | 2.29% | 1.89%(+0.402)#86 | 4.37%(-2.08)#384 |
| 89. | Aberdeen | 2.28% | 1.89%(+0.387)#87 | 4.37%(-2.09)#385 |
| 90. | Middlebury | 2.26% | 1.89%(+0.366)#88 | 4.37%(-2.11)#386 |
| 91. | Enchanted Hills | 2.23% | 1.89%(+0.339)#89 | 4.37%(-2.14)#387 |
| 92. | Dyer | 2.21% | 1.89%(+0.315)#90 | 4.37%(-2.16)#388 |
| 93. | Burns Harbor | 2.20% | 1.89%(+0.309)#91 | 4.37%(-2.17)#389 |
| 94. | Princeton | 2.18% | 1.89%(+0.290)#92 | 4.37%(-2.19)#390 |
| 95. | Speedway | 2.17% | 1.89%(+0.278)#93 | 4.37%(-2.20)#391 |
| 96. | Rockford | 2.13% | 1.89%(+0.243)#94 | 4.37%(-2.24)#392 |
| 97. | Scottsburg | 2.13% | 1.89%(+0.242)#95 | 4.37%(-2.24)#393 |
| 98. | New Paris | 2.13% | 1.89%(+0.234)#96 | 4.37%(-2.25)#394 |
| 99. | Ingalls | 2.12% | 1.89%(+0.230)#97 | 4.37%(-2.25)#395 |
| 100. | Richmond | 2.12% | 1.89%(+0.230)#98 | 4.37%(-2.25)#396 |
Common Questions
What are the Top 10 Cities with the Highest Percentage of Immigrants from Central America in Indiana?
Top 10 Cities with the Highest Percentage of Immigrants from Central America in Indiana are:
#1
34.07%
#2
26.32%
#3
21.70%
#4
14.51%
#5
14.37%
#6
14.22%
#7
13.91%
#8
13.76%
#9
13.66%
#10
12.97%
What city has the Highest Percentage of Immigrants from Central America in Indiana?
Monon has the Highest Percentage of Immigrants from Central America in Indiana with 34.07%.
What is the Percentage of Immigrants from Central America in the State of Indiana?
Percentage of Immigrants from Central America in Indiana is 1.89%.
What is the Percentage of Immigrants from Central America in the United States?
Percentage of Immigrants from Central America in the United States is 4.37%.