Cities with the Highest Percentage of Immigrants from Central America in North Carolina
RELATED REPORTS & OPTIONS
Central America
North Carolina
Compare Cities
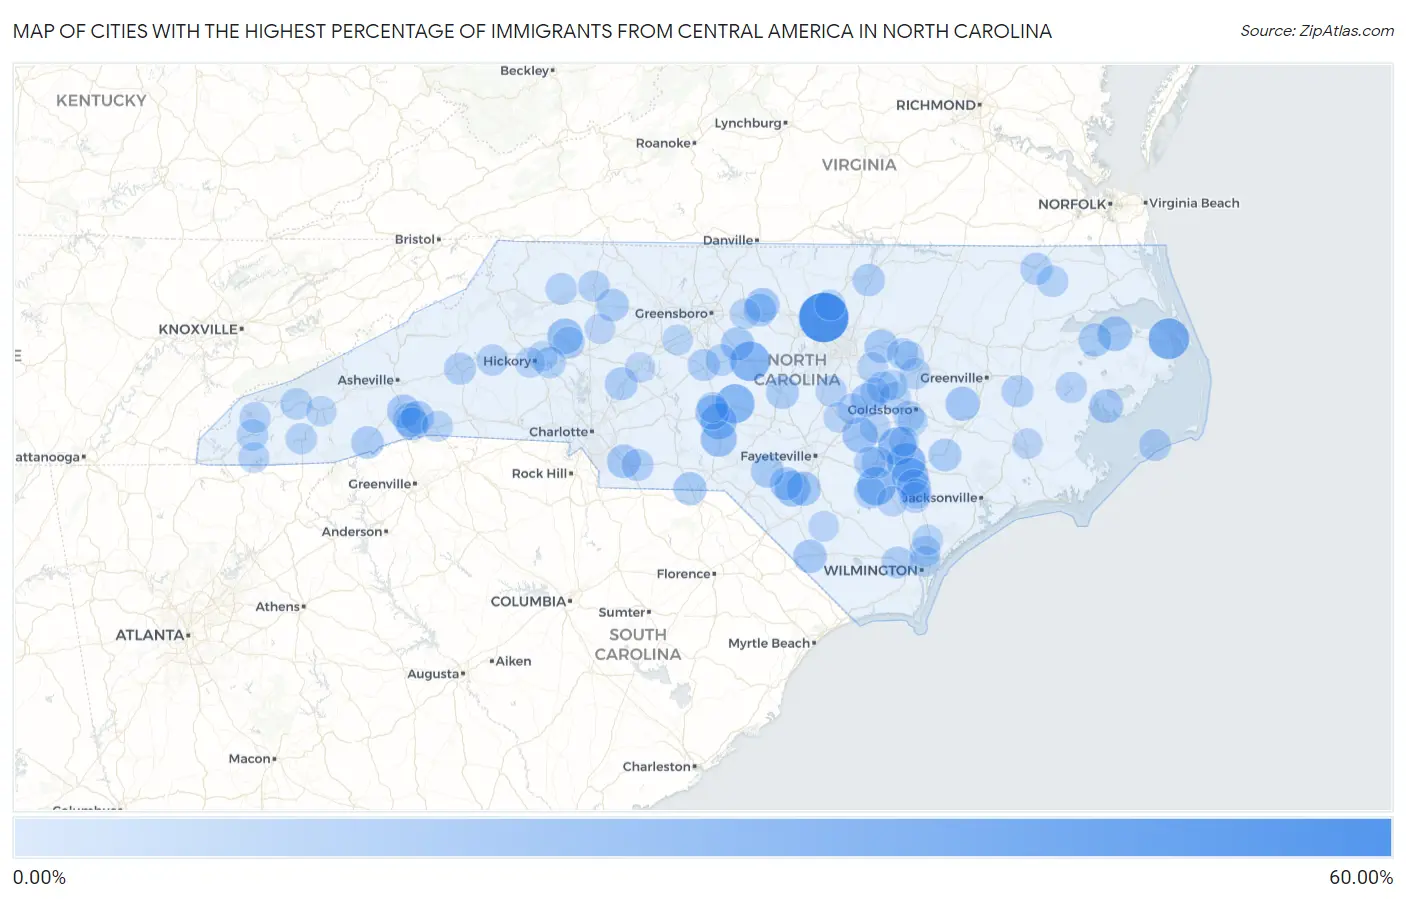
Map of Cities with the Highest Percentage of Immigrants from Central America in North Carolina
0.00%
60.00%
Cities with the Highest Percentage of Immigrants from Central America in North Carolina
| City | Central America | vs State | vs National | |
| 1. | Gorman | 50.37% | 3.08%(+47.3)#-1 | 4.37%(+46.0)#0 |
| 2. | Manns Harbor | 29.87% | 3.08%(+26.8)#0 | 4.37%(+25.5)#1 |
| 3. | Siler City | 26.94% | 3.08%(+23.9)#1 | 4.37%(+22.6)#2 |
| 4. | Robbins | 26.21% | 3.08%(+23.1)#2 | 4.37%(+21.8)#3 |
| 5. | Warsaw | 24.75% | 3.08%(+21.7)#3 | 4.37%(+20.4)#4 |
| 6. | Ingold | 23.91% | 3.08%(+20.8)#4 | 4.37%(+19.5)#5 |
| 7. | Faison | 23.89% | 3.08%(+20.8)#5 | 4.37%(+19.5)#6 |
| 8. | Dudley | 22.85% | 3.08%(+19.8)#6 | 4.37%(+18.5)#7 |
| 9. | Magnolia | 21.29% | 3.08%(+18.2)#7 | 4.37%(+16.9)#8 |
| 10. | Candor | 19.09% | 3.08%(+16.0)#8 | 4.37%(+14.7)#9 |
| 11. | Norman | 19.08% | 3.08%(+16.0)#9 | 4.37%(+14.7)#10 |
| 12. | Rennert | 18.33% | 3.08%(+15.3)#10 | 4.37%(+14.0)#11 |
| 13. | Hiddenite | 17.87% | 3.08%(+14.8)#11 | 4.37%(+13.5)#12 |
| 14. | Spivey S Corner | 17.39% | 3.08%(+14.3)#12 | 4.37%(+13.0)#13 |
| 15. | Columbia | 16.25% | 3.08%(+13.2)#13 | 4.37%(+11.9)#14 |
| 16. | Biscoe | 15.65% | 3.08%(+12.6)#14 | 4.37%(+11.3)#15 |
| 17. | Emma | 15.49% | 3.08%(+12.4)#15 | 4.37%(+11.1)#16 |
| 18. | St Pauls | 14.90% | 3.08%(+11.8)#16 | 4.37%(+10.5)#17 |
| 19. | Hookerton | 14.88% | 3.08%(+11.8)#17 | 4.37%(+10.5)#18 |
| 20. | Rose Hill | 14.65% | 3.08%(+11.6)#18 | 4.37%(+10.3)#19 |
| 21. | Green Level | 14.27% | 3.08%(+11.2)#19 | 4.37%(+9.90)#20 |
| 22. | Barker Heights | 14.11% | 3.08%(+11.0)#20 | 4.37%(+9.74)#21 |
| 23. | Bowdens | 14.02% | 3.08%(+10.9)#21 | 4.37%(+9.65)#22 |
| 24. | Swan Quarter | 13.65% | 3.08%(+10.6)#22 | 4.37%(+9.28)#23 |
| 25. | Four Oaks | 13.49% | 3.08%(+10.4)#23 | 4.37%(+9.12)#24 |
| 26. | Zebulon | 13.42% | 3.08%(+10.3)#24 | 4.37%(+9.05)#25 |
| 27. | Mountain Home | 13.38% | 3.08%(+10.3)#25 | 4.37%(+9.01)#26 |
| 28. | Cerro Gordo | 13.35% | 3.08%(+10.3)#26 | 4.37%(+8.98)#27 |
| 29. | Monroe | 13.34% | 3.08%(+10.3)#27 | 4.37%(+8.97)#28 |
| 30. | Liberty | 13.05% | 3.08%(+9.97)#28 | 4.37%(+8.68)#29 |
| 31. | Shannon | 12.65% | 3.08%(+9.57)#29 | 4.37%(+8.28)#30 |
| 32. | Mcfarlan | 12.61% | 3.08%(+9.53)#30 | 4.37%(+8.24)#31 |
| 33. | Creswell | 12.50% | 3.08%(+9.42)#31 | 4.37%(+8.13)#32 |
| 34. | Dana | 12.48% | 3.08%(+9.40)#32 | 4.37%(+8.11)#33 |
| 35. | Bowmore | 12.31% | 3.08%(+9.23)#33 | 4.37%(+7.94)#34 |
| 36. | Sanford | 12.12% | 3.08%(+9.04)#34 | 4.37%(+7.75)#35 |
| 37. | Haw River | 12.06% | 3.08%(+8.98)#35 | 4.37%(+7.69)#36 |
| 38. | China Grove | 12.00% | 3.08%(+8.92)#36 | 4.37%(+7.63)#37 |
| 39. | East Flat Rock | 12.00% | 3.08%(+8.92)#37 | 4.37%(+7.63)#38 |
| 40. | Pink Hill | 11.74% | 3.08%(+8.66)#38 | 4.37%(+7.37)#39 |
| 41. | Yadkinville | 11.61% | 3.08%(+8.53)#39 | 4.37%(+7.24)#40 |
| 42. | Rosman | 11.37% | 3.08%(+8.29)#40 | 4.37%(+7.00)#41 |
| 43. | South Henderson | 11.20% | 3.08%(+8.12)#41 | 4.37%(+6.83)#42 |
| 44. | Arrowhead Beach | 10.62% | 3.08%(+7.54)#42 | 4.37%(+6.25)#43 |
| 45. | Winton | 10.39% | 3.08%(+7.31)#43 | 4.37%(+6.02)#44 |
| 46. | Clinton | 10.26% | 3.08%(+7.18)#44 | 4.37%(+5.89)#45 |
| 47. | Sandy Creek | 10.20% | 3.08%(+7.12)#45 | 4.37%(+5.83)#46 |
| 48. | Wingate | 10.17% | 3.08%(+7.09)#46 | 4.37%(+5.80)#47 |
| 49. | Chocowinity | 10.10% | 3.08%(+7.02)#47 | 4.37%(+5.73)#48 |
| 50. | Marion | 10.10% | 3.08%(+7.02)#48 | 4.37%(+5.73)#49 |
| 51. | Asheboro | 9.97% | 3.08%(+6.89)#49 | 4.37%(+5.60)#50 |
| 52. | Garland | 9.94% | 3.08%(+6.86)#50 | 4.37%(+5.57)#51 |
| 53. | Stony Point | 9.91% | 3.08%(+6.83)#51 | 4.37%(+5.54)#52 |
| 54. | Bonnetsville | 9.87% | 3.08%(+6.79)#52 | 4.37%(+5.50)#53 |
| 55. | Ocracoke | 9.79% | 3.08%(+6.71)#53 | 4.37%(+5.42)#54 |
| 56. | Franklinville | 9.40% | 3.08%(+6.32)#54 | 4.37%(+5.03)#55 |
| 57. | Bryson City | 9.16% | 3.08%(+6.08)#55 | 4.37%(+4.79)#56 |
| 58. | Hays | 9.14% | 3.08%(+6.06)#56 | 4.37%(+4.77)#57 |
| 59. | Harrellsville | 9.13% | 3.08%(+6.05)#57 | 4.37%(+4.76)#58 |
| 60. | Selma | 8.98% | 3.08%(+5.90)#58 | 4.37%(+4.61)#59 |
| 61. | Conover | 8.83% | 3.08%(+5.75)#59 | 4.37%(+4.46)#60 |
| 62. | Andrews | 8.82% | 3.08%(+5.74)#60 | 4.37%(+4.45)#61 |
| 63. | Princeton | 8.77% | 3.08%(+5.69)#61 | 4.37%(+4.40)#62 |
| 64. | Elkin | 8.54% | 3.08%(+5.46)#62 | 4.37%(+4.17)#63 |
| 65. | Bailey | 8.50% | 3.08%(+5.42)#63 | 4.37%(+4.13)#64 |
| 66. | Belhaven | 8.42% | 3.08%(+5.34)#64 | 4.37%(+4.05)#65 |
| 67. | Franklin | 8.41% | 3.08%(+5.33)#65 | 4.37%(+4.04)#66 |
| 68. | Lucama | 8.41% | 3.08%(+5.33)#66 | 4.37%(+4.04)#67 |
| 69. | Morganton | 8.38% | 3.08%(+5.30)#67 | 4.37%(+4.01)#68 |
| 70. | Robbinsville | 8.37% | 3.08%(+5.29)#68 | 4.37%(+4.00)#69 |
| 71. | Angier | 8.15% | 3.08%(+5.07)#69 | 4.37%(+3.78)#70 |
| 72. | Castle Hayne | 8.14% | 3.08%(+5.06)#70 | 4.37%(+3.77)#71 |
| 73. | Wrightsboro | 8.10% | 3.08%(+5.02)#71 | 4.37%(+3.73)#72 |
| 74. | Mar Mac | 8.01% | 3.08%(+4.93)#72 | 4.37%(+3.64)#73 |
| 75. | Wallace | 7.96% | 3.08%(+4.88)#73 | 4.37%(+3.59)#74 |
| 76. | Hayesville | 7.79% | 3.08%(+4.71)#74 | 4.37%(+3.42)#75 |
| 77. | Newton Grove | 7.74% | 3.08%(+4.66)#75 | 4.37%(+3.37)#76 |
| 78. | Benson | 7.62% | 3.08%(+4.54)#76 | 4.37%(+3.25)#77 |
| 79. | Rocky Point | 7.55% | 3.08%(+4.47)#77 | 4.37%(+3.18)#78 |
| 80. | Columbus | 7.45% | 3.08%(+4.37)#78 | 4.37%(+3.08)#79 |
| 81. | Archer Lodge | 7.44% | 3.08%(+4.36)#79 | 4.37%(+3.07)#80 |
| 82. | Burlington | 7.35% | 3.08%(+4.27)#80 | 4.37%(+2.98)#81 |
| 83. | Butner | 7.32% | 3.08%(+4.24)#81 | 4.37%(+2.95)#82 |
| 84. | Star | 7.28% | 3.08%(+4.20)#82 | 4.37%(+2.91)#83 |
| 85. | Thomasville | 7.28% | 3.08%(+4.20)#83 | 4.37%(+2.91)#84 |
| 86. | Teachey | 6.97% | 3.08%(+3.89)#84 | 4.37%(+2.60)#85 |
| 87. | Bridgeton | 6.95% | 3.08%(+3.87)#85 | 4.37%(+2.58)#86 |
| 88. | Harmony | 6.85% | 3.08%(+3.77)#86 | 4.37%(+2.48)#87 |
| 89. | Bladenboro | 6.84% | 3.08%(+3.76)#87 | 4.37%(+2.47)#88 |
| 90. | Erwin | 6.84% | 3.08%(+3.76)#88 | 4.37%(+2.47)#89 |
| 91. | Harrells | 6.70% | 3.08%(+3.62)#89 | 4.37%(+2.33)#90 |
| 92. | Sylva | 6.65% | 3.08%(+3.57)#90 | 4.37%(+2.28)#91 |
| 93. | Sims | 6.65% | 3.08%(+3.57)#91 | 4.37%(+2.28)#92 |
| 94. | St Stephens | 6.61% | 3.08%(+3.53)#92 | 4.37%(+2.24)#93 |
| 95. | Long View | 6.60% | 3.08%(+3.52)#93 | 4.37%(+2.23)#94 |
| 96. | Micro | 6.50% | 3.08%(+3.42)#94 | 4.37%(+2.13)#95 |
| 97. | Brogden | 6.41% | 3.08%(+3.33)#95 | 4.37%(+2.04)#96 |
| 98. | Smithfield | 6.12% | 3.08%(+3.04)#96 | 4.37%(+1.75)#97 |
| 99. | East Spencer | 6.09% | 3.08%(+3.00)#97 | 4.37%(+1.72)#98 |
| 100. | Calypso | 6.06% | 3.08%(+2.98)#98 | 4.37%(+1.69)#99 |
Common Questions
What are the Top 10 Cities with the Highest Percentage of Immigrants from Central America in North Carolina?
Top 10 Cities with the Highest Percentage of Immigrants from Central America in North Carolina are:
#1
50.37%
#2
29.87%
#3
26.94%
#4
26.21%
#5
24.75%
#6
23.91%
#7
23.89%
#8
21.29%
#9
19.09%
#10
19.08%
What city has the Highest Percentage of Immigrants from Central America in North Carolina?
Gorman has the Highest Percentage of Immigrants from Central America in North Carolina with 50.37%.
What is the Percentage of Immigrants from Central America in the State of North Carolina?
Percentage of Immigrants from Central America in North Carolina is 3.08%.
What is the Percentage of Immigrants from Central America in the United States?
Percentage of Immigrants from Central America in the United States is 4.37%.