Cities with the Highest Percentage of Immigrants from Central America in North Dakota
RELATED REPORTS & OPTIONS
Central America
North Dakota
Compare Cities
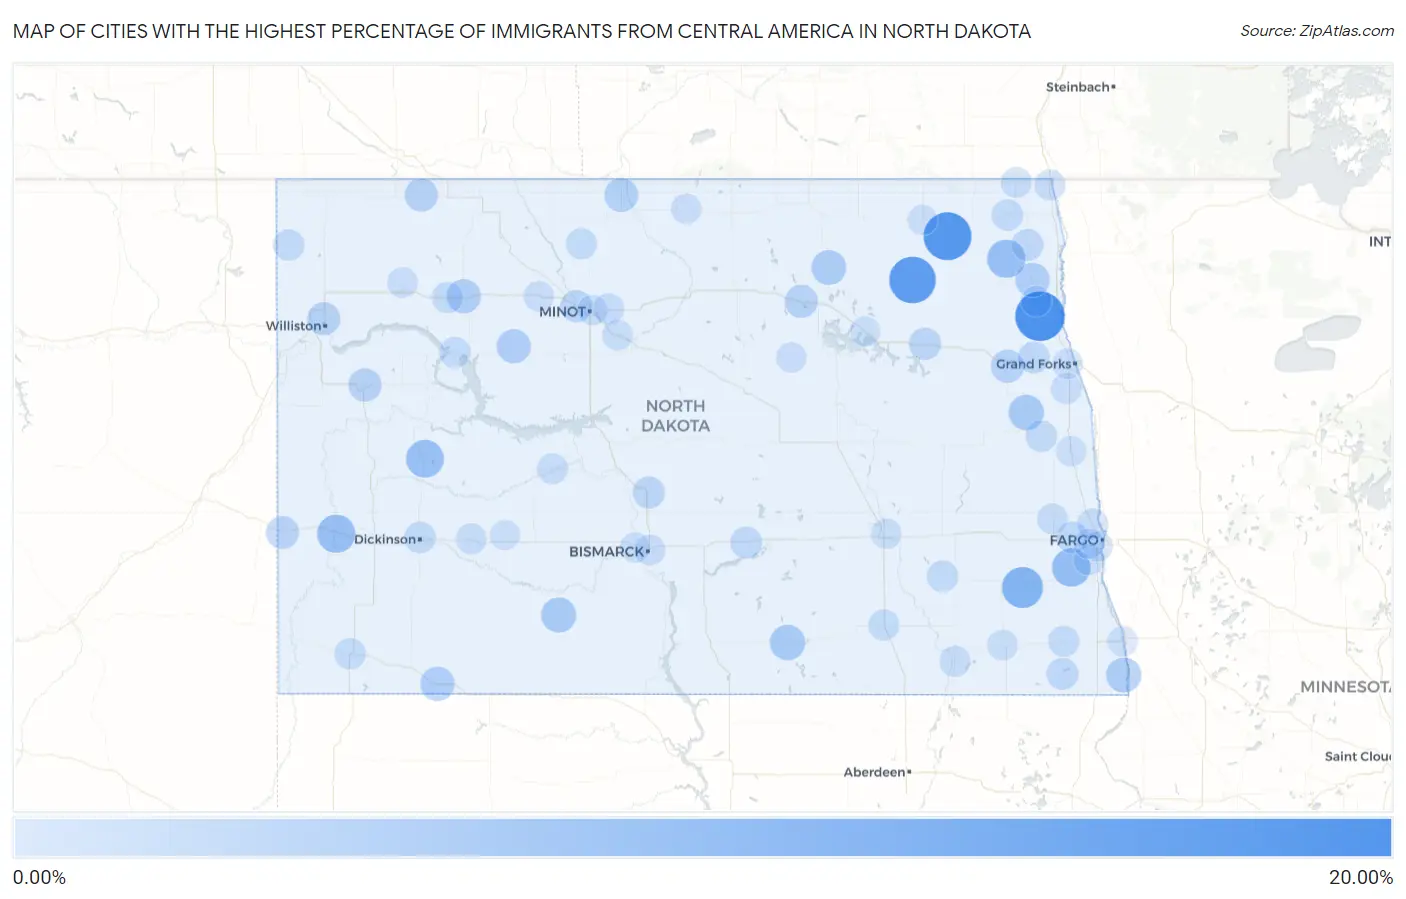
Map of Cities with the Highest Percentage of Immigrants from Central America in North Dakota
0.00%
20.00%
Cities with the Highest Percentage of Immigrants from Central America in North Dakota
| City | Central America | vs State | vs National | |
| 1. | Ardoch | 20.00% | 0.48%(+19.5)#-1 | 4.37%(+15.6)#0 |
| 2. | Osnabrock | 18.29% | 0.48%(+17.8)#0 | 4.37%(+13.9)#1 |
| 3. | Edmore | 16.89% | 0.48%(+16.4)#1 | 4.37%(+12.5)#2 |
| 4. | Sheldon | 10.97% | 0.48%(+10.5)#2 | 4.37%(+6.60)#3 |
| 5. | Davenport | 8.30% | 0.48%(+7.82)#3 | 4.37%(+3.93)#4 |
| 6. | Hoople | 7.95% | 0.48%(+7.47)#4 | 4.37%(+3.58)#5 |
| 7. | Medora | 7.95% | 0.48%(+7.47)#5 | 4.37%(+3.58)#6 |
| 8. | Killdeer | 7.66% | 0.48%(+7.18)#6 | 4.37%(+3.29)#7 |
| 9. | Wishek | 5.15% | 0.48%(+4.67)#7 | 4.37%(+0.782)#8 |
| 10. | Hatton | 5.14% | 0.48%(+4.66)#8 | 4.37%(+0.770)#9 |
| 11. | Carson | 4.86% | 0.48%(+4.38)#9 | 4.37%(+0.491)#10 |
| 12. | Fairmount | 4.75% | 0.48%(+4.27)#10 | 4.37%(+0.378)#11 |
| 13. | Cando | 4.60% | 0.48%(+4.12)#11 | 4.37%(+0.228)#12 |
| 14. | Stanley | 4.11% | 0.48%(+3.63)#12 | 4.37%(-0.259)#13 |
| 15. | Hettinger | 4.01% | 0.48%(+3.53)#13 | 4.37%(-0.355)#14 |
| 16. | Grafton | 3.99% | 0.48%(+3.51)#14 | 4.37%(-0.381)#15 |
| 17. | Plaza | 3.90% | 0.48%(+3.42)#15 | 4.37%(-0.474)#16 |
| 18. | Westhope | 3.61% | 0.48%(+3.13)#16 | 4.37%(-0.759)#17 |
| 19. | Watford City | 3.03% | 0.48%(+2.55)#17 | 4.37%(-1.34)#18 |
| 20. | Columbus | 3.03% | 0.48%(+2.55)#18 | 4.37%(-1.34)#19 |
| 21. | Larimore | 2.98% | 0.48%(+2.50)#19 | 4.37%(-1.39)#20 |
| 22. | Leeds | 2.97% | 0.48%(+2.49)#20 | 4.37%(-1.40)#21 |
| 23. | Williston | 2.94% | 0.48%(+2.46)#21 | 4.37%(-1.43)#22 |
| 24. | Beach | 2.61% | 0.48%(+2.13)#22 | 4.37%(-1.76)#23 |
| 25. | Burlington | 2.06% | 0.48%(+1.58)#23 | 4.37%(-2.31)#24 |
| 26. | Lakota | 1.98% | 0.48%(+1.50)#24 | 4.37%(-2.39)#25 |
| 27. | Wilton | 1.93% | 0.48%(+1.45)#25 | 4.37%(-2.44)#26 |
| 28. | Mapleton | 1.74% | 0.48%(+1.26)#26 | 4.37%(-2.63)#27 |
| 29. | Lidgerwood | 1.68% | 0.48%(+1.20)#27 | 4.37%(-2.69)#28 |
| 30. | St Thomas | 1.66% | 0.48%(+1.18)#28 | 4.37%(-2.71)#29 |
| 31. | Grand Forks Afb | 1.66% | 0.48%(+1.18)#29 | 4.37%(-2.71)#30 |
| 32. | Steele | 1.59% | 0.48%(+1.11)#30 | 4.37%(-2.78)#31 |
| 33. | Mayville | 1.33% | 0.48%(+0.851)#31 | 4.37%(-3.04)#32 |
| 34. | Litchville | 1.32% | 0.48%(+0.835)#32 | 4.37%(-3.05)#33 |
| 35. | Dickinson | 1.31% | 0.48%(+0.829)#33 | 4.37%(-3.06)#34 |
| 36. | Cavalier | 1.25% | 0.48%(+0.769)#34 | 4.37%(-3.12)#35 |
| 37. | Grenora | 1.22% | 0.48%(+0.735)#35 | 4.37%(-3.15)#36 |
| 38. | Ross | 1.06% | 0.48%(+0.583)#36 | 4.37%(-3.31)#37 |
| 39. | Bowman | 1.03% | 0.48%(+0.552)#37 | 4.37%(-3.34)#38 |
| 40. | Wyndmere | 0.99% | 0.48%(+0.509)#38 | 4.37%(-3.38)#39 |
| 41. | New Town | 0.92% | 0.48%(+0.440)#39 | 4.37%(-3.45)#40 |
| 42. | Edgeley | 0.88% | 0.48%(+0.404)#40 | 4.37%(-3.49)#41 |
| 43. | Lansford | 0.87% | 0.48%(+0.389)#41 | 4.37%(-3.50)#42 |
| 44. | Richardton | 0.78% | 0.48%(+0.300)#42 | 4.37%(-3.59)#43 |
| 45. | Pembina | 0.72% | 0.48%(+0.244)#43 | 4.37%(-3.65)#44 |
| 46. | Surrey | 0.69% | 0.48%(+0.214)#44 | 4.37%(-3.68)#45 |
| 47. | Oakes | 0.61% | 0.48%(+0.131)#45 | 4.37%(-3.76)#46 |
| 48. | Hazen | 0.58% | 0.48%(+0.103)#46 | 4.37%(-3.79)#47 |
| 49. | Amenia | 0.55% | 0.48%(+0.072)#47 | 4.37%(-3.82)#48 |
| 50. | Harwood | 0.53% | 0.48%(+0.046)#48 | 4.37%(-3.84)#49 |
| 51. | Neche | 0.51% | 0.48%(+0.032)#49 | 4.37%(-3.86)#50 |
| 52. | Minto | 0.49% | 0.48%(+0.013)#50 | 4.37%(-3.88)#51 |
| 53. | Gwinner | 0.47% | 0.48%(-0.011)#51 | 4.37%(-3.90)#52 |
| 54. | Sawyer | 0.38% | 0.48%(-0.098)#52 | 4.37%(-3.99)#53 |
| 55. | Thompson | 0.38% | 0.48%(-0.101)#53 | 4.37%(-3.99)#54 |
| 56. | Bismarck | 0.38% | 0.48%(-0.104)#54 | 4.37%(-3.99)#55 |
| 57. | Bottineau | 0.33% | 0.48%(-0.148)#55 | 4.37%(-4.04)#56 |
| 58. | Minot | 0.33% | 0.48%(-0.152)#56 | 4.37%(-4.04)#57 |
| 59. | Tioga | 0.29% | 0.48%(-0.190)#57 | 4.37%(-4.08)#58 |
| 60. | Maddock | 0.27% | 0.48%(-0.210)#58 | 4.37%(-4.10)#59 |
| 61. | Grand Forks | 0.25% | 0.48%(-0.230)#59 | 4.37%(-4.12)#60 |
| 62. | Berthold | 0.22% | 0.48%(-0.261)#60 | 4.37%(-4.15)#61 |
| 63. | Horace | 0.20% | 0.48%(-0.279)#61 | 4.37%(-4.17)#62 |
| 64. | Fargo | 0.19% | 0.48%(-0.296)#62 | 4.37%(-4.18)#63 |
| 65. | Jamestown | 0.17% | 0.48%(-0.311)#63 | 4.37%(-4.20)#64 |
| 66. | Wahpeton | 0.16% | 0.48%(-0.318)#64 | 4.37%(-4.21)#65 |
| 67. | Hebron | 0.13% | 0.48%(-0.348)#65 | 4.37%(-4.24)#66 |
| 68. | West Fargo | 0.13% | 0.48%(-0.349)#66 | 4.37%(-4.24)#67 |
| 69. | Hillsboro | 0.12% | 0.48%(-0.360)#67 | 4.37%(-4.25)#68 |
| 70. | Mandan | 0.079% | 0.48%(-0.402)#68 | 4.37%(-4.29)#69 |
| 71. | Langdon | 0.058% | 0.48%(-0.423)#69 | 4.37%(-4.31)#70 |
| 72. | Devils Lake | 0.042% | 0.48%(-0.439)#70 | 4.37%(-4.33)#71 |
Common Questions
What are the Top 10 Cities with the Highest Percentage of Immigrants from Central America in North Dakota?
Top 10 Cities with the Highest Percentage of Immigrants from Central America in North Dakota are:
What city has the Highest Percentage of Immigrants from Central America in North Dakota?
Ardoch has the Highest Percentage of Immigrants from Central America in North Dakota with 20.00%.
What is the Percentage of Immigrants from Central America in the State of North Dakota?
Percentage of Immigrants from Central America in North Dakota is 0.48%.
What is the Percentage of Immigrants from Central America in the United States?
Percentage of Immigrants from Central America in the United States is 4.37%.