Oak Grove, IL
Oak Grove Map
Oak Grove Overview
353
TOTAL POPULATION
182
MALE POPULATION
171
FEMALE POPULATION
106.43
MALES / 100 FEMALES
93.96
FEMALES / 100 MALES
56.4
MEDIAN AGE
2.2
AVG FAMILY SIZE
1.8
AVG HOUSEHOLD SIZE
$27,182
PER CAPITA INCOME
$42,206
AVG FAMILY INCOME
$40,486
AVG HOUSEHOLD INCOME
0.37
INEQUALITY / GINI INDEX
187
LABOR FORCE [ PEOPLE ]
59.4%
PERCENT IN LABOR FORCE
7.5%
UNEMPLOYMENT RATE
Oak Grove Area Codes
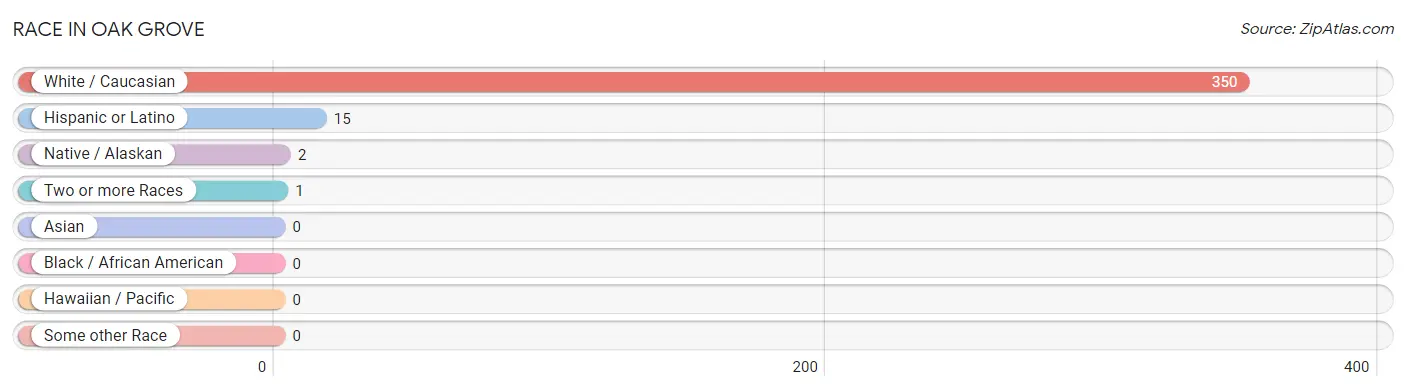
Race in Oak Grove
The most populous races in Oak Grove are White / Caucasian (350 | 99.2%), Hispanic or Latino (15 | 4.3%), and Native / Alaskan (2 | 0.6%).
| Race | # Population | % Population |
| Asian | 0 | 0.0% |
| Black / African American | 0 | 0.0% |
| Hawaiian / Pacific | 0 | 0.0% |
| Hispanic or Latino | 15 | 4.3% |
| Native / Alaskan | 2 | 0.6% |
| White / Caucasian | 350 | 99.2% |
| Two or more Races | 1 | 0.3% |
| Some other Race | 0 | 0.0% |
| Total | 353 | 100.0% |
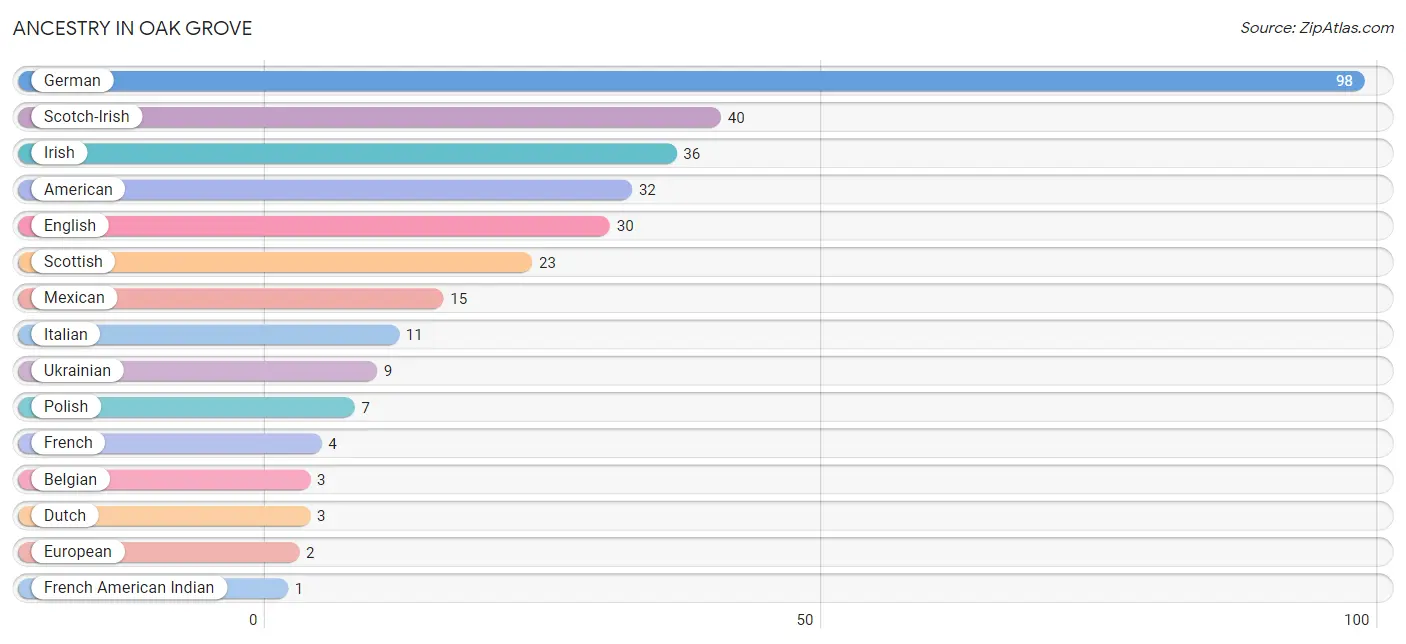
Ancestry in Oak Grove
The most populous ancestries reported in Oak Grove are German (98 | 27.8%), Scotch-Irish (40 | 11.3%), Irish (36 | 10.2%), American (32 | 9.1%), and English (30 | 8.5%), together accounting for 66.9% of all Oak Grove residents.
| Ancestry | # Population | % Population |
| American | 32 | 9.1% |
| Belgian | 3 | 0.9% |
| Dutch | 3 | 0.9% |
| English | 30 | 8.5% |
| European | 2 | 0.6% |
| French | 4 | 1.1% |
| French American Indian | 1 | 0.3% |
| French Canadian | 1 | 0.3% |
| German | 98 | 27.8% |
| Irish | 36 | 10.2% |
| Italian | 11 | 3.1% |
| Mexican | 15 | 4.3% |
| Polish | 7 | 2.0% |
| Scotch-Irish | 40 | 11.3% |
| Scottish | 23 | 6.5% |
| Ukrainian | 9 | 2.5% | View All 16 Rows |
Immigrants in Oak Grove
The most numerous immigrant groups reported in Oak Grove came from , and Canada (2 | 0.6%), together accounting for 0.6% of all Oak Grove residents.

| Immigration Origin | # Population | % Population |
| Canada | 2 | 0.6% | View All 1 Rows |
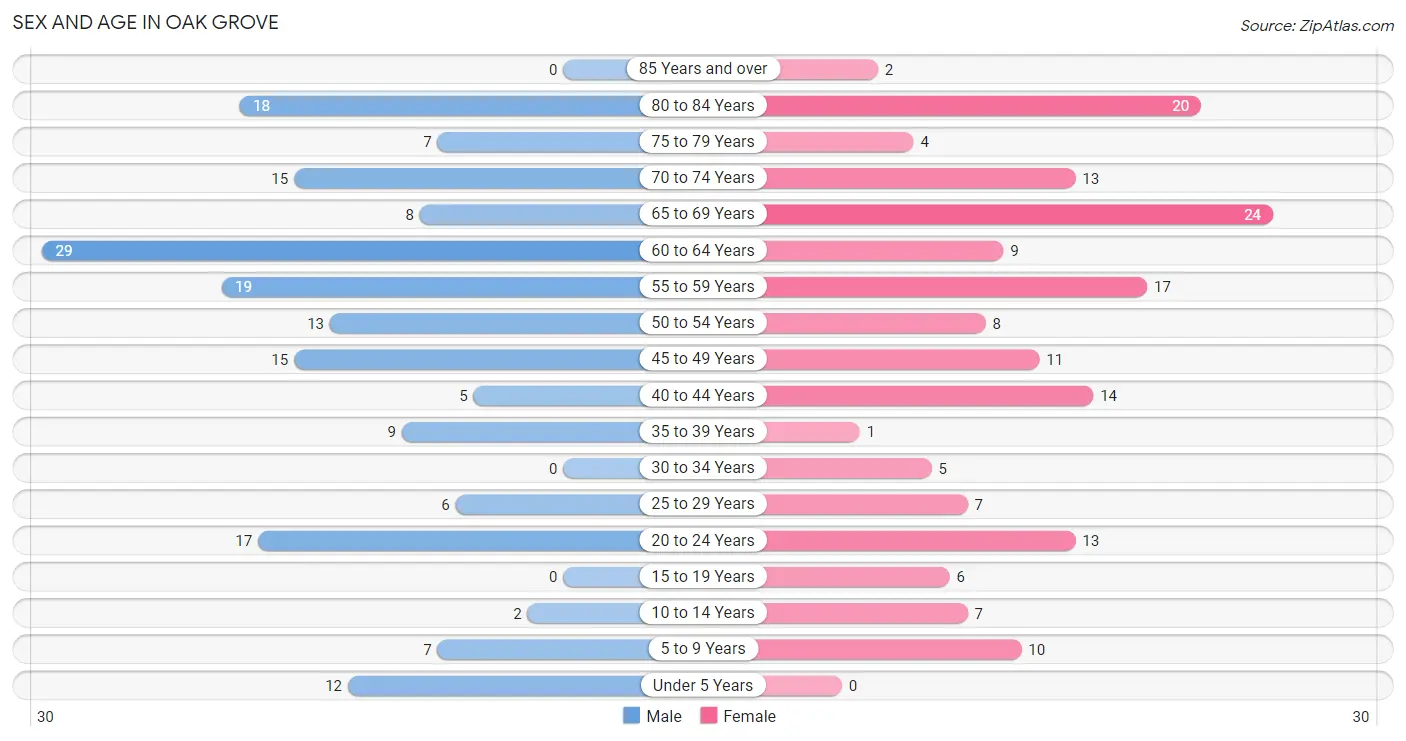
Sex and Age in Oak Grove
Sex and Age in Oak Grove
The most populous age groups in Oak Grove are 60 to 64 Years (29 | 15.9%) for men and 65 to 69 Years (24 | 14.0%) for women.
| Age Bracket | Male | Female |
| Under 5 Years | 12 (6.6%) | 0 (0.0%) |
| 5 to 9 Years | 7 (3.8%) | 10 (5.9%) |
| 10 to 14 Years | 2 (1.1%) | 7 (4.1%) |
| 15 to 19 Years | 0 (0.0%) | 6 (3.5%) |
| 20 to 24 Years | 17 (9.3%) | 13 (7.6%) |
| 25 to 29 Years | 6 (3.3%) | 7 (4.1%) |
| 30 to 34 Years | 0 (0.0%) | 5 (2.9%) |
| 35 to 39 Years | 9 (5.0%) | 1 (0.6%) |
| 40 to 44 Years | 5 (2.8%) | 14 (8.2%) |
| 45 to 49 Years | 15 (8.2%) | 11 (6.4%) |
| 50 to 54 Years | 13 (7.1%) | 8 (4.7%) |
| 55 to 59 Years | 19 (10.4%) | 17 (9.9%) |
| 60 to 64 Years | 29 (15.9%) | 9 (5.3%) |
| 65 to 69 Years | 8 (4.4%) | 24 (14.0%) |
| 70 to 74 Years | 15 (8.2%) | 13 (7.6%) |
| 75 to 79 Years | 7 (3.8%) | 4 (2.3%) |
| 80 to 84 Years | 18 (9.9%) | 20 (11.7%) |
| 85 Years and over | 0 (0.0%) | 2 (1.2%) |
| Total | 182 (100.0%) | 171 (100.0%) |
Families and Households in Oak Grove
Median Family Size in Oak Grove
The median family size in Oak Grove is 2.18 persons per family, with single female/mother families (46 | 41.1%) accounting for the largest median family size of 2.2 persons per family. On the other hand, single male/father families (9 | 8.0%) represent the smallest median family size with 2.11 persons per family.
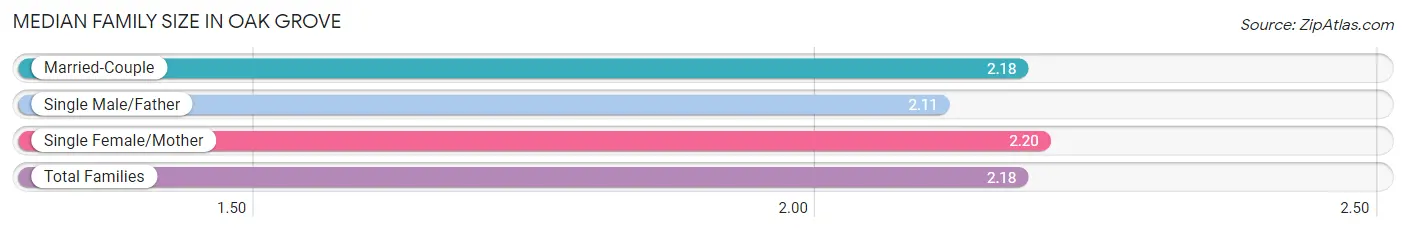
| Family Type | # Families | Family Size |
| Married-Couple | 57 (50.9%) | 2.18 |
| Single Male/Father | 9 (8.0%) | 2.11 |
| Single Female/Mother | 46 (41.1%) | 2.20 |
| Total Families | 112 (100.0%) | 2.18 |
Median Household Size in Oak Grove
The median household size in Oak Grove is 1.77 persons per household, with single female/mother households (46 | 23.1%) accounting for the largest median household size of 2.37 persons per household. non-family households (87 | 43.7%) represent the smallest median household size with 1.14 persons per household.
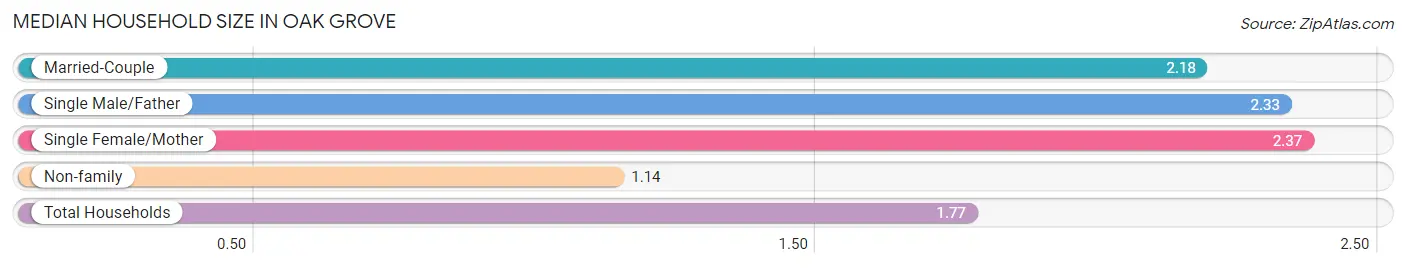
| Household Type | # Households | Household Size |
| Married-Couple | 57 (28.6%) | 2.18 |
| Single Male/Father | 9 (4.5%) | 2.33 |
| Single Female/Mother | 46 (23.1%) | 2.37 |
| Non-family | 87 (43.7%) | 1.14 |
| Total Households | 199 (100.0%) | 1.77 |
Household Size by Marriage Status in Oak Grove
Out of a total of 199 households in Oak Grove, 112 (56.3%) are family households, while 87 (43.7%) are nonfamily households. The most numerous type of family households are 2-person households, comprising 79, and the most common type of nonfamily households are 1-person households, comprising 73.
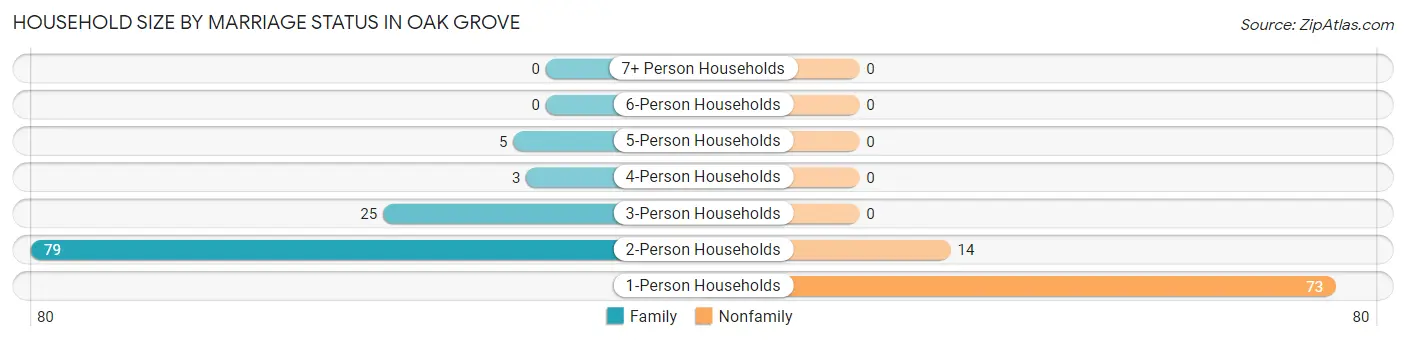
| Household Size | Family Households | Nonfamily Households |
| 1-Person Households | - | 73 (36.7%) |
| 2-Person Households | 79 (39.7%) | 14 (7.0%) |
| 3-Person Households | 25 (12.6%) | 0 (0.0%) |
| 4-Person Households | 3 (1.5%) | 0 (0.0%) |
| 5-Person Households | 5 (2.5%) | 0 (0.0%) |
| 6-Person Households | 0 (0.0%) | 0 (0.0%) |
| 7+ Person Households | 0 (0.0%) | 0 (0.0%) |
| Total | 112 (56.3%) | 87 (43.7%) |
Female Fertility in Oak Grove
Fertility by Age in Oak Grove
Average fertility rate in Oak Grove is 259.0 births per 1,000 women. Women in the age bracket of 20 to 34 years have the highest fertility rate with 560.0 births per 1,000 women. Women in the age bracket of 20 to 34 years acount for 93.3% of all women with births.
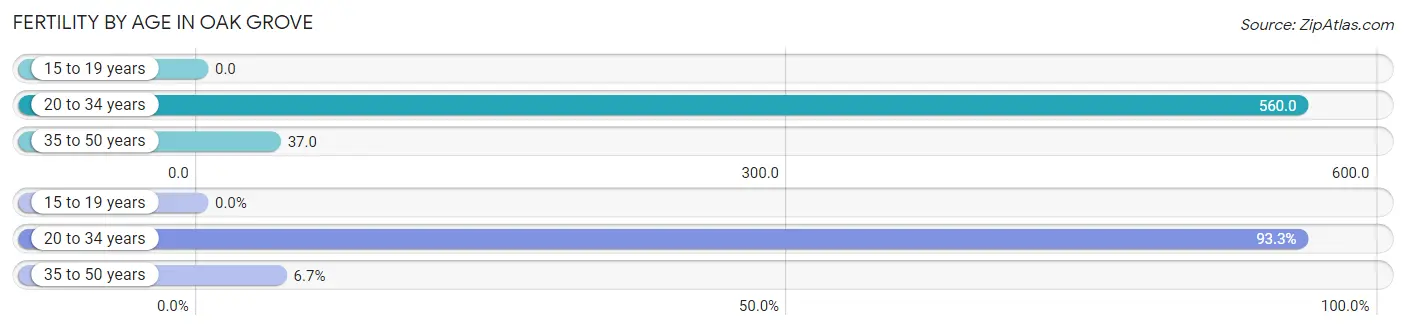
| Age Bracket | Women with Births | Births / 1,000 Women |
| 15 to 19 years | 0 (0.0%) | 0.0 |
| 20 to 34 years | 14 (93.3%) | 560.0 |
| 35 to 50 years | 1 (6.7%) | 37.0 |
| Total | 15 (100.0%) | 259.0 |
Fertility by Age by Marriage Status in Oak Grove
40.0% of women with births (15) in Oak Grove are married. The highest percentage of unmarried women with births falls into 20 to 34 years age bracket with 64.3% of them unmarried at the time of birth, while the lowest percentage of unmarried women with births belong to 35 to 50 years age bracket with 0.0% of them unmarried.
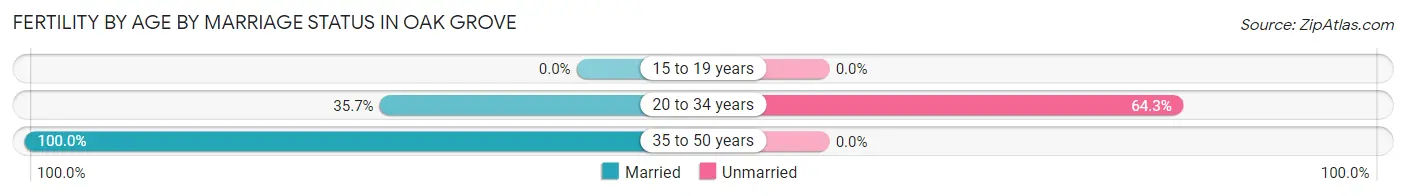
| Age Bracket | Married | Unmarried |
| 15 to 19 years | 0 (0.0%) | 0 (0.0%) |
| 20 to 34 years | 5 (35.7%) | 9 (64.3%) |
| 35 to 50 years | 1 (100.0%) | 0 (0.0%) |
| Total | 6 (40.0%) | 9 (60.0%) |
Fertility by Education in Oak Grove
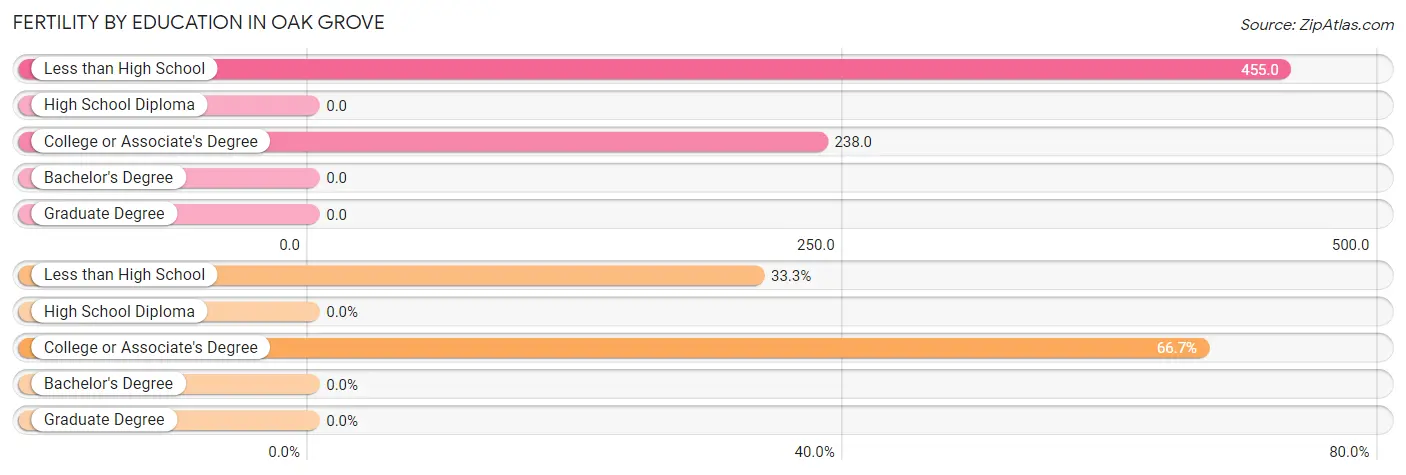
| Educational Attainment | Women with Births | Births / 1,000 Women |
| Less than High School | 5 (33.3%) | 455.0 |
| High School Diploma | 0 (0.0%) | 0.0 |
| College or Associate's Degree | 10 (66.7%) | 238.0 |
| Bachelor's Degree | 0 (0.0%) | 0.0 |
| Graduate Degree | 0 (0.0%) | 0.0 |
| Total | 15 (100.0%) | 259.0 |
Fertility by Education by Marriage Status in Oak Grove
60.0% of women with births in Oak Grove are unmarried. Women with the educational attainment of less than high school are most likely to be married with 100.0% of them married at childbirth, while women with the educational attainment of college or associate's degree are least likely to be married with 90.0% of them unmarried at childbirth.
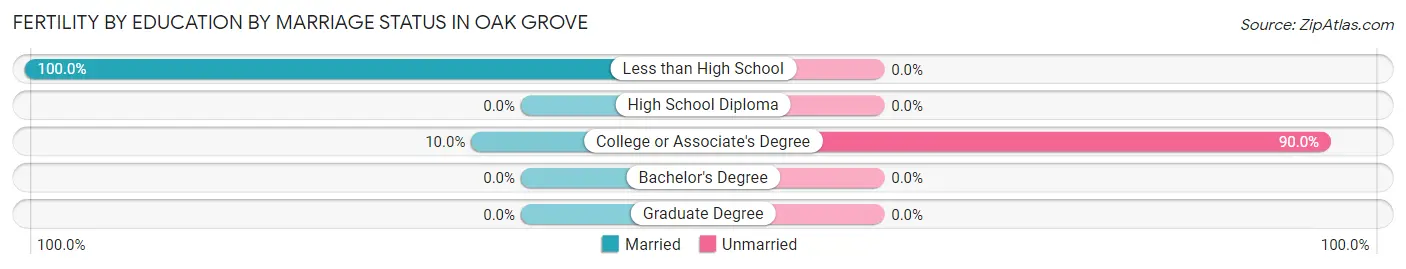
| Educational Attainment | Married | Unmarried |
| Less than High School | 5 (100.0%) | 0 (0.0%) |
| High School Diploma | 0 (0.0%) | 0 (0.0%) |
| College or Associate's Degree | 1 (10.0%) | 9 (90.0%) |
| Bachelor's Degree | 0 (0.0%) | 0 (0.0%) |
| Graduate Degree | 0 (0.0%) | 0 (0.0%) |
| Total | 6 (40.0%) | 9 (60.0%) |
Income in Oak Grove
Income Overview in Oak Grove
Per Capita Income in Oak Grove is $27,182, while median incomes of families and households are $42,206 and $40,486 respectively.
| Characteristic | Number | Measure |
| Per Capita Income | 353 | $27,182 |
| Median Family Income | 112 | $42,206 |
| Mean Family Income | 112 | $52,017 |
| Median Household Income | 199 | $40,486 |
| Mean Household Income | 199 | $49,950 |
| Income Deficit | 112 | $0 |
| Wage / Income Gap (%) | 353 | 0.00% |
| Wage / Income Gap ($) | 353 | 100.00¢ per $1 |
| Gini / Inequality Index | 353 | 0.37 |
Earnings by Sex in Oak Grove
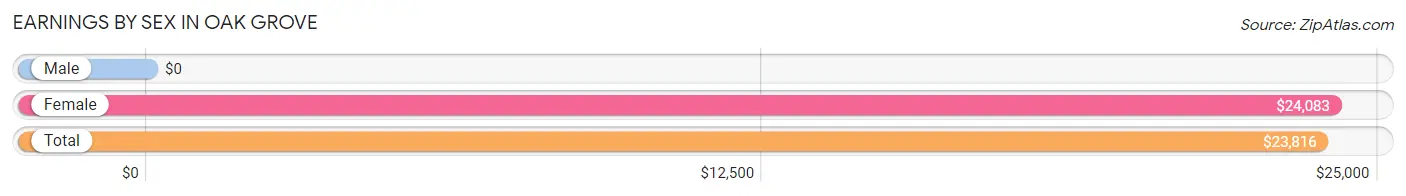
| Sex | Number | Average Earnings |
| Male | 103 (54.2%) | $0 |
| Female | 87 (45.8%) | $24,083 |
| Total | 190 (100.0%) | $23,816 |
Earnings by Sex by Income Bracket in Oak Grove
The most common earnings brackets in Oak Grove are $12,500 to $14,999 for men (31 | 30.1%) and $22,500 to $24,999 for women (15 | 17.2%).
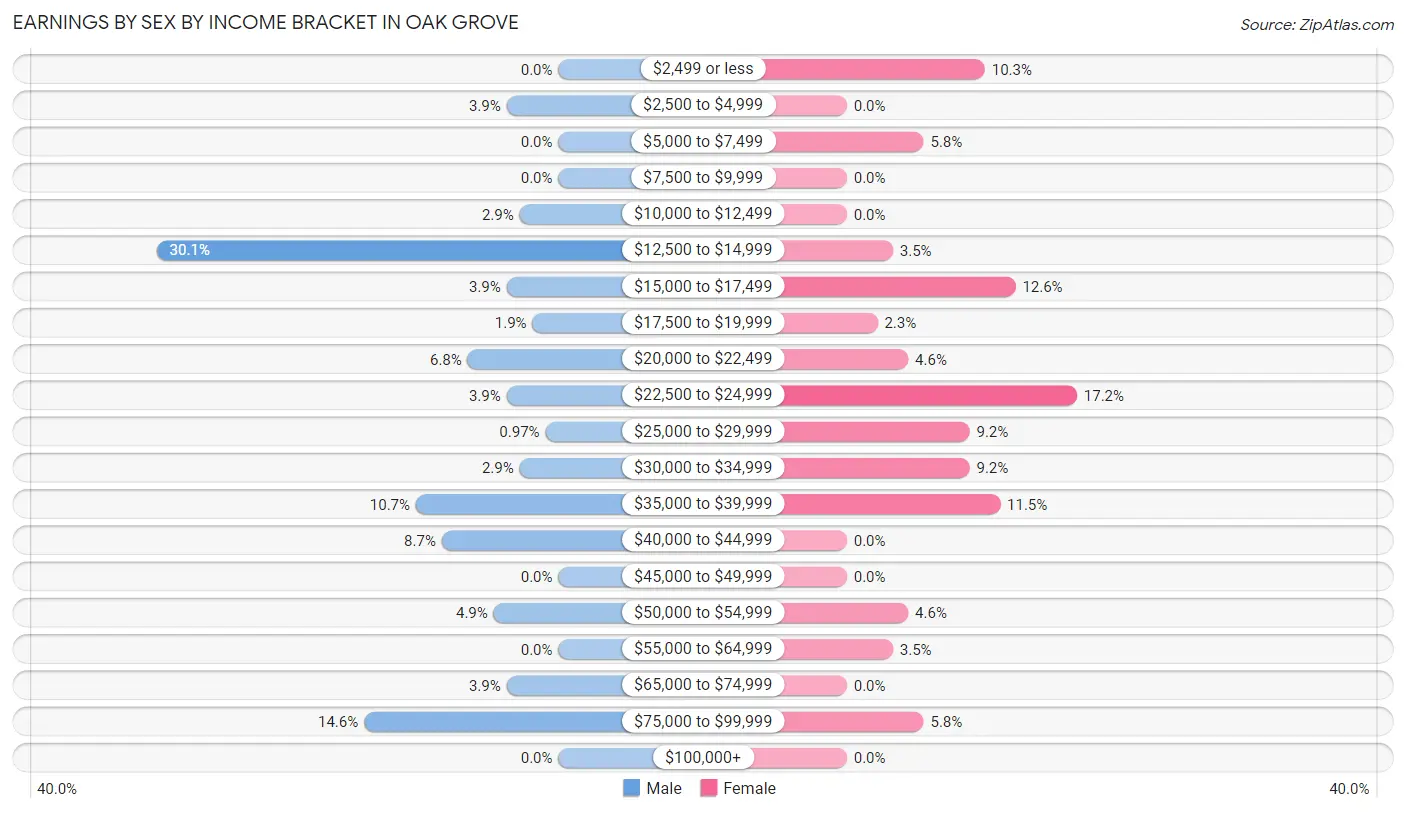
| Income | Male | Female |
| $2,499 or less | 0 (0.0%) | 9 (10.3%) |
| $2,500 to $4,999 | 4 (3.9%) | 0 (0.0%) |
| $5,000 to $7,499 | 0 (0.0%) | 5 (5.8%) |
| $7,500 to $9,999 | 0 (0.0%) | 0 (0.0%) |
| $10,000 to $12,499 | 3 (2.9%) | 0 (0.0%) |
| $12,500 to $14,999 | 31 (30.1%) | 3 (3.5%) |
| $15,000 to $17,499 | 4 (3.9%) | 11 (12.6%) |
| $17,500 to $19,999 | 2 (1.9%) | 2 (2.3%) |
| $20,000 to $22,499 | 7 (6.8%) | 4 (4.6%) |
| $22,500 to $24,999 | 4 (3.9%) | 15 (17.2%) |
| $25,000 to $29,999 | 1 (1.0%) | 8 (9.2%) |
| $30,000 to $34,999 | 3 (2.9%) | 8 (9.2%) |
| $35,000 to $39,999 | 11 (10.7%) | 10 (11.5%) |
| $40,000 to $44,999 | 9 (8.7%) | 0 (0.0%) |
| $45,000 to $49,999 | 0 (0.0%) | 0 (0.0%) |
| $50,000 to $54,999 | 5 (4.9%) | 4 (4.6%) |
| $55,000 to $64,999 | 0 (0.0%) | 3 (3.5%) |
| $65,000 to $74,999 | 4 (3.9%) | 0 (0.0%) |
| $75,000 to $99,999 | 15 (14.6%) | 5 (5.8%) |
| $100,000+ | 0 (0.0%) | 0 (0.0%) |
| Total | 103 (100.0%) | 87 (100.0%) |
Earnings by Sex by Educational Attainment in Oak Grove
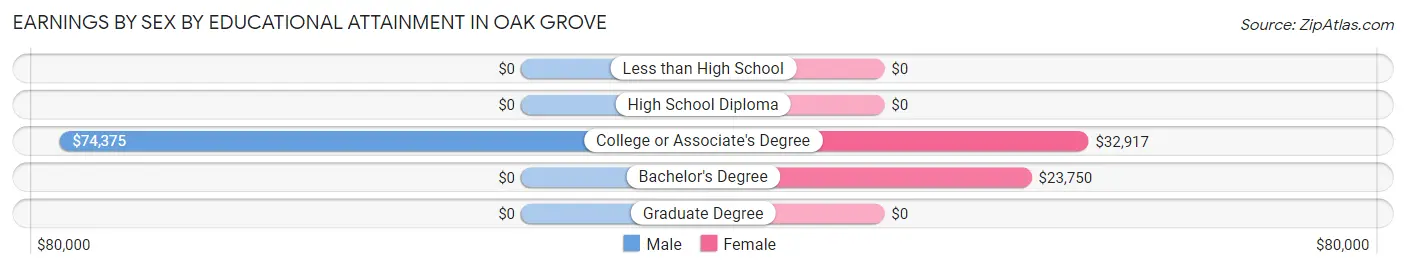
| Educational Attainment | Male Income | Female Income |
| Less than High School | - | - |
| High School Diploma | - | - |
| College or Associate's Degree | $74,375 | $32,917 |
| Bachelor's Degree | - | - |
| Graduate Degree | - | - |
| Total | - | - |
Family Income in Oak Grove
Family Income Brackets in Oak Grove
According to the Oak Grove family income data, there are 33 families falling into the $35,000 to $49,999 income range, which is the most common income bracket and makes up 29.5% of all families.
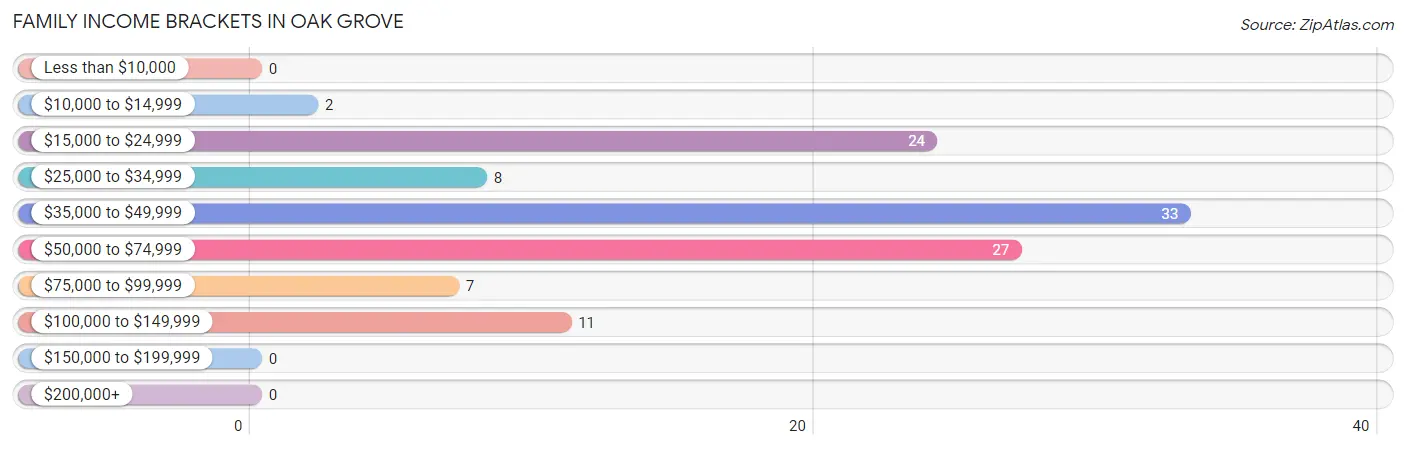
| Income Bracket | # Families | % Families |
| Less than $10,000 | 0 | 0.0% |
| $10,000 to $14,999 | 2 | 1.8% |
| $15,000 to $24,999 | 24 | 21.4% |
| $25,000 to $34,999 | 8 | 7.1% |
| $35,000 to $49,999 | 33 | 29.5% |
| $50,000 to $74,999 | 27 | 24.1% |
| $75,000 to $99,999 | 7 | 6.3% |
| $100,000 to $149,999 | 11 | 9.8% |
| $150,000 to $199,999 | 0 | 0.0% |
| $200,000+ | 0 | 0.0% |
Family Income by Famaliy Size in Oak Grove
2-person families (90 | 80.4%) account for the highest median family income in Oak Grove with $42,143 per family, while 2-person families (90 | 80.4%) have the highest median income of $21,072 per family member.
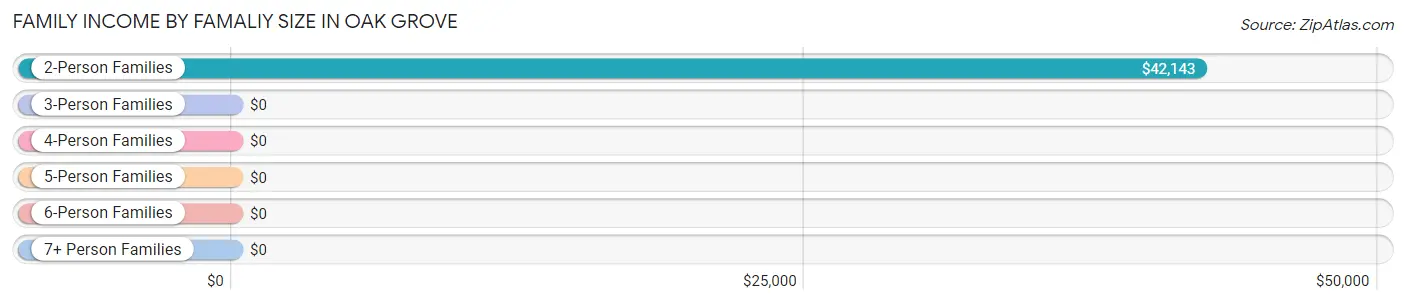
| Income Bracket | # Families | Median Income |
| 2-Person Families | 90 (80.4%) | $42,143 |
| 3-Person Families | 14 (12.5%) | $0 |
| 4-Person Families | 3 (2.7%) | $0 |
| 5-Person Families | 5 (4.5%) | $0 |
| 6-Person Families | 0 (0.0%) | $0 |
| 7+ Person Families | 0 (0.0%) | $0 |
| Total | 112 (100.0%) | $42,206 |
Family Income by Number of Earners in Oak Grove
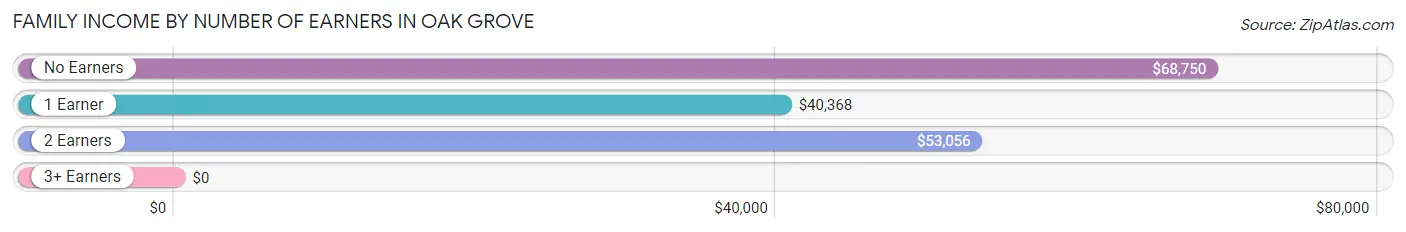
| Number of Earners | # Families | Median Income |
| No Earners | 34 (30.4%) | $68,750 |
| 1 Earner | 53 (47.3%) | $40,368 |
| 2 Earners | 22 (19.6%) | $53,056 |
| 3+ Earners | 3 (2.7%) | $0 |
| Total | 112 (100.0%) | $42,206 |
Household Income in Oak Grove
Household Income Brackets in Oak Grove
With 46 households falling in the category, the $25,000 to $34,999 income range is the most frequent in Oak Grove, accounting for 23.1% of all households.
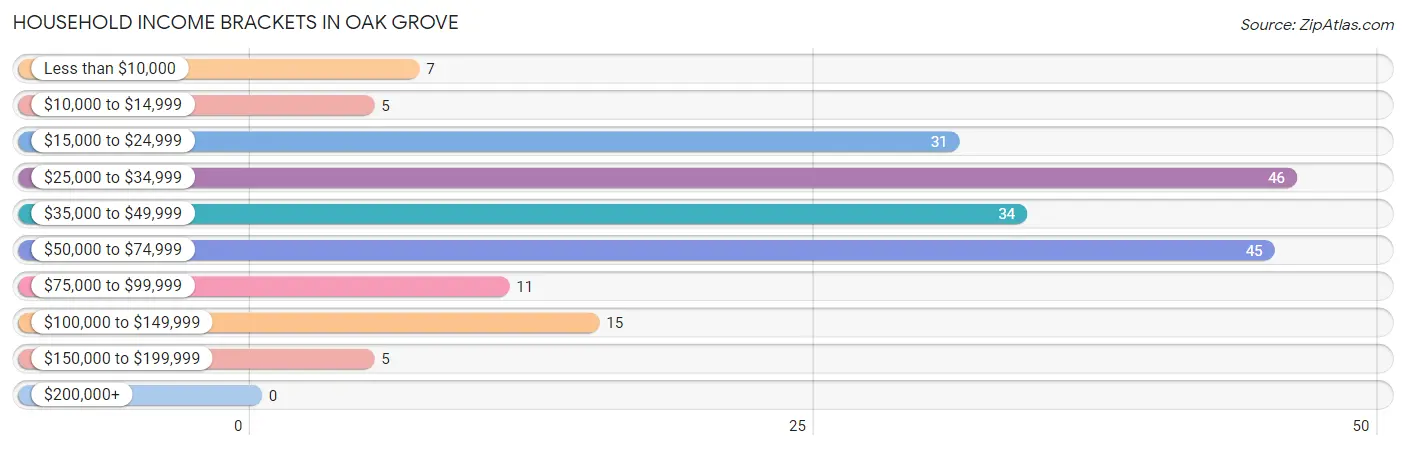
| Income Bracket | # Households | % Households |
| Less than $10,000 | 7 | 3.5% |
| $10,000 to $14,999 | 5 | 2.5% |
| $15,000 to $24,999 | 31 | 15.6% |
| $25,000 to $34,999 | 46 | 23.1% |
| $35,000 to $49,999 | 34 | 17.1% |
| $50,000 to $74,999 | 45 | 22.6% |
| $75,000 to $99,999 | 11 | 5.5% |
| $100,000 to $149,999 | 15 | 7.5% |
| $150,000 to $199,999 | 5 | 2.5% |
| $200,000+ | 0 | 0.0% |
Household Income by Householder Age in Oak Grove
The median household income in Oak Grove is $40,486, with the highest median household income of $53,333 found in the 15 to 24 years age bracket for the primary householder. A total of 12 households (6.0%) fall into this category. Meanwhile, the 45 to 64 years age bracket for the primary householder has the lowest median household income of $29,643, with 98 households (49.2%) in this group.
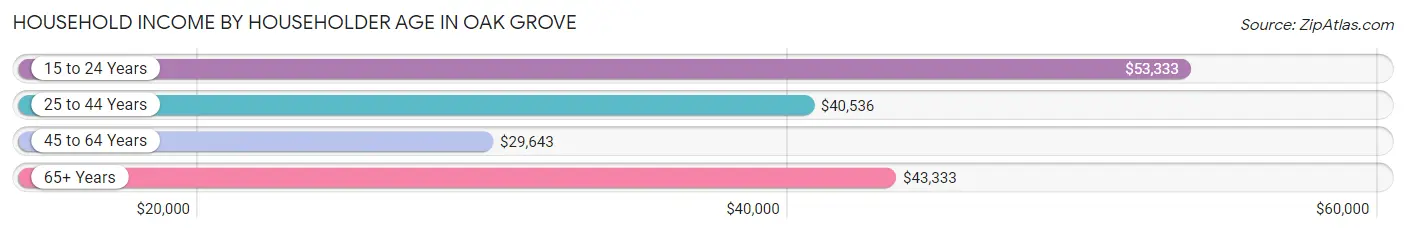
| Income Bracket | # Households | Median Income |
| 15 to 24 Years | 12 (6.0%) | $53,333 |
| 25 to 44 Years | 33 (16.6%) | $40,536 |
| 45 to 64 Years | 98 (49.2%) | $29,643 |
| 65+ Years | 56 (28.1%) | $43,333 |
| Total | 199 (100.0%) | $40,486 |
Poverty in Oak Grove
Income Below Poverty by Sex and Age in Oak Grove
With 13.2% poverty level for males and 14.6% for females among the residents of Oak Grove, 6 to 11 year old males and 18 to 24 year old females are the most vulnerable to poverty, with 5 males (71.4%) and 9 females (69.2%) in their respective age groups living below the poverty level.
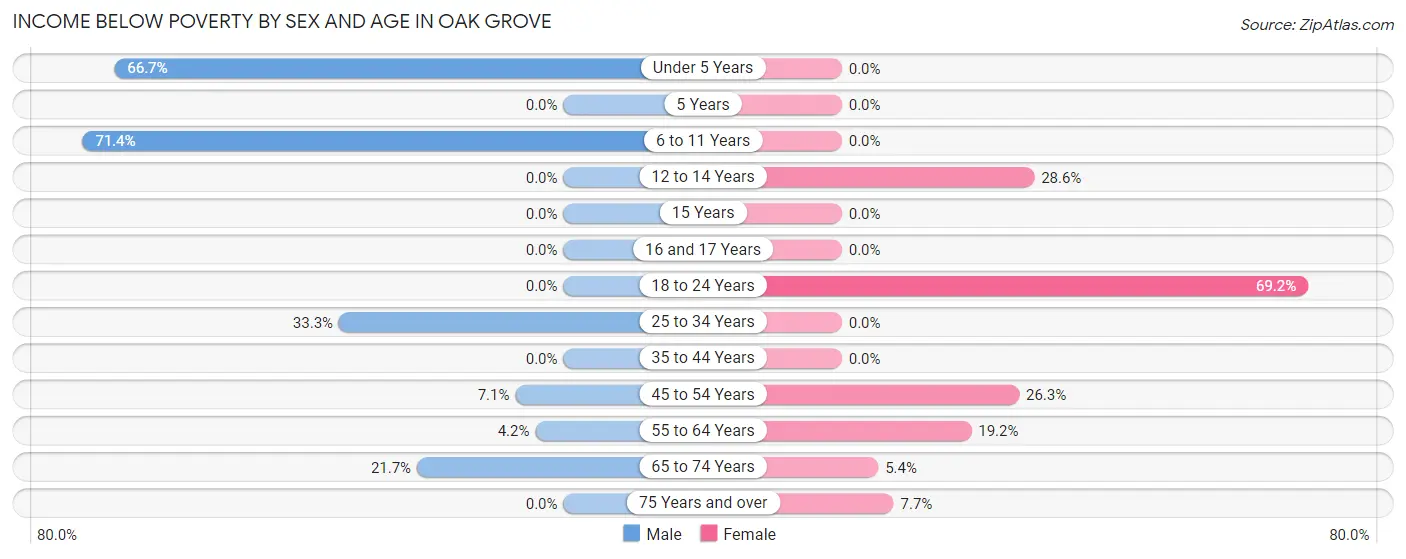
| Age Bracket | Male | Female |
| Under 5 Years | 8 (66.7%) | 0 (0.0%) |
| 5 Years | 0 (0.0%) | 0 (0.0%) |
| 6 to 11 Years | 5 (71.4%) | 0 (0.0%) |
| 12 to 14 Years | 0 (0.0%) | 2 (28.6%) |
| 15 Years | 0 (0.0%) | 0 (0.0%) |
| 16 and 17 Years | 0 (0.0%) | 0 (0.0%) |
| 18 to 24 Years | 0 (0.0%) | 9 (69.2%) |
| 25 to 34 Years | 2 (33.3%) | 0 (0.0%) |
| 35 to 44 Years | 0 (0.0%) | 0 (0.0%) |
| 45 to 54 Years | 2 (7.1%) | 5 (26.3%) |
| 55 to 64 Years | 2 (4.2%) | 5 (19.2%) |
| 65 to 74 Years | 5 (21.7%) | 2 (5.4%) |
| 75 Years and over | 0 (0.0%) | 2 (7.7%) |
| Total | 24 (13.2%) | 25 (14.6%) |
Income Above Poverty by Sex and Age in Oak Grove
According to the poverty statistics in Oak Grove, males aged 12 to 14 years and females aged 6 to 11 years are the age groups that are most secure financially, with 100.0% of males and 100.0% of females in these age groups living above the poverty line.
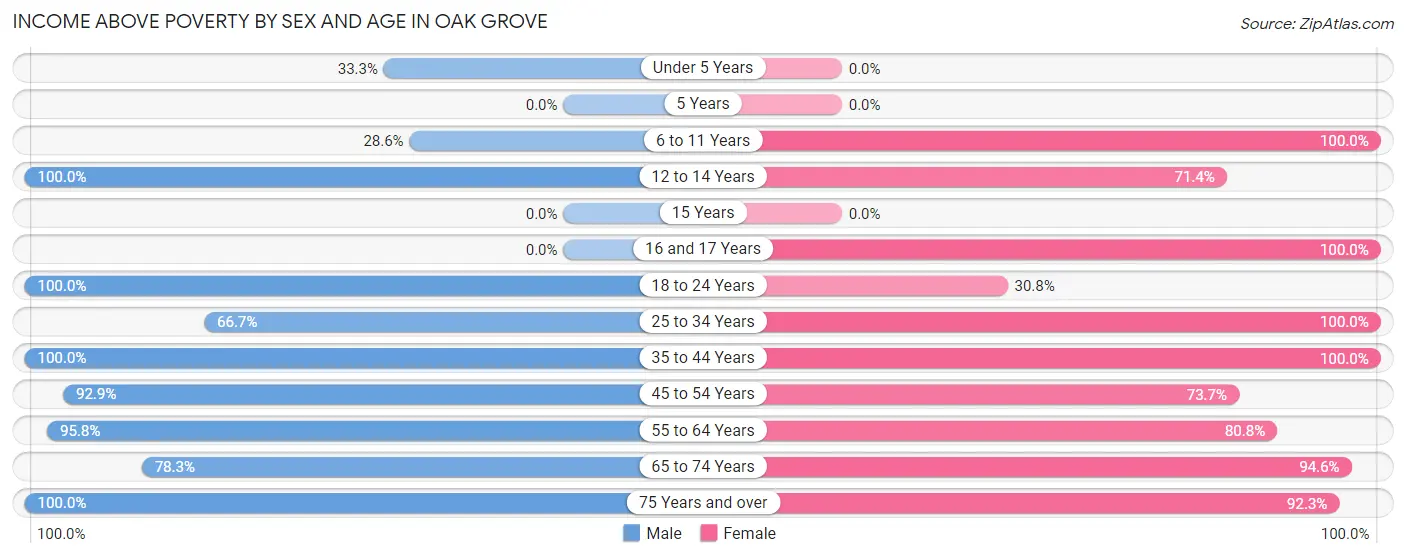
| Age Bracket | Male | Female |
| Under 5 Years | 4 (33.3%) | 0 (0.0%) |
| 5 Years | 0 (0.0%) | 0 (0.0%) |
| 6 to 11 Years | 2 (28.6%) | 10 (100.0%) |
| 12 to 14 Years | 2 (100.0%) | 5 (71.4%) |
| 15 Years | 0 (0.0%) | 0 (0.0%) |
| 16 and 17 Years | 0 (0.0%) | 6 (100.0%) |
| 18 to 24 Years | 17 (100.0%) | 4 (30.8%) |
| 25 to 34 Years | 4 (66.7%) | 12 (100.0%) |
| 35 to 44 Years | 14 (100.0%) | 15 (100.0%) |
| 45 to 54 Years | 26 (92.9%) | 14 (73.7%) |
| 55 to 64 Years | 46 (95.8%) | 21 (80.8%) |
| 65 to 74 Years | 18 (78.3%) | 35 (94.6%) |
| 75 Years and over | 25 (100.0%) | 24 (92.3%) |
| Total | 158 (86.8%) | 146 (85.4%) |
Income Below Poverty Among Married-Couple Families in Oak Grove
The poverty statistics for married-couple families in Oak Grove show that 3.5% or 2 of the total 57 families live below the poverty line. Families with no children have the highest poverty rate of 4.0%, comprising of 2 families. On the other hand, families with 1 or 2 children have the lowest poverty rate of 0.0%, which includes 0 families.
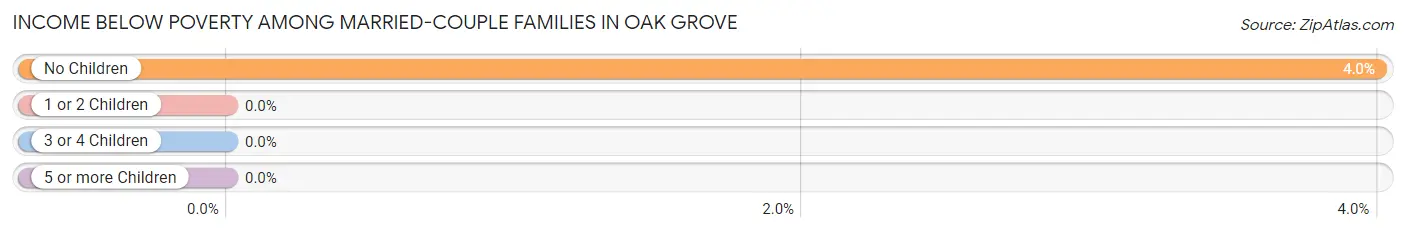
| Children | Above Poverty | Below Poverty |
| No Children | 48 (96.0%) | 2 (4.0%) |
| 1 or 2 Children | 4 (100.0%) | 0 (0.0%) |
| 3 or 4 Children | 3 (100.0%) | 0 (0.0%) |
| 5 or more Children | 0 (0.0%) | 0 (0.0%) |
| Total | 55 (96.5%) | 2 (3.5%) |
Income Below Poverty Among Single-Parent Households in Oak Grove
According to the poverty data in Oak Grove, 22.2% or 2 single-father households and 23.9% or 11 single-mother households are living below the poverty line. Among single-father households, those with no children have the highest poverty rate, with 2 households (100.0%) experiencing poverty. Likewise, among single-mother households, those with 3 or 4 children have the highest poverty rate, with 2 households (100.0%) falling below the poverty line.
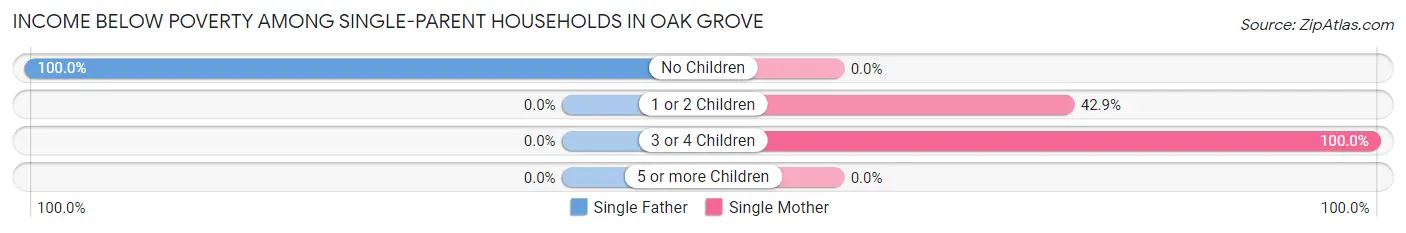
| Children | Single Father | Single Mother |
| No Children | 2 (100.0%) | 0 (0.0%) |
| 1 or 2 Children | 0 (0.0%) | 9 (42.9%) |
| 3 or 4 Children | 0 (0.0%) | 2 (100.0%) |
| 5 or more Children | 0 (0.0%) | 0 (0.0%) |
| Total | 2 (22.2%) | 11 (23.9%) |
Income Below Poverty Among Married-Couple vs Single-Parent Households in Oak Grove
The poverty data for Oak Grove shows that 2 of the married-couple family households (3.5%) and 13 of the single-parent households (23.6%) are living below the poverty level. Within the married-couple family households, those with no children have the highest poverty rate, with 2 households (4.0%) falling below the poverty line. Among the single-parent households, those with 3 or 4 children have the highest poverty rate, with 2 household (100.0%) living below poverty.
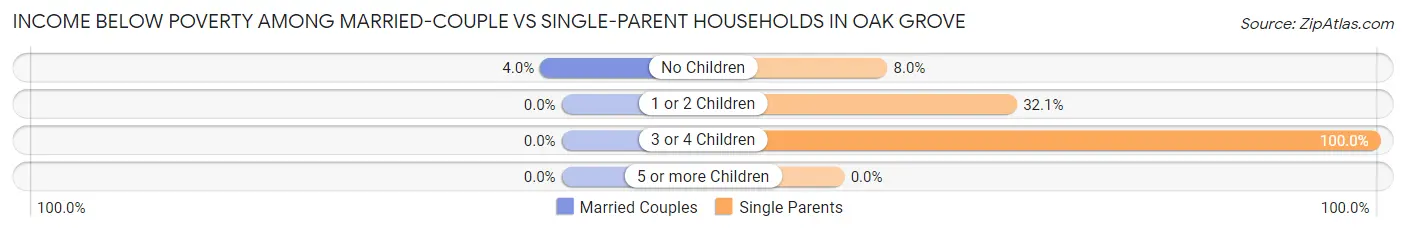
| Children | Married-Couple Families | Single-Parent Households |
| No Children | 2 (4.0%) | 2 (8.0%) |
| 1 or 2 Children | 0 (0.0%) | 9 (32.1%) |
| 3 or 4 Children | 0 (0.0%) | 2 (100.0%) |
| 5 or more Children | 0 (0.0%) | 0 (0.0%) |
| Total | 2 (3.5%) | 13 (23.6%) |
Employment Characteristics in Oak Grove
Employment by Class of Employer in Oak Grove
Among the 173 employed individuals in Oak Grove, private company employees (150 | 86.7%), not-for-profit organizations (7 | 4.1%), and local government employees (7 | 4.1%) make up the most common classes of employment.
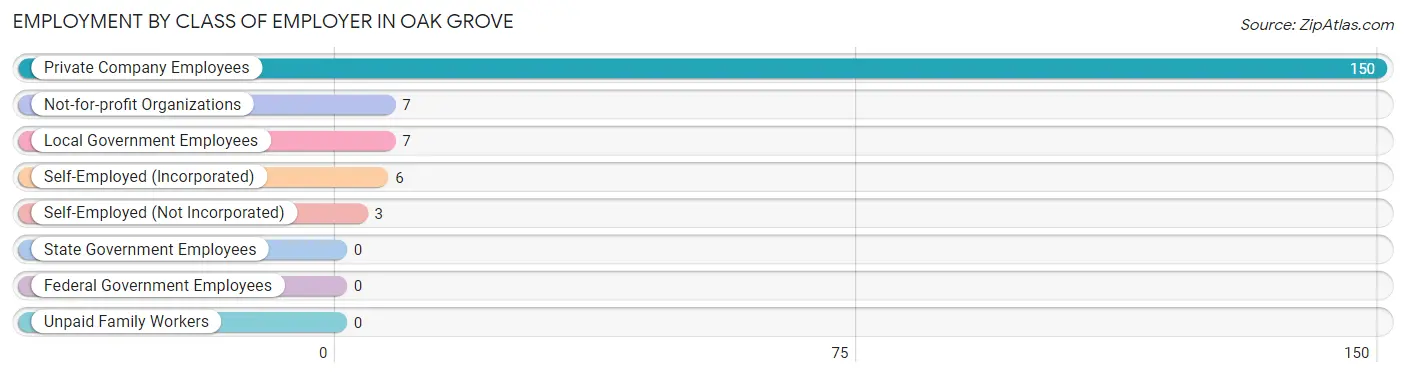
| Employer Class | # Employees | % Employees |
| Private Company Employees | 150 | 86.7% |
| Self-Employed (Incorporated) | 6 | 3.5% |
| Self-Employed (Not Incorporated) | 3 | 1.7% |
| Not-for-profit Organizations | 7 | 4.1% |
| Local Government Employees | 7 | 4.1% |
| State Government Employees | 0 | 0.0% |
| Federal Government Employees | 0 | 0.0% |
| Unpaid Family Workers | 0 | 0.0% |
| Total | 173 | 100.0% |
Employment Status by Age in Oak Grove
According to the labor force statistics for Oak Grove, out of the total population over 16 years of age (315), 59.4% or 187 individuals are in the labor force, with 7.5% or 14 of them unemployed. The age group with the highest labor force participation rate is 20 to 24 years, with 100.0% or 30 individuals in the labor force. Within the labor force, the 30 to 34 years age range has the highest percentage of unemployed individuals, with 100.0% or 5 of them being unemployed.
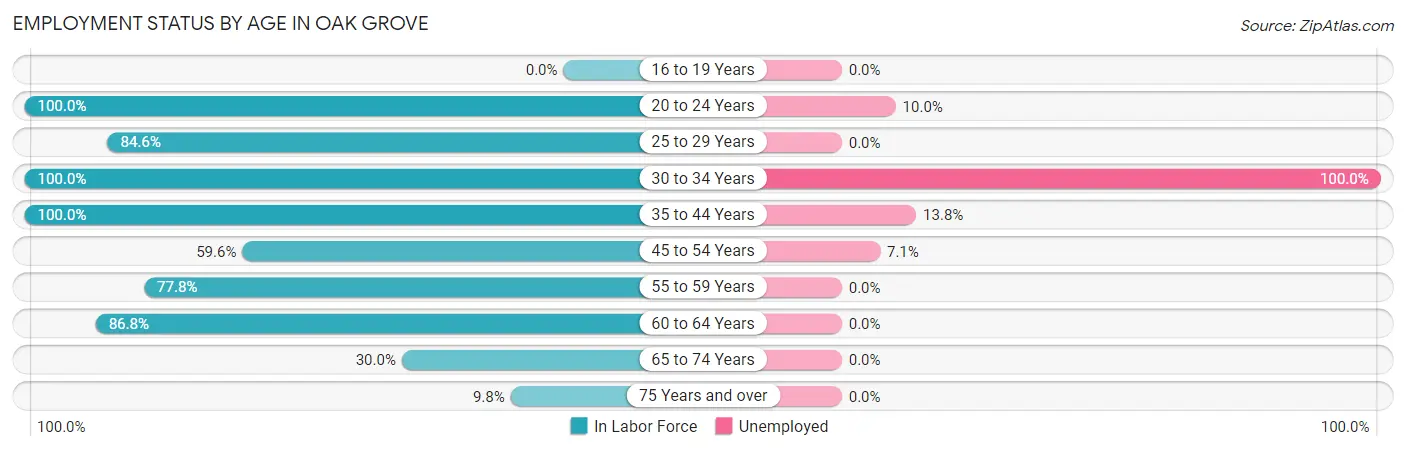
| Age Bracket | In Labor Force | Unemployed |
| 16 to 19 Years | 0 (0.0%) | 0 (0.0%) |
| 20 to 24 Years | 30 (100.0%) | 3 (10.0%) |
| 25 to 29 Years | 11 (84.6%) | 0 (0.0%) |
| 30 to 34 Years | 5 (100.0%) | 5 (100.0%) |
| 35 to 44 Years | 29 (100.0%) | 4 (13.8%) |
| 45 to 54 Years | 28 (59.6%) | 2 (7.1%) |
| 55 to 59 Years | 28 (77.8%) | 0 (0.0%) |
| 60 to 64 Years | 33 (86.8%) | 0 (0.0%) |
| 65 to 74 Years | 18 (30.0%) | 0 (0.0%) |
| 75 Years and over | 5 (9.8%) | 0 (0.0%) |
| Total | 187 (59.4%) | 14 (7.5%) |
Employment Status by Educational Attainment in Oak Grove
According to labor force statistics for Oak Grove, 79.8% of individuals (134) out of the total population between 25 and 64 years of age (168) are in the labor force, with 8.2% or 11 of them being unemployed. The group with the highest labor force participation rate are those with the educational attainment of college / associate degree, with 90.8% or 59 individuals in the labor force. Within the labor force, individuals with less than high school education have the highest percentage of unemployment, with 63.6% or 7 of them being unemployed.
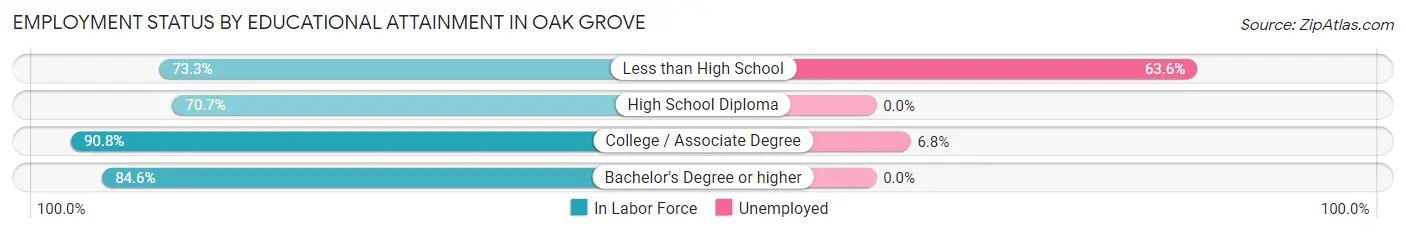
| Educational Attainment | In Labor Force | Unemployed |
| Less than High School | 11 (73.3%) | 10 (63.6%) |
| High School Diploma | 53 (70.7%) | 0 (0.0%) |
| College / Associate Degree | 59 (90.8%) | 4 (6.8%) |
| Bachelor's Degree or higher | 11 (84.6%) | 0 (0.0%) |
| Total | 134 (79.8%) | 14 (8.2%) |
Employment Occupations by Sex in Oak Grove
Management, Business, Science and Arts Occupations
The most common Management, Business, Science and Arts occupations in Oak Grove are Management (17 | 9.8%), Community & Social Service (17 | 9.8%), Education Instruction & Library (11 | 6.4%), Arts, Media & Entertainment (4 | 2.3%), and Business & Financial (3 | 1.7%).
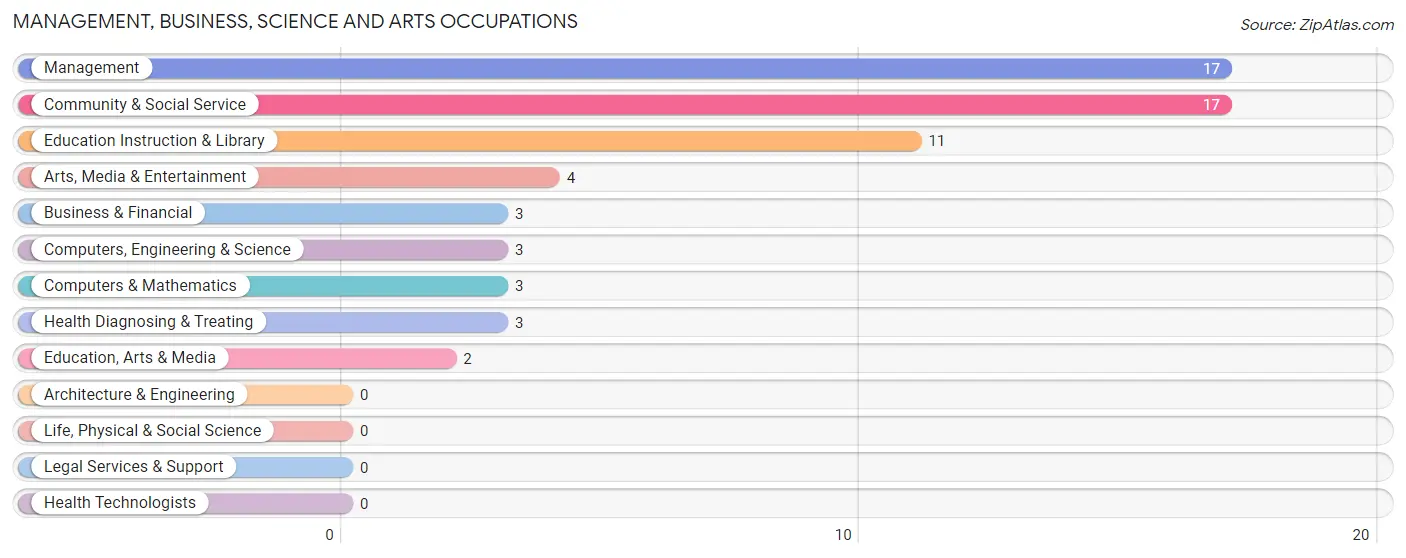
Management, Business, Science and Arts Occupations by Sex
Within the Management, Business, Science and Arts occupations in Oak Grove, the most male-oriented occupations are Computers, Engineering & Science (100.0%), Computers & Mathematics (100.0%), and Management (82.4%), while the most female-oriented occupations are Business & Financial (100.0%), Education, Arts & Media (100.0%), and Arts, Media & Entertainment (100.0%).
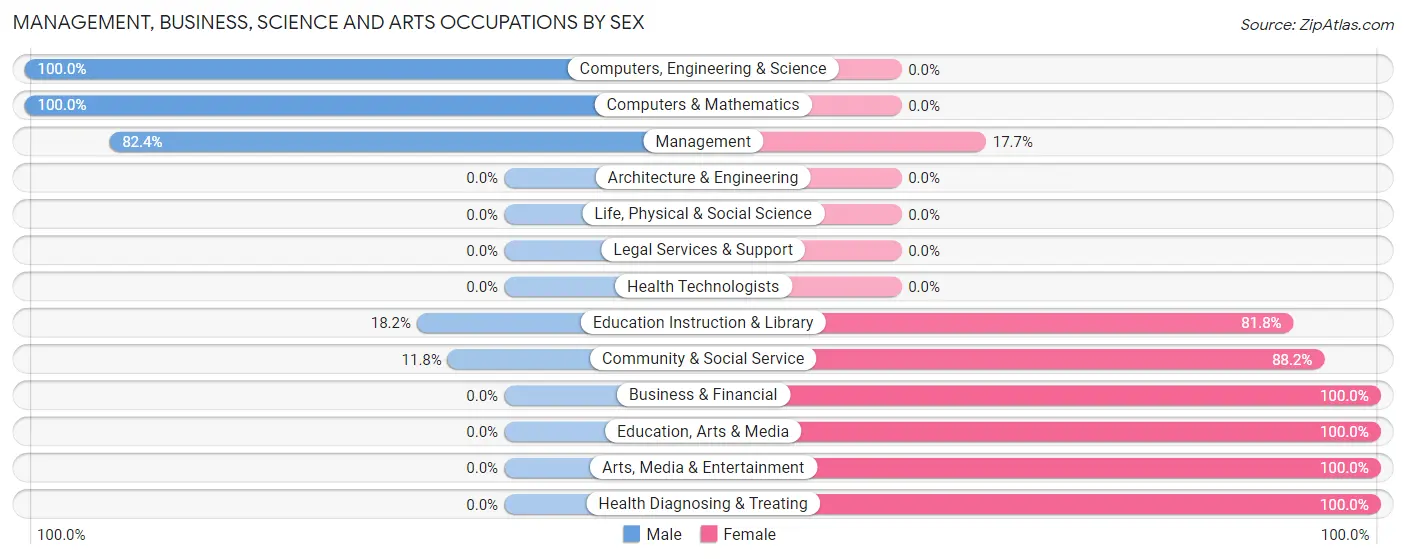
| Occupation | Male | Female |
| Management | 14 (82.4%) | 3 (17.6%) |
| Business & Financial | 0 (0.0%) | 3 (100.0%) |
| Computers, Engineering & Science | 3 (100.0%) | 0 (0.0%) |
| Computers & Mathematics | 3 (100.0%) | 0 (0.0%) |
| Architecture & Engineering | 0 (0.0%) | 0 (0.0%) |
| Life, Physical & Social Science | 0 (0.0%) | 0 (0.0%) |
| Community & Social Service | 2 (11.8%) | 15 (88.2%) |
| Education, Arts & Media | 0 (0.0%) | 2 (100.0%) |
| Legal Services & Support | 0 (0.0%) | 0 (0.0%) |
| Education Instruction & Library | 2 (18.2%) | 9 (81.8%) |
| Arts, Media & Entertainment | 0 (0.0%) | 4 (100.0%) |
| Health Diagnosing & Treating | 0 (0.0%) | 3 (100.0%) |
| Health Technologists | 0 (0.0%) | 0 (0.0%) |
| Total (Category) | 19 (44.2%) | 24 (55.8%) |
| Total (Overall) | 98 (56.7%) | 75 (43.3%) |
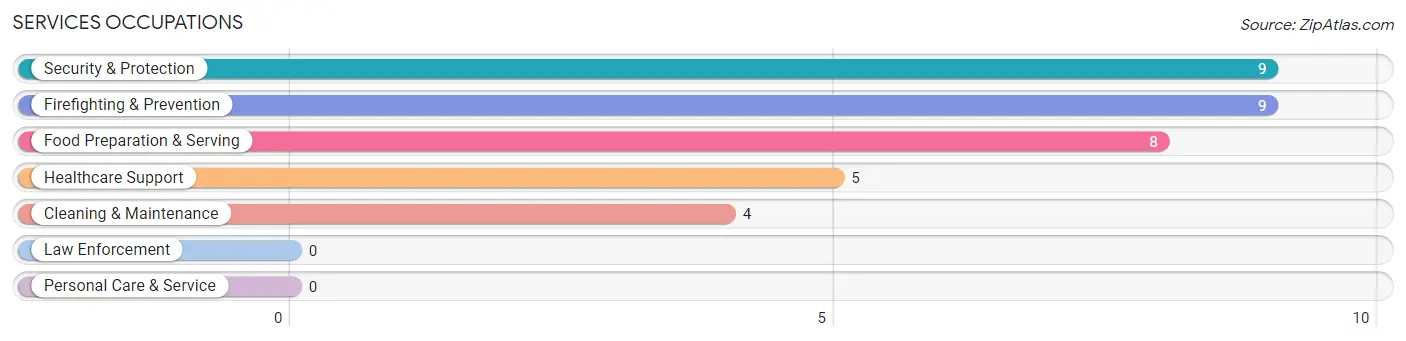
Services Occupations
The most common Services occupations in Oak Grove are Security & Protection (9 | 5.2%), Firefighting & Prevention (9 | 5.2%), Food Preparation & Serving (8 | 4.6%), Healthcare Support (5 | 2.9%), and Cleaning & Maintenance (4 | 2.3%).
Services Occupations by Sex
Within the Services occupations in Oak Grove, the most male-oriented occupations are Food Preparation & Serving (50.0%), Security & Protection (44.4%), and Firefighting & Prevention (44.4%), while the most female-oriented occupations are Healthcare Support (100.0%), Cleaning & Maintenance (100.0%), and Security & Protection (55.6%).
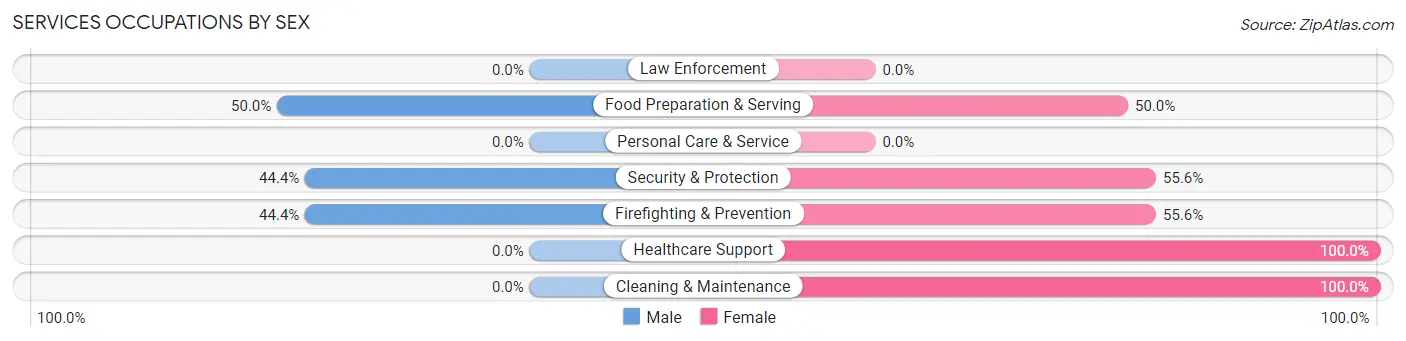
| Occupation | Male | Female |
| Healthcare Support | 0 (0.0%) | 5 (100.0%) |
| Security & Protection | 4 (44.4%) | 5 (55.6%) |
| Firefighting & Prevention | 4 (44.4%) | 5 (55.6%) |
| Law Enforcement | 0 (0.0%) | 0 (0.0%) |
| Food Preparation & Serving | 4 (50.0%) | 4 (50.0%) |
| Cleaning & Maintenance | 0 (0.0%) | 4 (100.0%) |
| Personal Care & Service | 0 (0.0%) | 0 (0.0%) |
| Total (Category) | 8 (30.8%) | 18 (69.2%) |
| Total (Overall) | 98 (56.7%) | 75 (43.3%) |
Sales and Office Occupations
The most common Sales and Office occupations in Oak Grove are Office & Administration (21 | 12.1%), and Sales & Related (11 | 6.4%).

Sales and Office Occupations by Sex

| Occupation | Male | Female |
| Sales & Related | 5 (45.5%) | 6 (54.5%) |
| Office & Administration | 0 (0.0%) | 21 (100.0%) |
| Total (Category) | 5 (15.6%) | 27 (84.4%) |
| Total (Overall) | 98 (56.7%) | 75 (43.3%) |
Natural Resources, Construction and Maintenance Occupations
The most common Natural Resources, Construction and Maintenance occupations in Oak Grove are Construction & Extraction (9 | 5.2%), and Installation, Maintenance & Repair (7 | 4.1%).

Natural Resources, Construction and Maintenance Occupations by Sex

| Occupation | Male | Female |
| Farming, Fishing & Forestry | 0 (0.0%) | 0 (0.0%) |
| Construction & Extraction | 9 (100.0%) | 0 (0.0%) |
| Installation, Maintenance & Repair | 7 (100.0%) | 0 (0.0%) |
| Total (Category) | 16 (100.0%) | 0 (0.0%) |
| Total (Overall) | 98 (56.7%) | 75 (43.3%) |
Production, Transportation and Moving Occupations
The most common Production, Transportation and Moving occupations in Oak Grove are Transportation (38 | 22.0%), Material Moving (12 | 6.9%), and Production (6 | 3.5%).
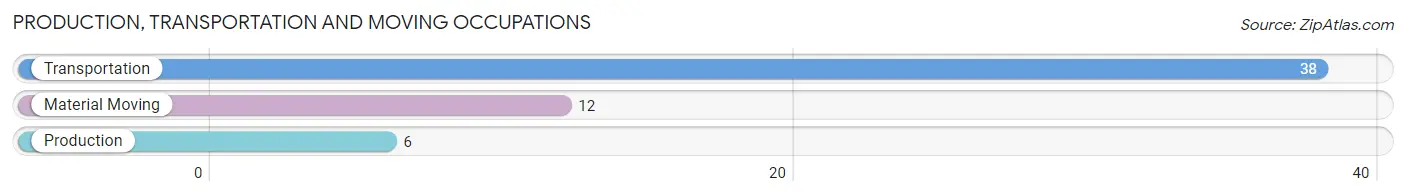
Production, Transportation and Moving Occupations by Sex
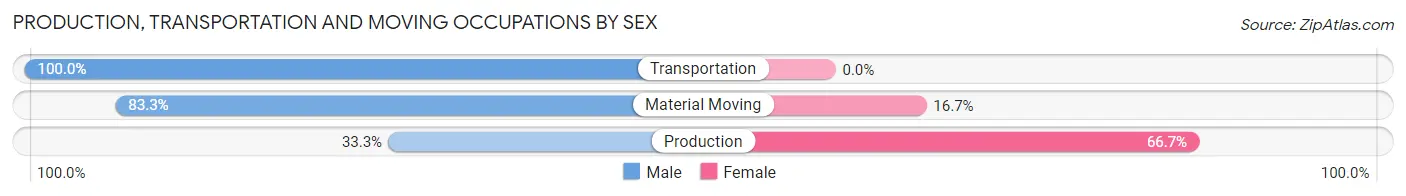
| Occupation | Male | Female |
| Production | 2 (33.3%) | 4 (66.7%) |
| Transportation | 38 (100.0%) | 0 (0.0%) |
| Material Moving | 10 (83.3%) | 2 (16.7%) |
| Total (Category) | 50 (89.3%) | 6 (10.7%) |
| Total (Overall) | 98 (56.7%) | 75 (43.3%) |
Employment Industries by Sex in Oak Grove
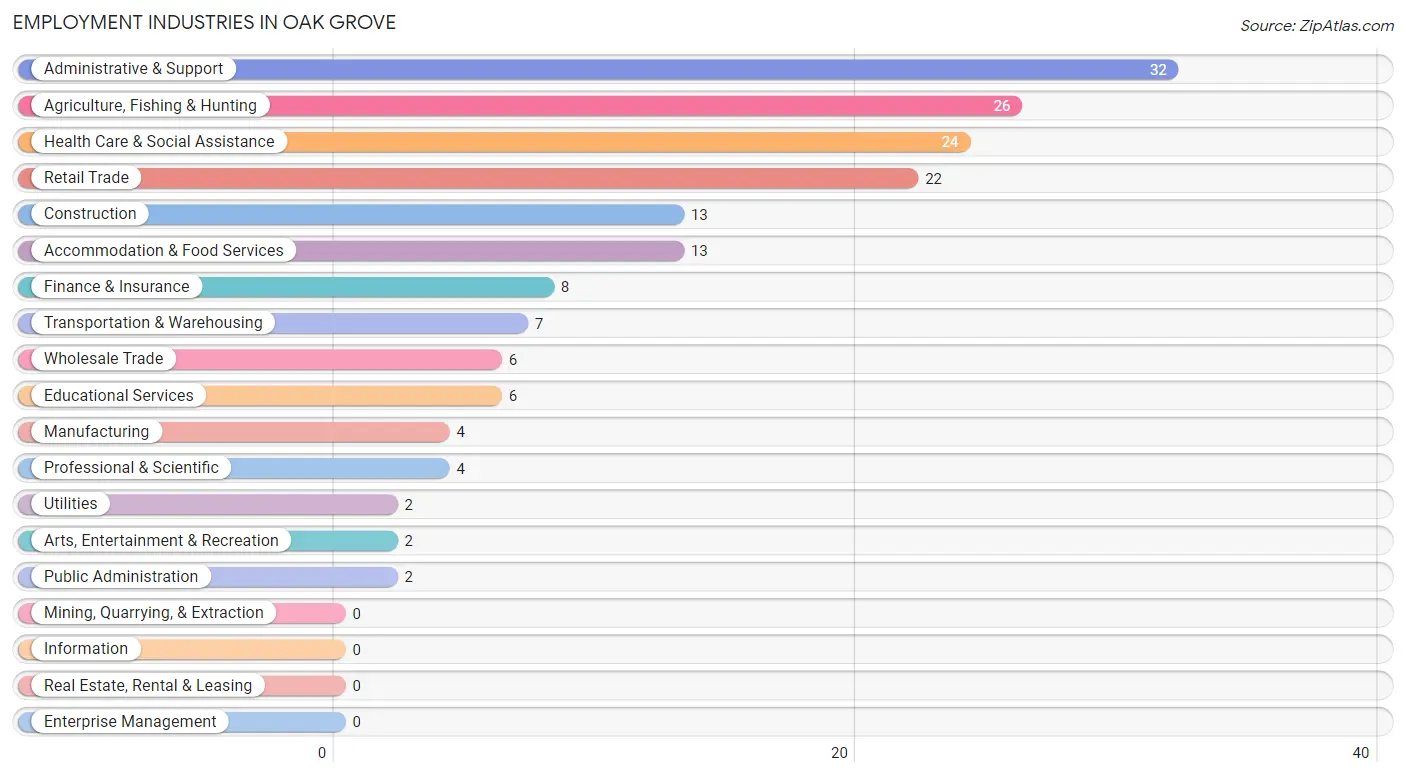
Employment Industries in Oak Grove
The major employment industries in Oak Grove include Administrative & Support (32 | 18.5%), Agriculture, Fishing & Hunting (26 | 15.0%), Health Care & Social Assistance (24 | 13.9%), Retail Trade (22 | 12.7%), and Construction (13 | 7.5%).
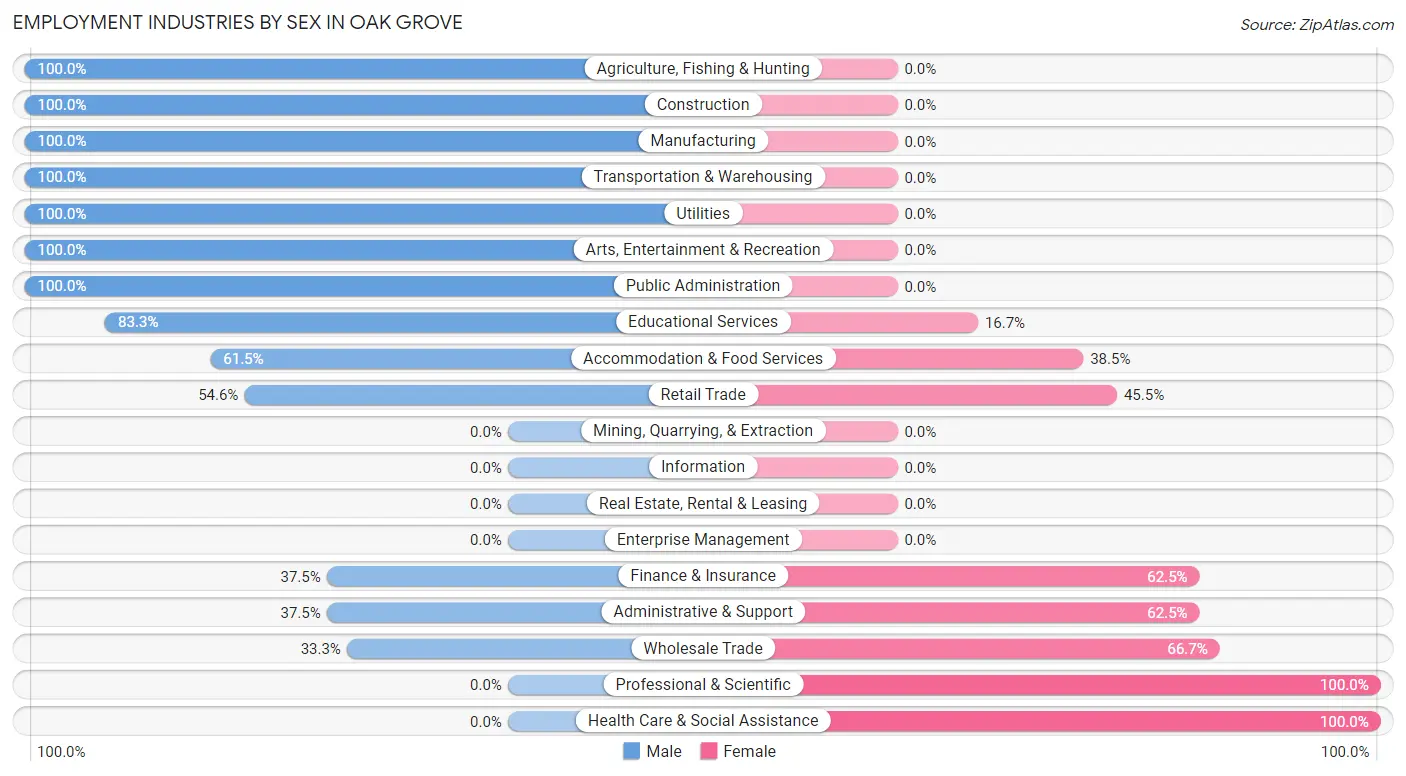
Employment Industries by Sex in Oak Grove
The Oak Grove industries that see more men than women are Agriculture, Fishing & Hunting (100.0%), Construction (100.0%), and Manufacturing (100.0%), whereas the industries that tend to have a higher number of women are Professional & Scientific (100.0%), Health Care & Social Assistance (100.0%), and Wholesale Trade (66.7%).
| Industry | Male | Female |
| Agriculture, Fishing & Hunting | 26 (100.0%) | 0 (0.0%) |
| Mining, Quarrying, & Extraction | 0 (0.0%) | 0 (0.0%) |
| Construction | 13 (100.0%) | 0 (0.0%) |
| Manufacturing | 4 (100.0%) | 0 (0.0%) |
| Wholesale Trade | 2 (33.3%) | 4 (66.7%) |
| Retail Trade | 12 (54.5%) | 10 (45.5%) |
| Transportation & Warehousing | 7 (100.0%) | 0 (0.0%) |
| Utilities | 2 (100.0%) | 0 (0.0%) |
| Information | 0 (0.0%) | 0 (0.0%) |
| Finance & Insurance | 3 (37.5%) | 5 (62.5%) |
| Real Estate, Rental & Leasing | 0 (0.0%) | 0 (0.0%) |
| Professional & Scientific | 0 (0.0%) | 4 (100.0%) |
| Enterprise Management | 0 (0.0%) | 0 (0.0%) |
| Administrative & Support | 12 (37.5%) | 20 (62.5%) |
| Educational Services | 5 (83.3%) | 1 (16.7%) |
| Health Care & Social Assistance | 0 (0.0%) | 24 (100.0%) |
| Arts, Entertainment & Recreation | 2 (100.0%) | 0 (0.0%) |
| Accommodation & Food Services | 8 (61.5%) | 5 (38.5%) |
| Public Administration | 2 (100.0%) | 0 (0.0%) |
| Total | 98 (56.7%) | 75 (43.3%) |
Education in Oak Grove
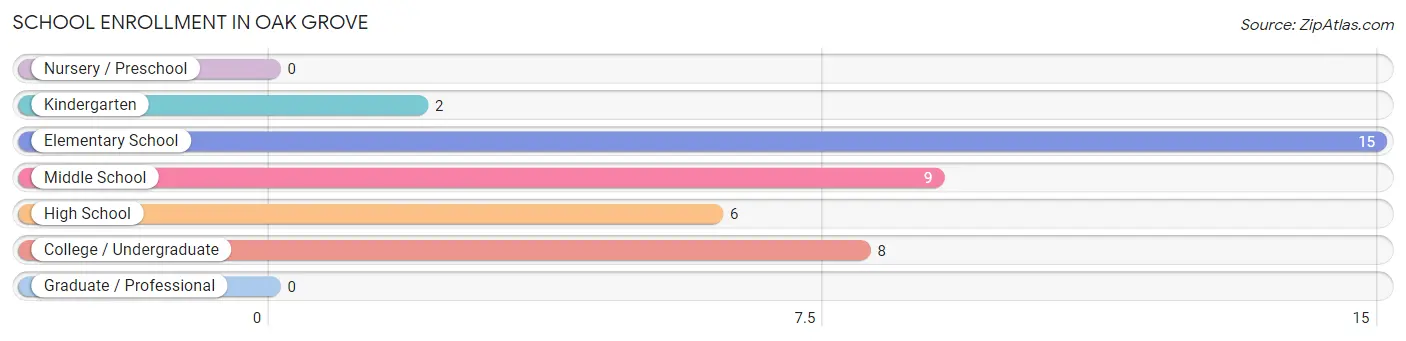
School Enrollment in Oak Grove
The most common levels of schooling among the 40 students in Oak Grove are elementary school (15 | 37.5%), middle school (9 | 22.5%), and college / undergraduate (8 | 20.0%).
| School Level | # Students | % Students |
| Nursery / Preschool | 0 | 0.0% |
| Kindergarten | 2 | 5.0% |
| Elementary School | 15 | 37.5% |
| Middle School | 9 | 22.5% |
| High School | 6 | 15.0% |
| College / Undergraduate | 8 | 20.0% |
| Graduate / Professional | 0 | 0.0% |
| Total | 40 | 100.0% |
School Enrollment by Age by Funding Source in Oak Grove
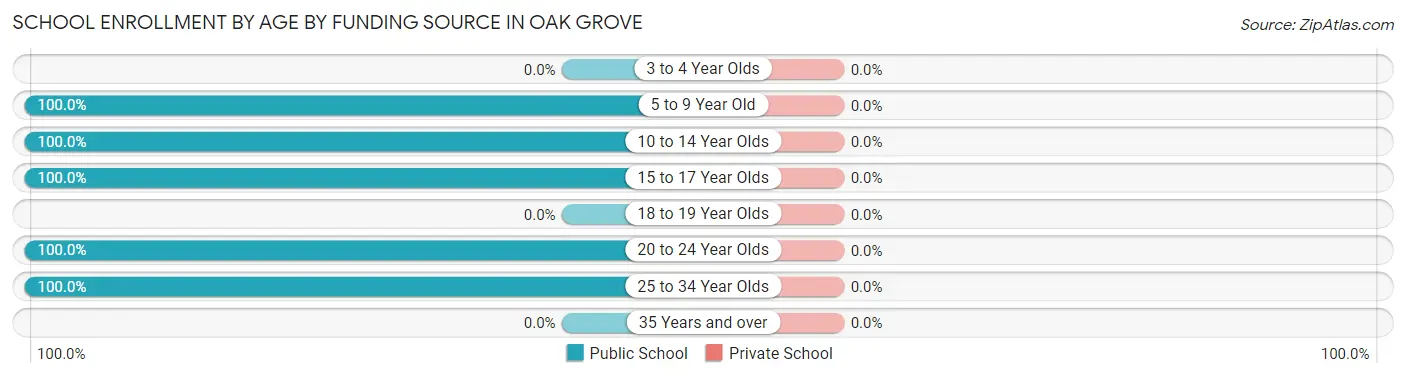
| Age Bracket | Public School | Private School |
| 3 to 4 Year Olds | 0 (0.0%) | 0 (0.0%) |
| 5 to 9 Year Old | 17 (100.0%) | 0 (0.0%) |
| 10 to 14 Year Olds | 9 (100.0%) | 0 (0.0%) |
| 15 to 17 Year Olds | 6 (100.0%) | 0 (0.0%) |
| 18 to 19 Year Olds | 0 (0.0%) | 0 (0.0%) |
| 20 to 24 Year Olds | 4 (100.0%) | 0 (0.0%) |
| 25 to 34 Year Olds | 4 (100.0%) | 0 (0.0%) |
| 35 Years and over | 0 (0.0%) | 0 (0.0%) |
| Total | 40 (100.0%) | 0 (0.0%) |
Educational Attainment by Field of Study in Oak Grove
Business (12 | 41.4%), education (6 | 20.7%), arts & humanities (5 | 17.2%), bio, nature & agricultural (4 | 13.8%), and liberal arts & history (2 | 6.9%) are the most common fields of study among 29 individuals in Oak Grove who have obtained a bachelor's degree or higher.
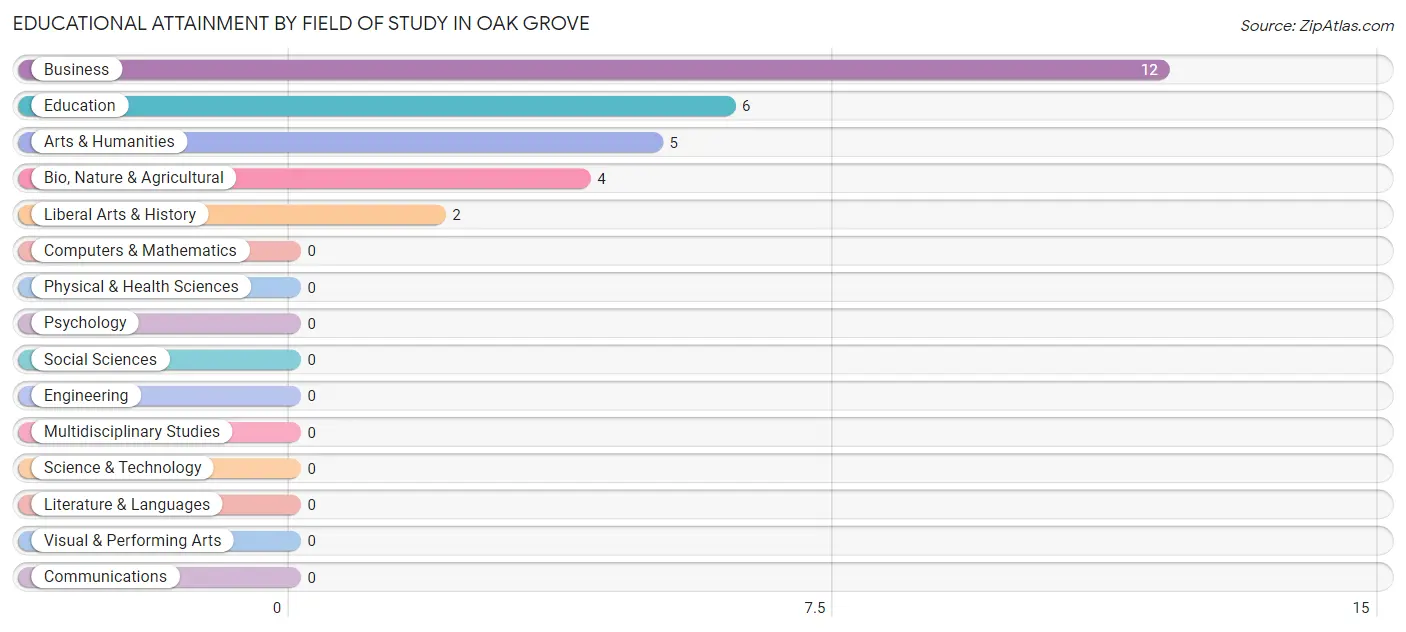
| Field of Study | # Graduates | % Graduates |
| Computers & Mathematics | 0 | 0.0% |
| Bio, Nature & Agricultural | 4 | 13.8% |
| Physical & Health Sciences | 0 | 0.0% |
| Psychology | 0 | 0.0% |
| Social Sciences | 0 | 0.0% |
| Engineering | 0 | 0.0% |
| Multidisciplinary Studies | 0 | 0.0% |
| Science & Technology | 0 | 0.0% |
| Business | 12 | 41.4% |
| Education | 6 | 20.7% |
| Literature & Languages | 0 | 0.0% |
| Liberal Arts & History | 2 | 6.9% |
| Visual & Performing Arts | 0 | 0.0% |
| Communications | 0 | 0.0% |
| Arts & Humanities | 5 | 17.2% |
| Total | 29 | 100.0% |
Transportation & Commute in Oak Grove
Vehicle Availability by Sex in Oak Grove
The most prevalent vehicle ownership categories in Oak Grove are males with 1 vehicle (48, accounting for 49.0%) and females with 1 vehicle (23, making up 64.0%).
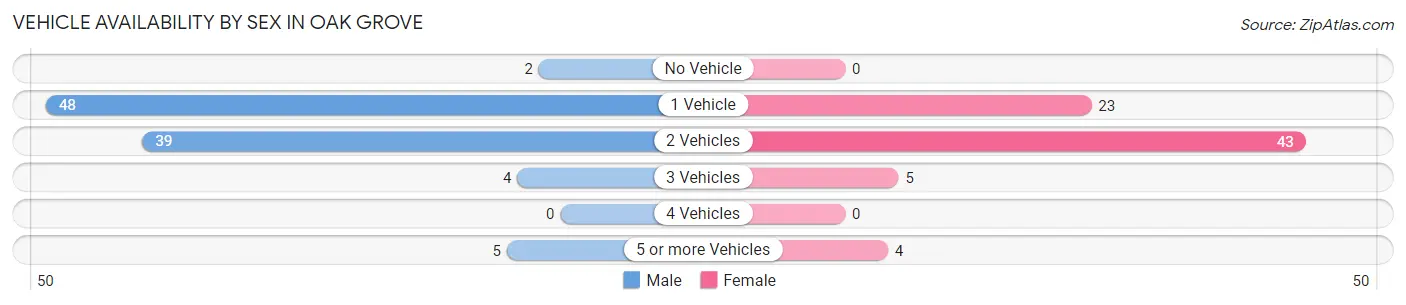
| Vehicles Available | Male | Female |
| No Vehicle | 2 (2.0%) | 0 (0.0%) |
| 1 Vehicle | 48 (49.0%) | 23 (30.7%) |
| 2 Vehicles | 39 (39.8%) | 43 (57.3%) |
| 3 Vehicles | 4 (4.1%) | 5 (6.7%) |
| 4 Vehicles | 0 (0.0%) | 0 (0.0%) |
| 5 or more Vehicles | 5 (5.1%) | 4 (5.3%) |
| Total | 98 (100.0%) | 75 (100.0%) |
Commute Time in Oak Grove
The most frequently occuring commute durations in Oak Grove are 15 to 19 minutes (41 commuters, 24.3%), 35 to 39 minutes (29 commuters, 17.2%), and 10 to 14 minutes (24 commuters, 14.2%).
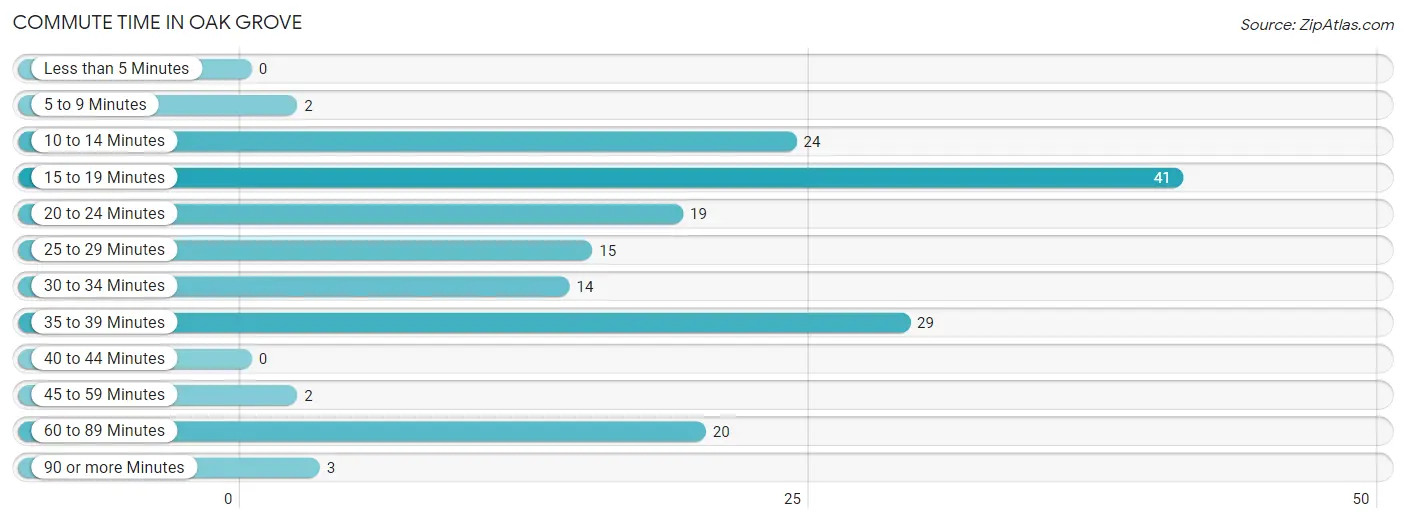
| Commute Time | # Commuters | % Commuters |
| Less than 5 Minutes | 0 | 0.0% |
| 5 to 9 Minutes | 2 | 1.2% |
| 10 to 14 Minutes | 24 | 14.2% |
| 15 to 19 Minutes | 41 | 24.3% |
| 20 to 24 Minutes | 19 | 11.2% |
| 25 to 29 Minutes | 15 | 8.9% |
| 30 to 34 Minutes | 14 | 8.3% |
| 35 to 39 Minutes | 29 | 17.2% |
| 40 to 44 Minutes | 0 | 0.0% |
| 45 to 59 Minutes | 2 | 1.2% |
| 60 to 89 Minutes | 20 | 11.8% |
| 90 or more Minutes | 3 | 1.8% |
Commute Time by Sex in Oak Grove
The most common commute times in Oak Grove are 35 to 39 minutes (26 commuters, 26.5%) for males and 15 to 19 minutes (25 commuters, 35.2%) for females.
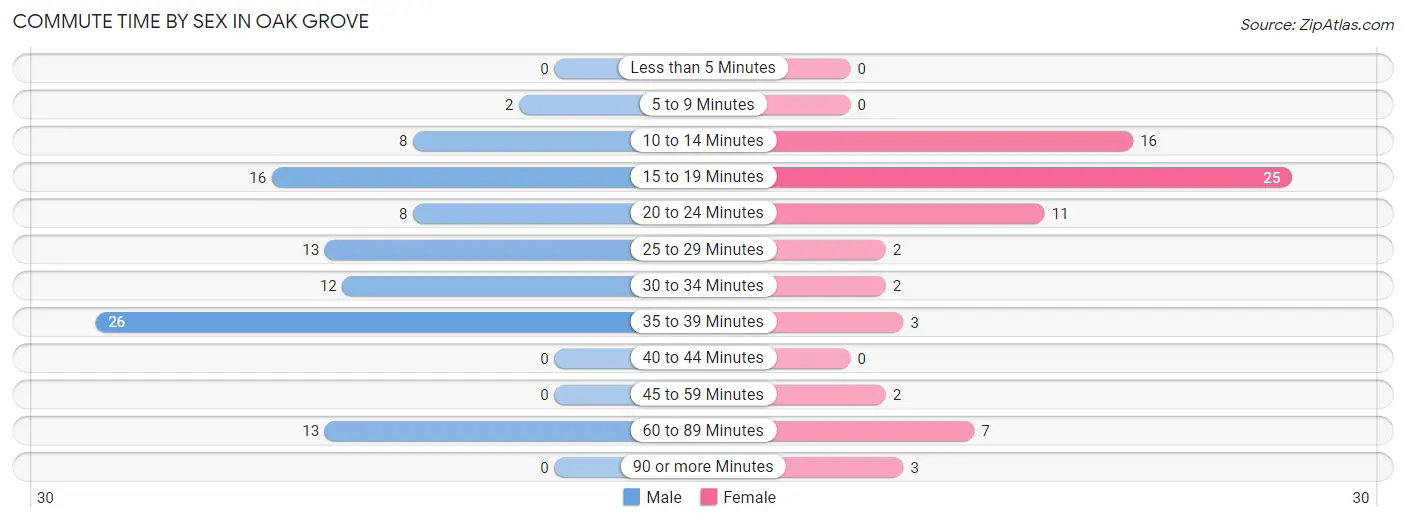
| Commute Time | Male | Female |
| Less than 5 Minutes | 0 (0.0%) | 0 (0.0%) |
| 5 to 9 Minutes | 2 (2.0%) | 0 (0.0%) |
| 10 to 14 Minutes | 8 (8.2%) | 16 (22.5%) |
| 15 to 19 Minutes | 16 (16.3%) | 25 (35.2%) |
| 20 to 24 Minutes | 8 (8.2%) | 11 (15.5%) |
| 25 to 29 Minutes | 13 (13.3%) | 2 (2.8%) |
| 30 to 34 Minutes | 12 (12.2%) | 2 (2.8%) |
| 35 to 39 Minutes | 26 (26.5%) | 3 (4.2%) |
| 40 to 44 Minutes | 0 (0.0%) | 0 (0.0%) |
| 45 to 59 Minutes | 0 (0.0%) | 2 (2.8%) |
| 60 to 89 Minutes | 13 (13.3%) | 7 (9.9%) |
| 90 or more Minutes | 0 (0.0%) | 3 (4.2%) |
Time of Departure to Work by Sex in Oak Grove
The most frequent times of departure to work in Oak Grove are 12:00 AM to 4:59 AM (37, 37.8%) for males and 7:00 AM to 7:29 AM (18, 25.4%) for females.
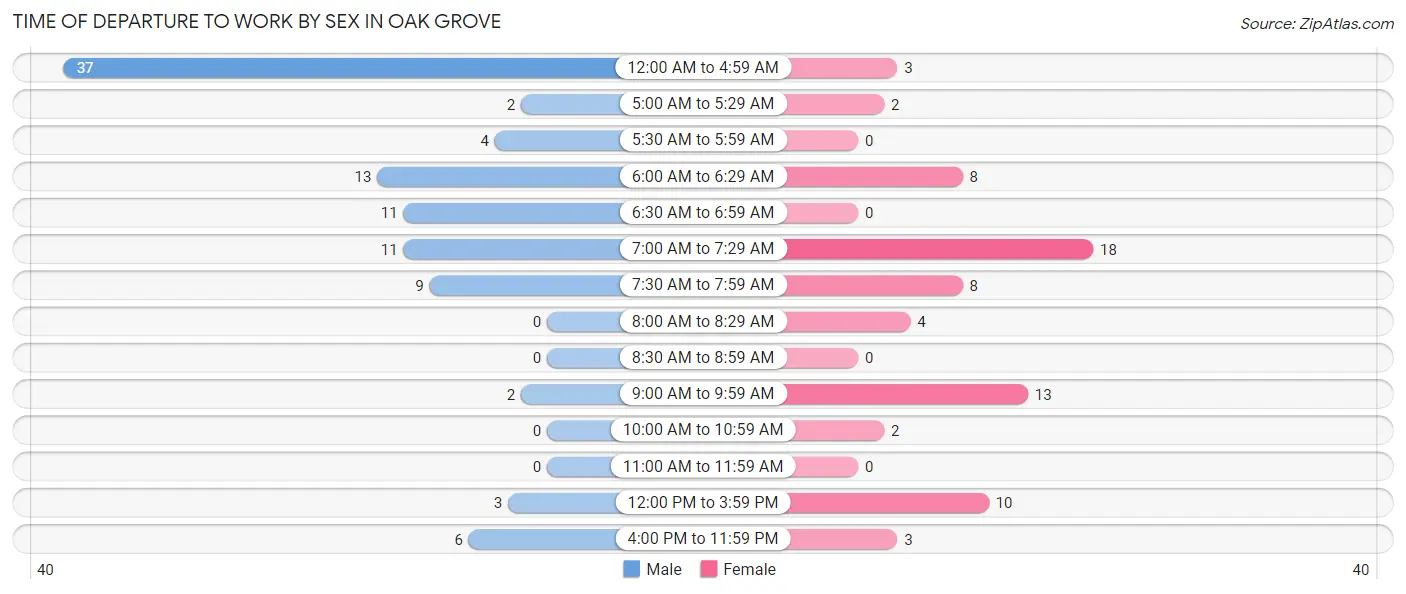
| Time of Departure | Male | Female |
| 12:00 AM to 4:59 AM | 37 (37.8%) | 3 (4.2%) |
| 5:00 AM to 5:29 AM | 2 (2.0%) | 2 (2.8%) |
| 5:30 AM to 5:59 AM | 4 (4.1%) | 0 (0.0%) |
| 6:00 AM to 6:29 AM | 13 (13.3%) | 8 (11.3%) |
| 6:30 AM to 6:59 AM | 11 (11.2%) | 0 (0.0%) |
| 7:00 AM to 7:29 AM | 11 (11.2%) | 18 (25.4%) |
| 7:30 AM to 7:59 AM | 9 (9.2%) | 8 (11.3%) |
| 8:00 AM to 8:29 AM | 0 (0.0%) | 4 (5.6%) |
| 8:30 AM to 8:59 AM | 0 (0.0%) | 0 (0.0%) |
| 9:00 AM to 9:59 AM | 2 (2.0%) | 13 (18.3%) |
| 10:00 AM to 10:59 AM | 0 (0.0%) | 2 (2.8%) |
| 11:00 AM to 11:59 AM | 0 (0.0%) | 0 (0.0%) |
| 12:00 PM to 3:59 PM | 3 (3.1%) | 10 (14.1%) |
| 4:00 PM to 11:59 PM | 6 (6.1%) | 3 (4.2%) |
| Total | 98 (100.0%) | 71 (100.0%) |
Housing Occupancy in Oak Grove
Occupancy by Ownership in Oak Grove
Of the total 199 dwellings in Oak Grove, owner-occupied units account for 172 (86.4%), while renter-occupied units make up 27 (13.6%).
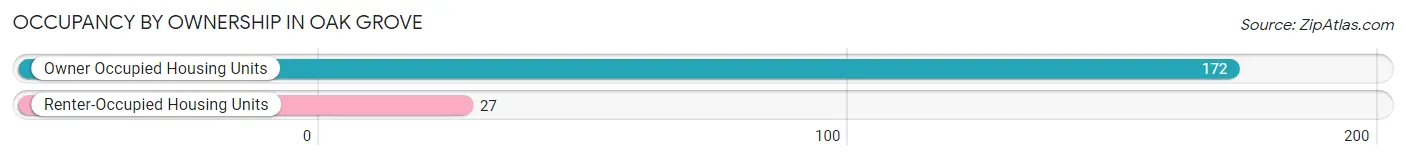
| Occupancy | # Housing Units | % Housing Units |
| Owner Occupied Housing Units | 172 | 86.4% |
| Renter-Occupied Housing Units | 27 | 13.6% |
| Total Occupied Housing Units | 199 | 100.0% |
Occupancy by Household Size in Oak Grove
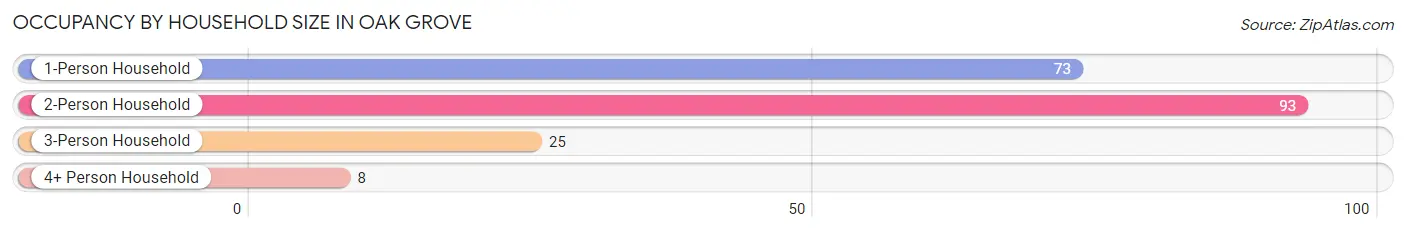
| Household Size | # Housing Units | % Housing Units |
| 1-Person Household | 73 | 36.7% |
| 2-Person Household | 93 | 46.7% |
| 3-Person Household | 25 | 12.6% |
| 4+ Person Household | 8 | 4.0% |
| Total Housing Units | 199 | 100.0% |
Occupancy by Ownership by Household Size in Oak Grove
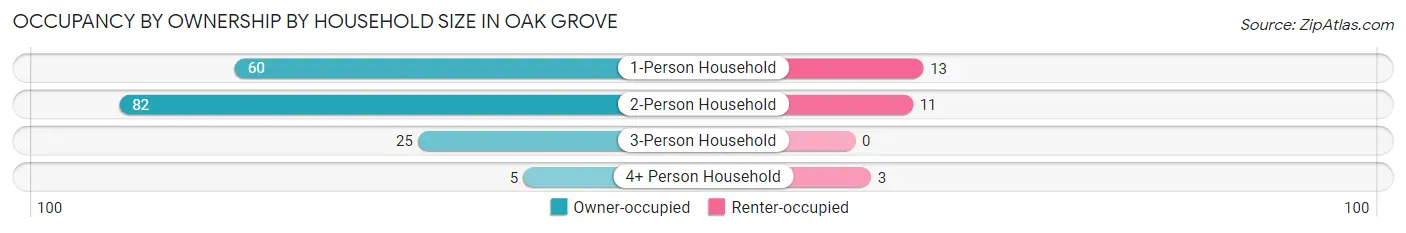
| Household Size | Owner-occupied | Renter-occupied |
| 1-Person Household | 60 (82.2%) | 13 (17.8%) |
| 2-Person Household | 82 (88.2%) | 11 (11.8%) |
| 3-Person Household | 25 (100.0%) | 0 (0.0%) |
| 4+ Person Household | 5 (62.5%) | 3 (37.5%) |
| Total Housing Units | 172 (86.4%) | 27 (13.6%) |
Occupancy by Educational Attainment in Oak Grove
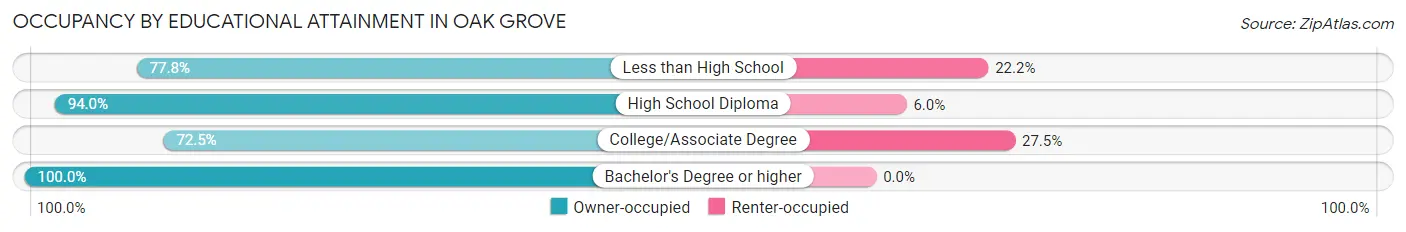
| Household Size | Owner-occupied | Renter-occupied |
| Less than High School | 7 (77.8%) | 2 (22.2%) |
| High School Diploma | 94 (94.0%) | 6 (6.0%) |
| College/Associate Degree | 50 (72.5%) | 19 (27.5%) |
| Bachelor's Degree or higher | 21 (100.0%) | 0 (0.0%) |
Occupancy by Age of Householder in Oak Grove
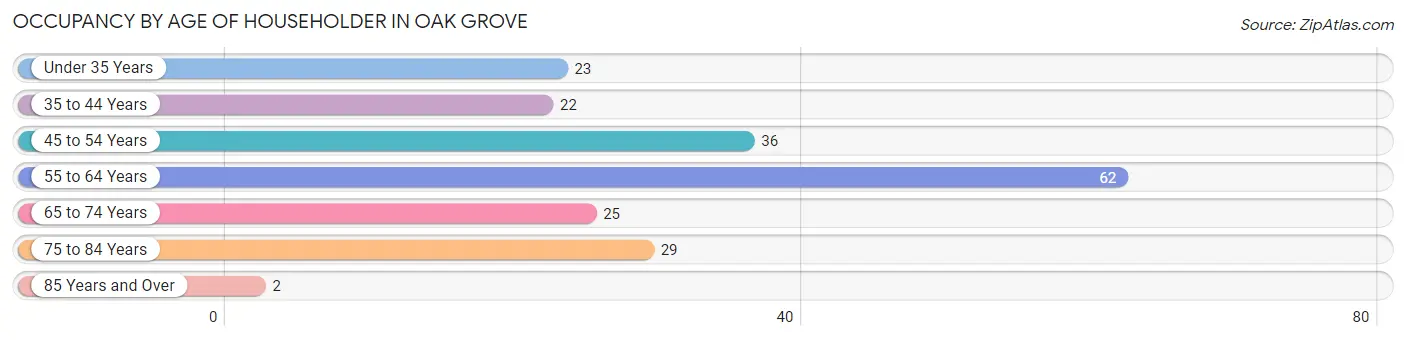
| Age Bracket | # Households | % Households |
| Under 35 Years | 23 | 11.6% |
| 35 to 44 Years | 22 | 11.1% |
| 45 to 54 Years | 36 | 18.1% |
| 55 to 64 Years | 62 | 31.2% |
| 65 to 74 Years | 25 | 12.6% |
| 75 to 84 Years | 29 | 14.6% |
| 85 Years and Over | 2 | 1.0% |
| Total | 199 | 100.0% |
Housing Finances in Oak Grove
Median Income by Occupancy in Oak Grove
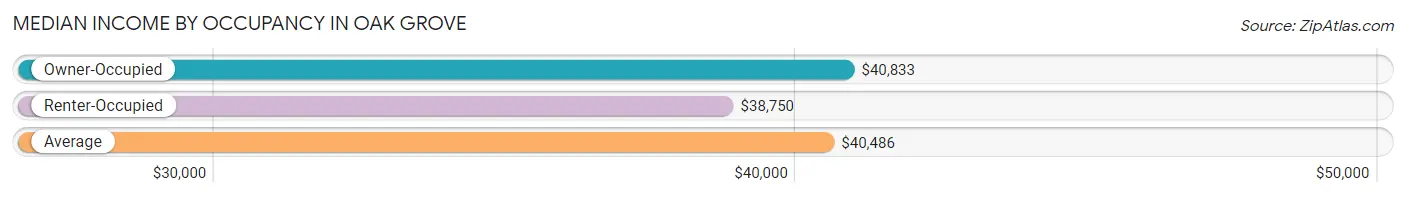
| Occupancy Type | # Households | Median Income |
| Owner-Occupied | 172 (86.4%) | $40,833 |
| Renter-Occupied | 27 (13.6%) | $38,750 |
| Average | 199 (100.0%) | $40,486 |
Occupancy by Householder Income Bracket in Oak Grove
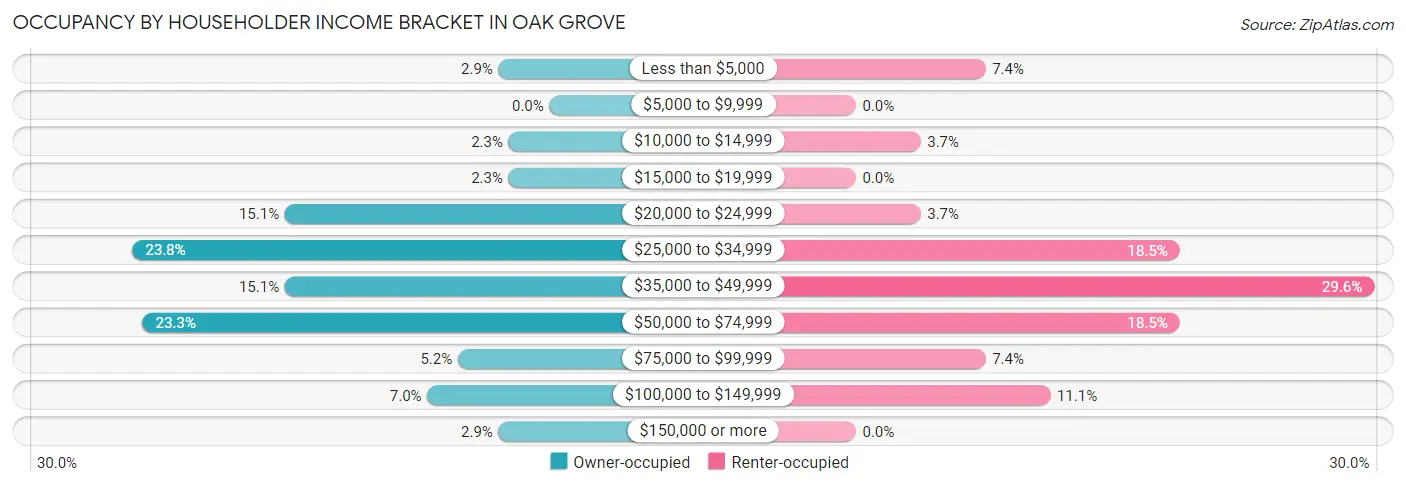
| Income Bracket | Owner-occupied | Renter-occupied |
| Less than $5,000 | 5 (2.9%) | 2 (7.4%) |
| $5,000 to $9,999 | 0 (0.0%) | 0 (0.0%) |
| $10,000 to $14,999 | 4 (2.3%) | 1 (3.7%) |
| $15,000 to $19,999 | 4 (2.3%) | 0 (0.0%) |
| $20,000 to $24,999 | 26 (15.1%) | 1 (3.7%) |
| $25,000 to $34,999 | 41 (23.8%) | 5 (18.5%) |
| $35,000 to $49,999 | 26 (15.1%) | 8 (29.6%) |
| $50,000 to $74,999 | 40 (23.3%) | 5 (18.5%) |
| $75,000 to $99,999 | 9 (5.2%) | 2 (7.4%) |
| $100,000 to $149,999 | 12 (7.0%) | 3 (11.1%) |
| $150,000 or more | 5 (2.9%) | 0 (0.0%) |
| Total | 172 (100.0%) | 27 (100.0%) |
Monthly Housing Cost Tiers in Oak Grove
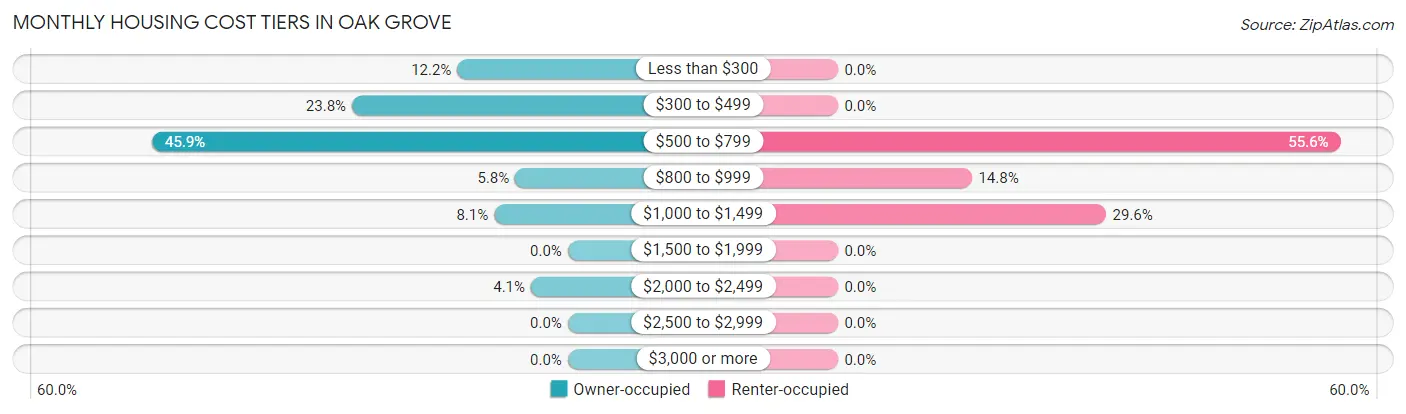
| Monthly Cost | Owner-occupied | Renter-occupied |
| Less than $300 | 21 (12.2%) | 0 (0.0%) |
| $300 to $499 | 41 (23.8%) | 0 (0.0%) |
| $500 to $799 | 79 (45.9%) | 15 (55.6%) |
| $800 to $999 | 10 (5.8%) | 4 (14.8%) |
| $1,000 to $1,499 | 14 (8.1%) | 8 (29.6%) |
| $1,500 to $1,999 | 0 (0.0%) | 0 (0.0%) |
| $2,000 to $2,499 | 7 (4.1%) | 0 (0.0%) |
| $2,500 to $2,999 | 0 (0.0%) | 0 (0.0%) |
| $3,000 or more | 0 (0.0%) | 0 (0.0%) |
| Total | 172 (100.0%) | 27 (100.0%) |
Physical Housing Characteristics in Oak Grove
Housing Structures in Oak Grove
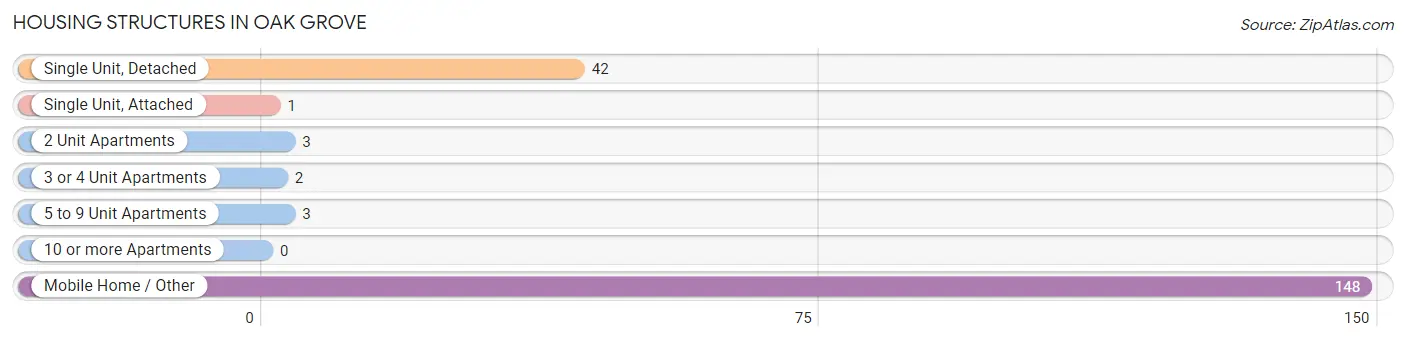
| Structure Type | # Housing Units | % Housing Units |
| Single Unit, Detached | 42 | 21.1% |
| Single Unit, Attached | 1 | 0.5% |
| 2 Unit Apartments | 3 | 1.5% |
| 3 or 4 Unit Apartments | 2 | 1.0% |
| 5 to 9 Unit Apartments | 3 | 1.5% |
| 10 or more Apartments | 0 | 0.0% |
| Mobile Home / Other | 148 | 74.4% |
| Total | 199 | 100.0% |
Housing Structures by Occupancy in Oak Grove
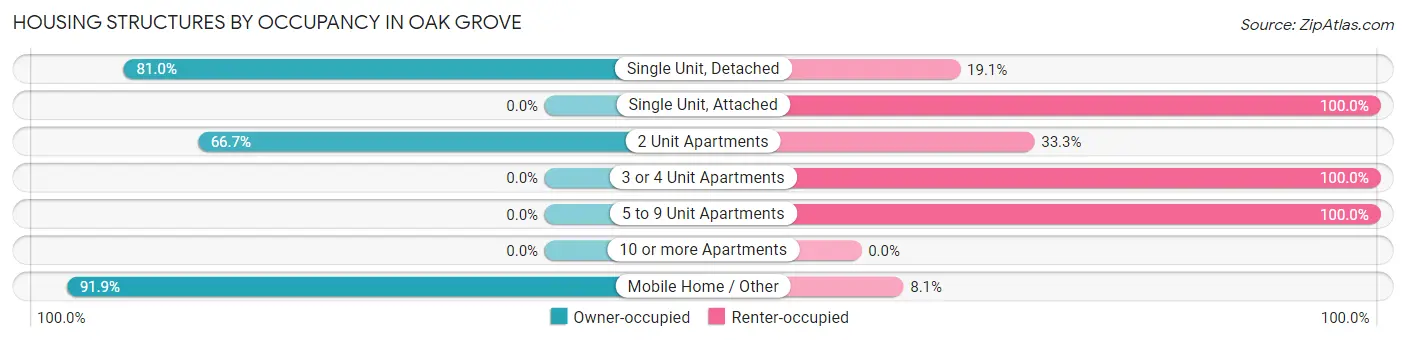
| Structure Type | Owner-occupied | Renter-occupied |
| Single Unit, Detached | 34 (80.9%) | 8 (19.1%) |
| Single Unit, Attached | 0 (0.0%) | 1 (100.0%) |
| 2 Unit Apartments | 2 (66.7%) | 1 (33.3%) |
| 3 or 4 Unit Apartments | 0 (0.0%) | 2 (100.0%) |
| 5 to 9 Unit Apartments | 0 (0.0%) | 3 (100.0%) |
| 10 or more Apartments | 0 (0.0%) | 0 (0.0%) |
| Mobile Home / Other | 136 (91.9%) | 12 (8.1%) |
| Total | 172 (86.4%) | 27 (13.6%) |
Housing Structures by Number of Rooms in Oak Grove
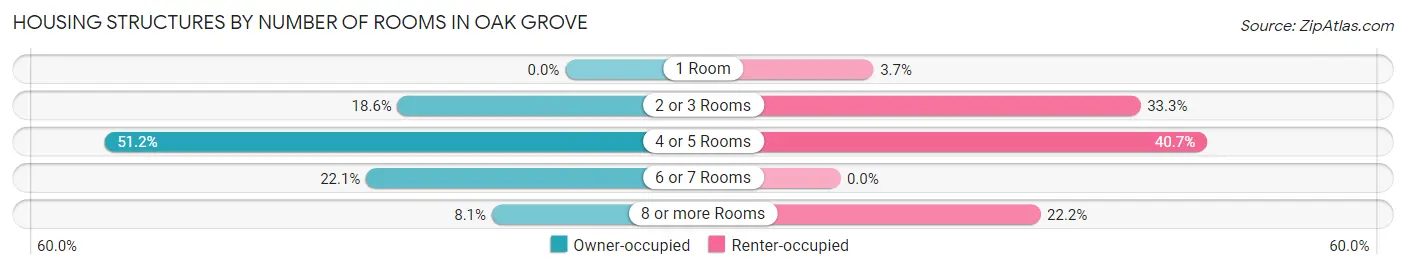
| Number of Rooms | Owner-occupied | Renter-occupied |
| 1 Room | 0 (0.0%) | 1 (3.7%) |
| 2 or 3 Rooms | 32 (18.6%) | 9 (33.3%) |
| 4 or 5 Rooms | 88 (51.2%) | 11 (40.7%) |
| 6 or 7 Rooms | 38 (22.1%) | 0 (0.0%) |
| 8 or more Rooms | 14 (8.1%) | 6 (22.2%) |
| Total | 172 (100.0%) | 27 (100.0%) |
Housing Structure by Heating Type in Oak Grove
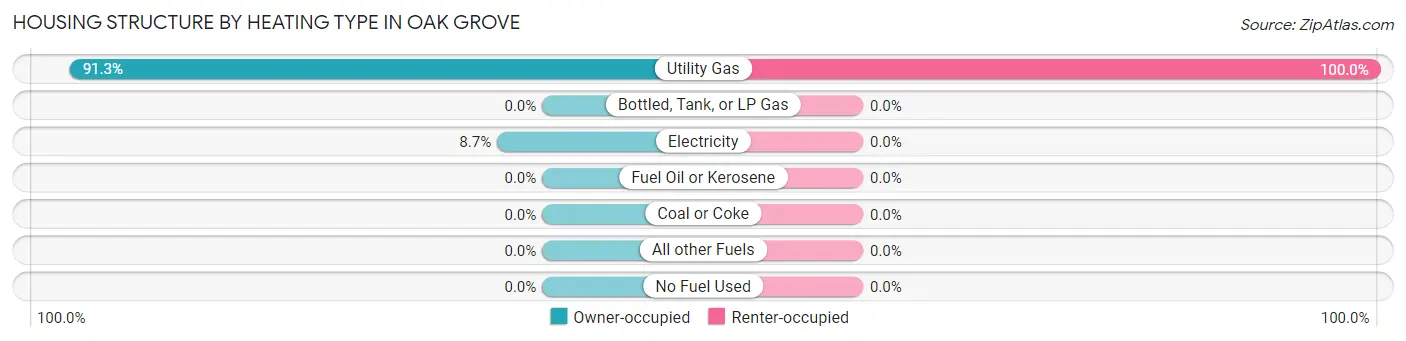
| Heating Type | Owner-occupied | Renter-occupied |
| Utility Gas | 157 (91.3%) | 27 (100.0%) |
| Bottled, Tank, or LP Gas | 0 (0.0%) | 0 (0.0%) |
| Electricity | 15 (8.7%) | 0 (0.0%) |
| Fuel Oil or Kerosene | 0 (0.0%) | 0 (0.0%) |
| Coal or Coke | 0 (0.0%) | 0 (0.0%) |
| All other Fuels | 0 (0.0%) | 0 (0.0%) |
| No Fuel Used | 0 (0.0%) | 0 (0.0%) |
| Total | 172 (100.0%) | 27 (100.0%) |
Household Vehicle Usage in Oak Grove
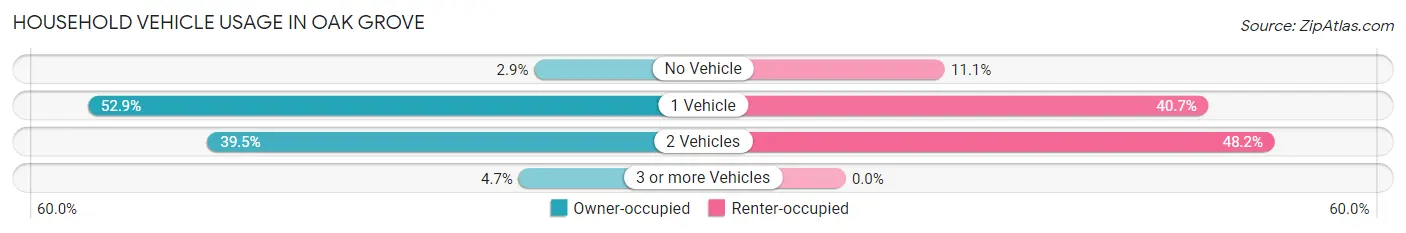
| Vehicles per Household | Owner-occupied | Renter-occupied |
| No Vehicle | 5 (2.9%) | 3 (11.1%) |
| 1 Vehicle | 91 (52.9%) | 11 (40.7%) |
| 2 Vehicles | 68 (39.5%) | 13 (48.1%) |
| 3 or more Vehicles | 8 (4.6%) | 0 (0.0%) |
| Total | 172 (100.0%) | 27 (100.0%) |
Real Estate & Mortgages in Oak Grove
Real Estate and Mortgage Overview in Oak Grove
| Characteristic | Without Mortgage | With Mortgage |
| Housing Units | 147 | 25 |
| Median Property Value | $9,999 | $0 |
| Median Household Income | $30,417 | $0 |
| Monthly Housing Costs | $534 | $0 |
| Real Estate Taxes | $199 | $10 |
Property Value by Mortgage Status in Oak Grove
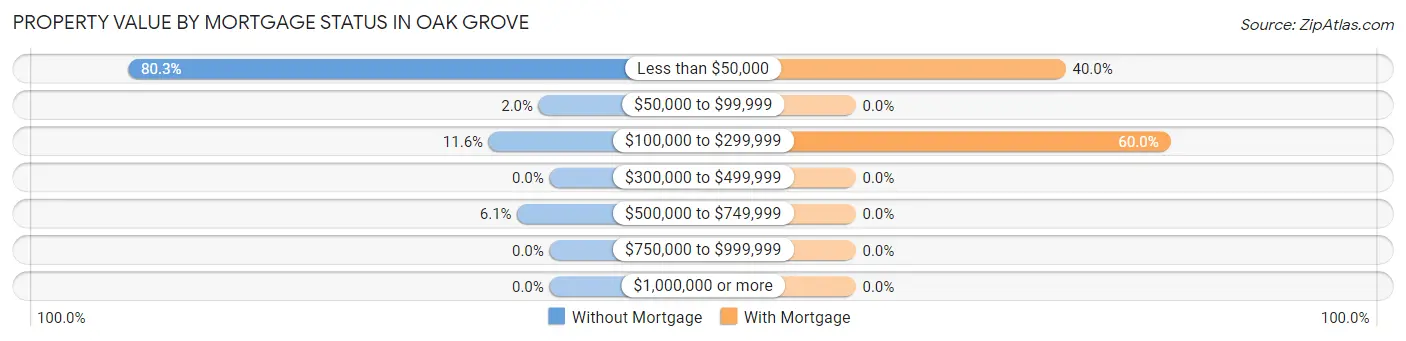
| Property Value | Without Mortgage | With Mortgage |
| Less than $50,000 | 118 (80.3%) | 10 (40.0%) |
| $50,000 to $99,999 | 3 (2.0%) | 0 (0.0%) |
| $100,000 to $299,999 | 17 (11.6%) | 15 (60.0%) |
| $300,000 to $499,999 | 0 (0.0%) | 0 (0.0%) |
| $500,000 to $749,999 | 9 (6.1%) | 0 (0.0%) |
| $750,000 to $999,999 | 0 (0.0%) | 0 (0.0%) |
| $1,000,000 or more | 0 (0.0%) | 0 (0.0%) |
| Total | 147 (100.0%) | 25 (100.0%) |
Household Income by Mortgage Status in Oak Grove
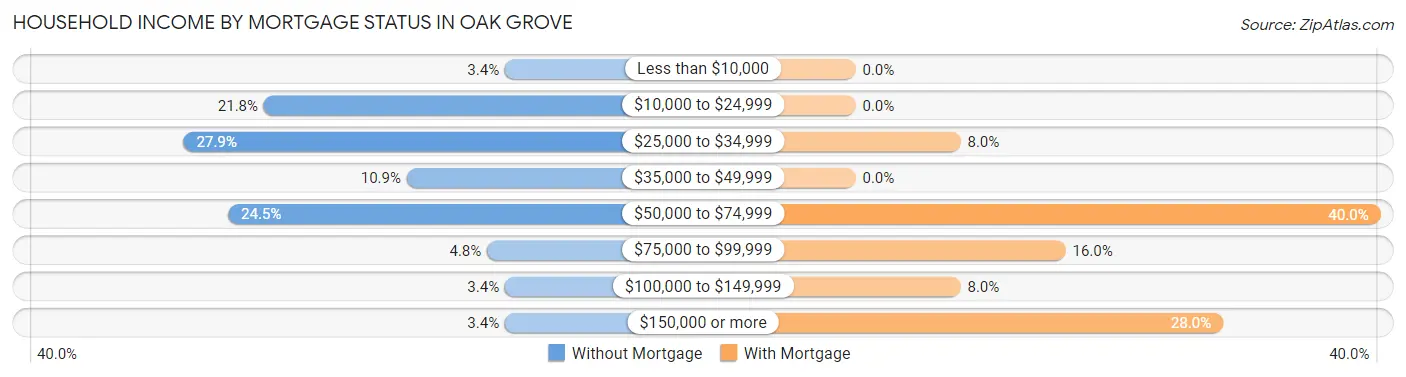
| Household Income | Without Mortgage | With Mortgage |
| Less than $10,000 | 5 (3.4%) | 0 (0.0%) |
| $10,000 to $24,999 | 32 (21.8%) | 0 (0.0%) |
| $25,000 to $34,999 | 41 (27.9%) | 2 (8.0%) |
| $35,000 to $49,999 | 16 (10.9%) | 0 (0.0%) |
| $50,000 to $74,999 | 36 (24.5%) | 10 (40.0%) |
| $75,000 to $99,999 | 7 (4.8%) | 4 (16.0%) |
| $100,000 to $149,999 | 5 (3.4%) | 2 (8.0%) |
| $150,000 or more | 5 (3.4%) | 7 (28.0%) |
| Total | 147 (100.0%) | 25 (100.0%) |
Property Value to Household Income Ratio in Oak Grove
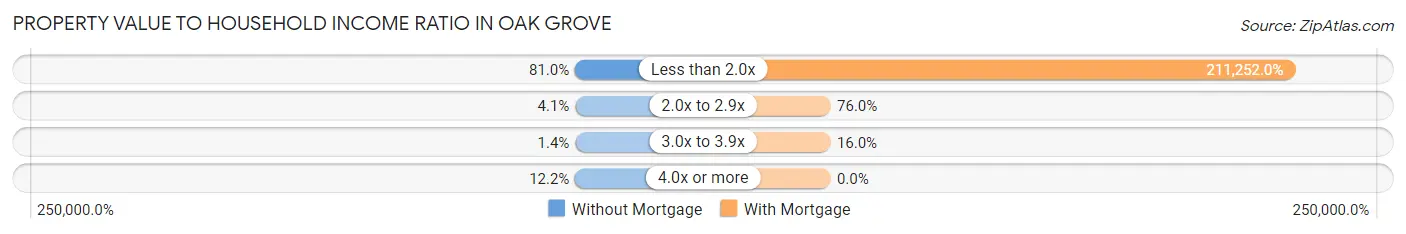
| Value-to-Income Ratio | Without Mortgage | With Mortgage |
| Less than 2.0x | 119 (80.9%) | 52,813 (211,252.0%) |
| 2.0x to 2.9x | 6 (4.1%) | 19 (76.0%) |
| 3.0x to 3.9x | 2 (1.4%) | 4 (16.0%) |
| 4.0x or more | 18 (12.2%) | 0 (0.0%) |
| Total | 147 (100.0%) | 25 (100.0%) |
Real Estate Taxes by Mortgage Status in Oak Grove
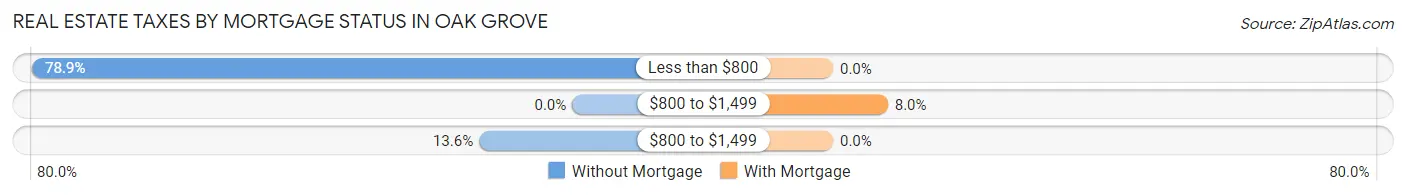
| Property Taxes | Without Mortgage | With Mortgage |
| Less than $800 | 116 (78.9%) | 0 (0.0%) |
| $800 to $1,499 | 0 (0.0%) | 2 (8.0%) |
| $800 to $1,499 | 20 (13.6%) | 0 (0.0%) |
| Total | 147 (100.0%) | 25 (100.0%) |
Health & Disability in Oak Grove
Health Insurance Coverage by Age in Oak Grove
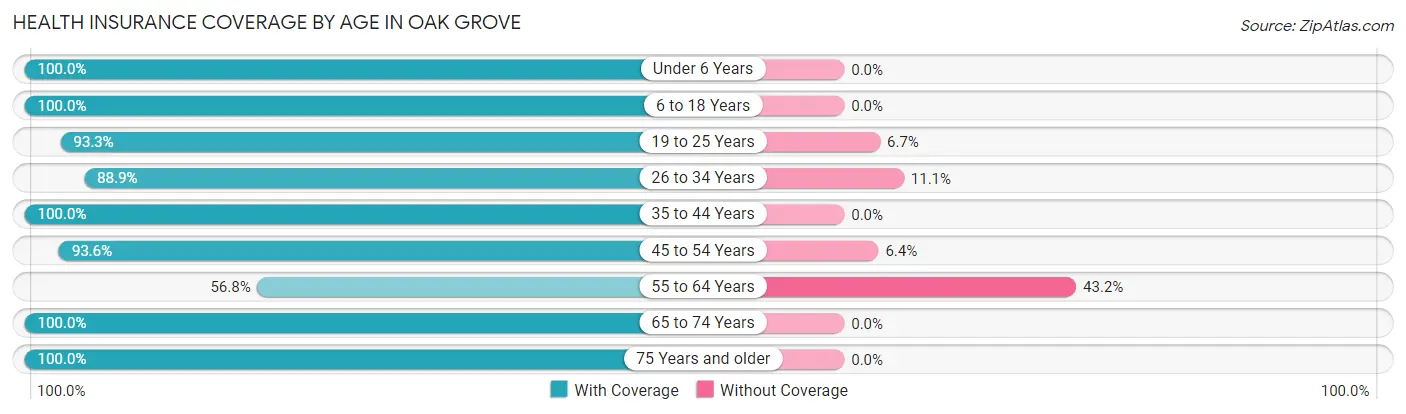
| Age Bracket | With Coverage | Without Coverage |
| Under 6 Years | 12 (100.0%) | 0 (0.0%) |
| 6 to 18 Years | 32 (100.0%) | 0 (0.0%) |
| 19 to 25 Years | 28 (93.3%) | 2 (6.7%) |
| 26 to 34 Years | 16 (88.9%) | 2 (11.1%) |
| 35 to 44 Years | 29 (100.0%) | 0 (0.0%) |
| 45 to 54 Years | 44 (93.6%) | 3 (6.4%) |
| 55 to 64 Years | 42 (56.8%) | 32 (43.2%) |
| 65 to 74 Years | 60 (100.0%) | 0 (0.0%) |
| 75 Years and older | 51 (100.0%) | 0 (0.0%) |
| Total | 314 (88.9%) | 39 (11.1%) |
Health Insurance Coverage by Citizenship Status in Oak Grove

| Citizenship Status | With Coverage | Without Coverage |
| Native Born | 12 (100.0%) | 0 (0.0%) |
| Foreign Born, Citizen | 32 (100.0%) | 0 (0.0%) |
| Foreign Born, not a Citizen | 28 (93.3%) | 2 (6.7%) |
Health Insurance Coverage by Household Income in Oak Grove
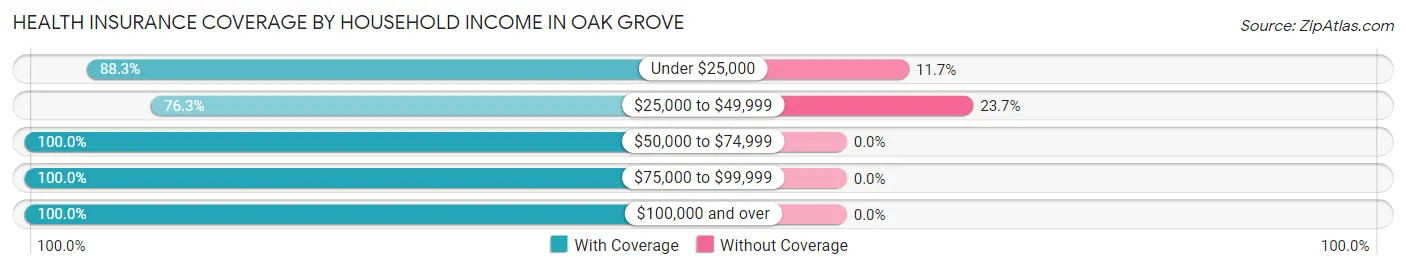
| Household Income | With Coverage | Without Coverage |
| Under $25,000 | 53 (88.3%) | 7 (11.7%) |
| $25,000 to $49,999 | 103 (76.3%) | 32 (23.7%) |
| $50,000 to $74,999 | 93 (100.0%) | 0 (0.0%) |
| $75,000 to $99,999 | 18 (100.0%) | 0 (0.0%) |
| $100,000 and over | 47 (100.0%) | 0 (0.0%) |
Public vs Private Health Insurance Coverage by Age in Oak Grove
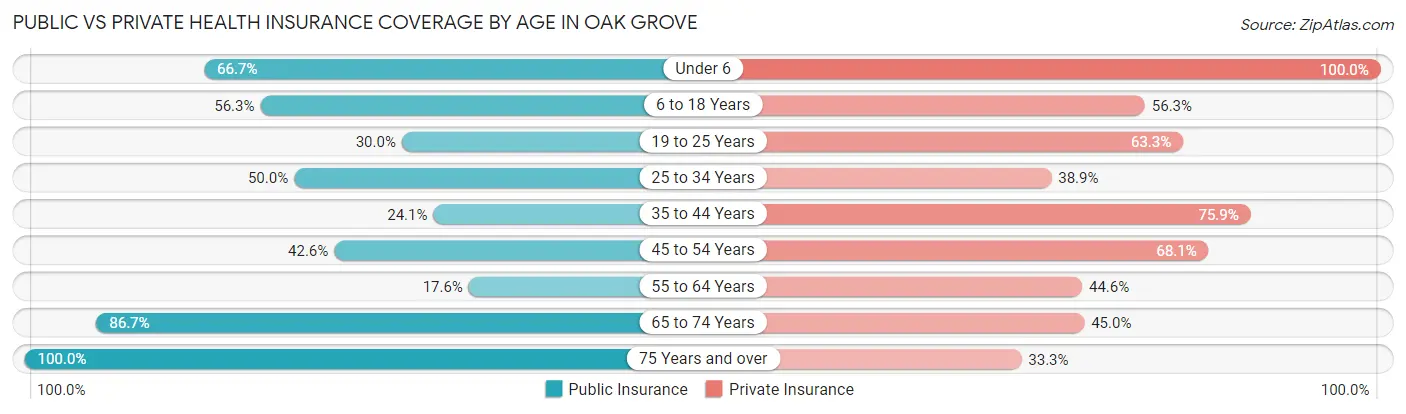
| Age Bracket | Public Insurance | Private Insurance |
| Under 6 | 8 (66.7%) | 12 (100.0%) |
| 6 to 18 Years | 18 (56.2%) | 18 (56.2%) |
| 19 to 25 Years | 9 (30.0%) | 19 (63.3%) |
| 25 to 34 Years | 9 (50.0%) | 7 (38.9%) |
| 35 to 44 Years | 7 (24.1%) | 22 (75.9%) |
| 45 to 54 Years | 20 (42.5%) | 32 (68.1%) |
| 55 to 64 Years | 13 (17.6%) | 33 (44.6%) |
| 65 to 74 Years | 52 (86.7%) | 27 (45.0%) |
| 75 Years and over | 51 (100.0%) | 17 (33.3%) |
| Total | 187 (53.0%) | 187 (53.0%) |
Disability Status by Sex by Age in Oak Grove
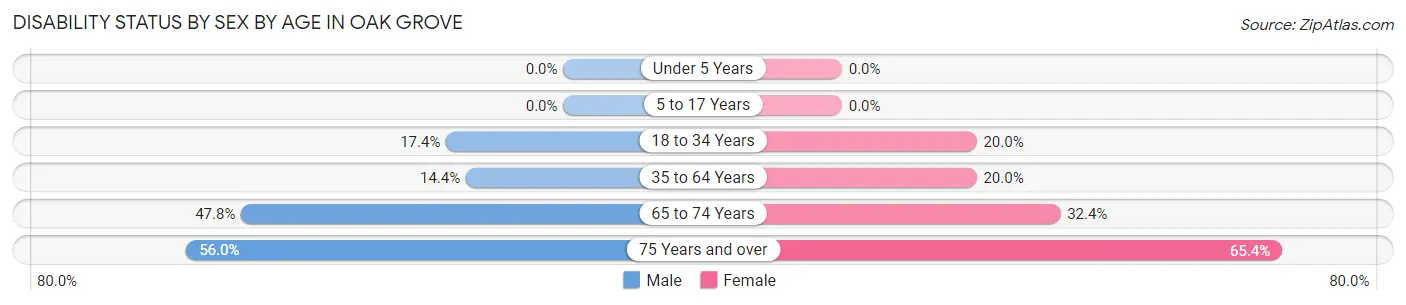
| Age Bracket | Male | Female |
| Under 5 Years | 0 (0.0%) | 0 (0.0%) |
| 5 to 17 Years | 0 (0.0%) | 0 (0.0%) |
| 18 to 34 Years | 4 (17.4%) | 5 (20.0%) |
| 35 to 64 Years | 13 (14.4%) | 12 (20.0%) |
| 65 to 74 Years | 11 (47.8%) | 12 (32.4%) |
| 75 Years and over | 14 (56.0%) | 17 (65.4%) |
Disability Class by Sex by Age in Oak Grove
Disability Class: Hearing Difficulty
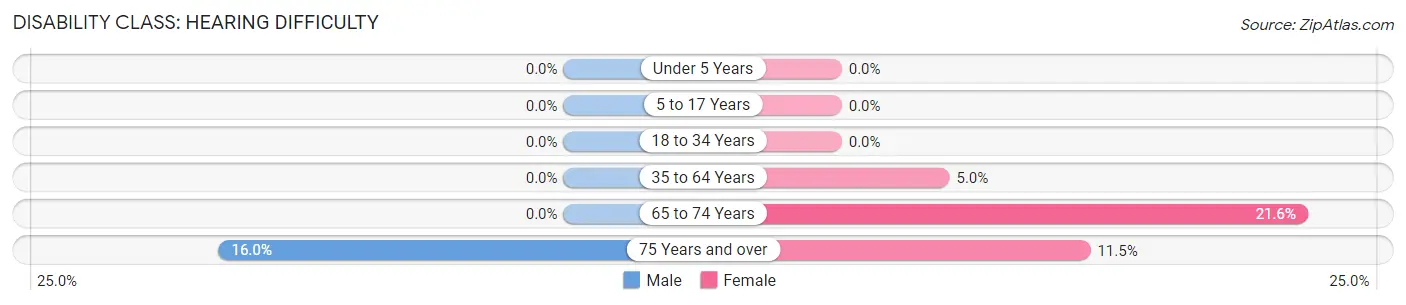
| Age Bracket | Male | Female |
| Under 5 Years | 0 (0.0%) | 0 (0.0%) |
| 5 to 17 Years | 0 (0.0%) | 0 (0.0%) |
| 18 to 34 Years | 0 (0.0%) | 0 (0.0%) |
| 35 to 64 Years | 0 (0.0%) | 3 (5.0%) |
| 65 to 74 Years | 0 (0.0%) | 8 (21.6%) |
| 75 Years and over | 4 (16.0%) | 3 (11.5%) |
Disability Class: Vision Difficulty
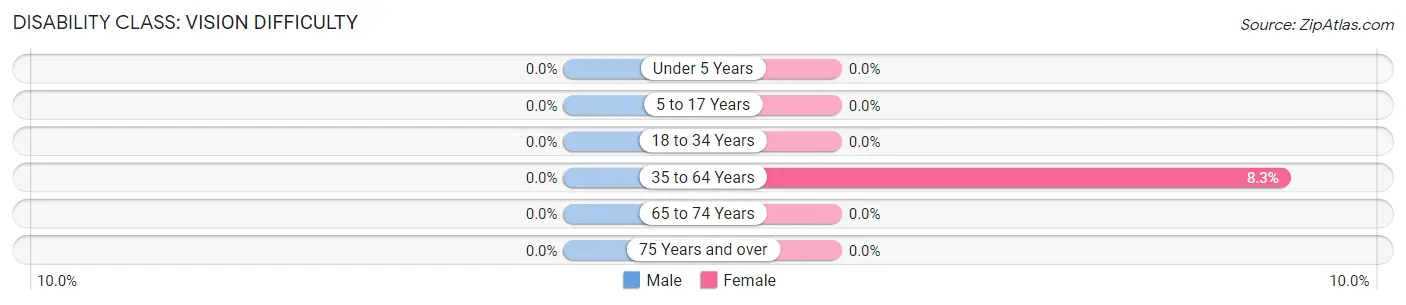
| Age Bracket | Male | Female |
| Under 5 Years | 0 (0.0%) | 0 (0.0%) |
| 5 to 17 Years | 0 (0.0%) | 0 (0.0%) |
| 18 to 34 Years | 0 (0.0%) | 0 (0.0%) |
| 35 to 64 Years | 0 (0.0%) | 5 (8.3%) |
| 65 to 74 Years | 0 (0.0%) | 0 (0.0%) |
| 75 Years and over | 0 (0.0%) | 0 (0.0%) |
Disability Class: Cognitive Difficulty
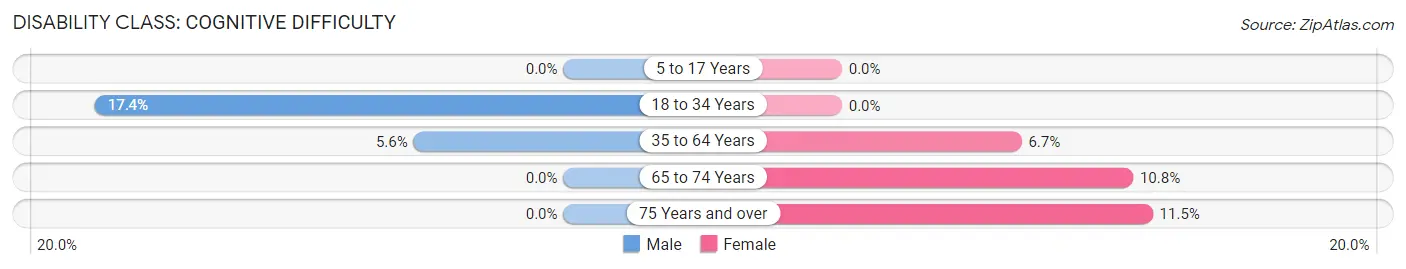
| Age Bracket | Male | Female |
| 5 to 17 Years | 0 (0.0%) | 0 (0.0%) |
| 18 to 34 Years | 4 (17.4%) | 0 (0.0%) |
| 35 to 64 Years | 5 (5.6%) | 4 (6.7%) |
| 65 to 74 Years | 0 (0.0%) | 4 (10.8%) |
| 75 Years and over | 0 (0.0%) | 3 (11.5%) |
Disability Class: Ambulatory Difficulty
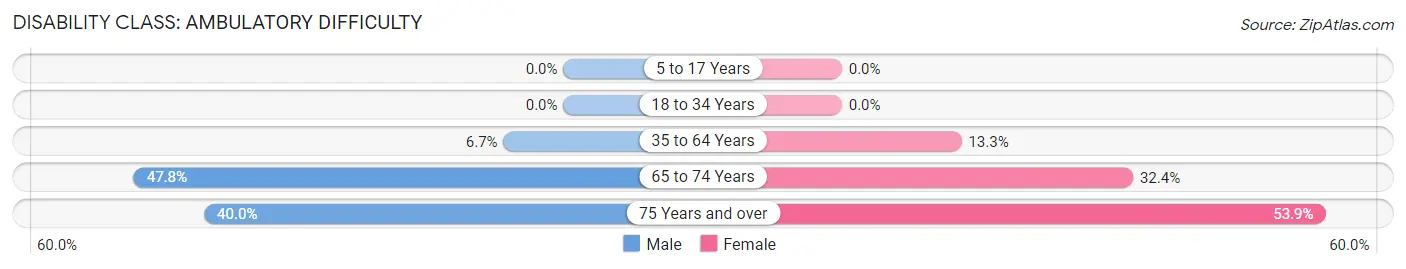
| Age Bracket | Male | Female |
| 5 to 17 Years | 0 (0.0%) | 0 (0.0%) |
| 18 to 34 Years | 0 (0.0%) | 0 (0.0%) |
| 35 to 64 Years | 6 (6.7%) | 8 (13.3%) |
| 65 to 74 Years | 11 (47.8%) | 12 (32.4%) |
| 75 Years and over | 10 (40.0%) | 14 (53.8%) |
Disability Class: Self-Care Difficulty
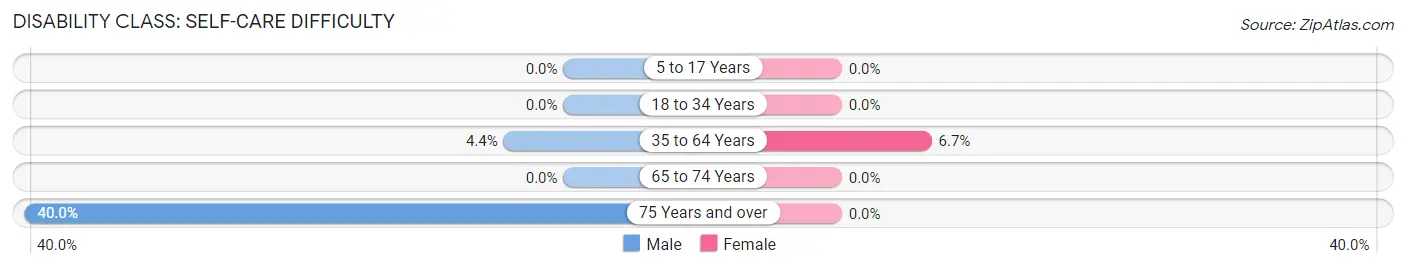
| Age Bracket | Male | Female |
| 5 to 17 Years | 0 (0.0%) | 0 (0.0%) |
| 18 to 34 Years | 0 (0.0%) | 0 (0.0%) |
| 35 to 64 Years | 4 (4.4%) | 4 (6.7%) |
| 65 to 74 Years | 0 (0.0%) | 0 (0.0%) |
| 75 Years and over | 10 (40.0%) | 0 (0.0%) |
Technology Access in Oak Grove
Computing Device Access in Oak Grove
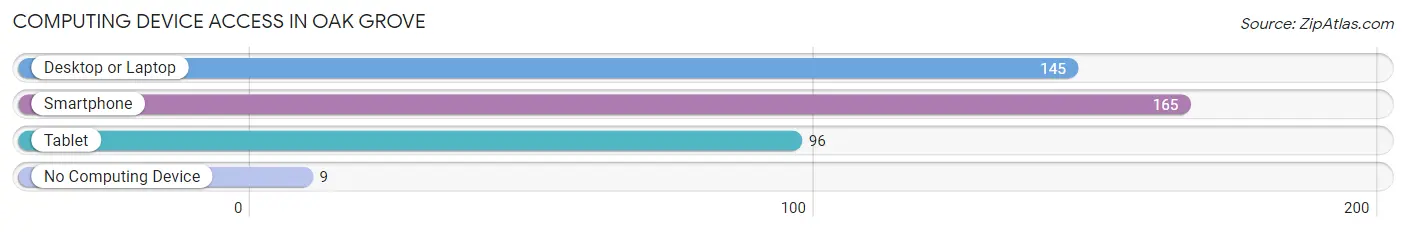
| Device Type | # Households | % Households |
| Desktop or Laptop | 145 | 72.9% |
| Smartphone | 165 | 82.9% |
| Tablet | 96 | 48.2% |
| No Computing Device | 9 | 4.5% |
| Total | 199 | 100.0% |
Internet Access in Oak Grove
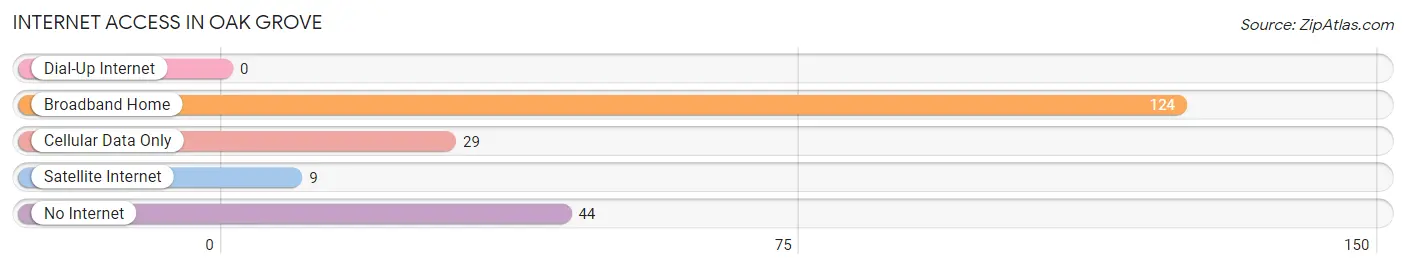
| Internet Type | # Households | % Households |
| Dial-Up Internet | 0 | 0.0% |
| Broadband Home | 124 | 62.3% |
| Cellular Data Only | 29 | 14.6% |
| Satellite Internet | 9 | 4.5% |
| No Internet | 44 | 22.1% |
| Total | 199 | 100.0% |
Oak Grove Summary
Oak Grove is a small village located in McHenry County, Illinois. It is situated in the northeastern corner of the state, about 40 miles northwest of Chicago. The village has a population of approximately 1,400 people and covers an area of 0.7 square miles.
History
Oak Grove was first settled in the early 1800s by German immigrants. The village was originally known as “Oak Grove Station” and was a stop on the Chicago and Northwestern Railroad. The village was officially incorporated in 1872.
In the late 1800s, Oak Grove was a thriving agricultural community. The village was known for its dairy farms and was home to several cheese factories. The village also had a number of small businesses, including a blacksmith, a general store, and a post office.
In the early 1900s, Oak Grove began to experience a population decline as many of its residents moved to larger cities in search of better job opportunities. The village’s population continued to decline until the 1950s, when it began to slowly increase again.
Geography
Oak Grove is located in the northeastern corner of McHenry County, Illinois. The village is situated on the banks of the Fox River and is surrounded by rolling hills and farmland. The village is located about 40 miles northwest of Chicago and is accessible via Interstate 90.
The village has a total area of 0.7 square miles, all of which is land. The village is located at an elevation of 745 feet above sea level.
Economy
Oak Grove’s economy is largely based on agriculture. The village is home to several dairy farms and is known for its cheese production. The village also has a number of small businesses, including a general store, a post office, and a few restaurants.
Demographics
As of the 2010 census, Oak Grove had a population of 1,400 people. The village has a median household income of $50,000 and a median home value of $150,000. The village is predominantly white (94.3%) and has a small Hispanic population (2.3%).
Conclusion
Oak Grove is a small village located in McHenry County, Illinois. It is situated in the northeastern corner of the state, about 40 miles northwest of Chicago. The village has a population of approximately 1,400 people and covers an area of 0.7 square miles. Oak Grove’s economy is largely based on agriculture and the village is known for its cheese production. The village is predominantly white and has a median household income of $50,000 and a median home value of $150,000.
Common Questions
What is the Total Population of Oak Grove?
Total Population of Oak Grove is 353.
What is the Total Male Population of Oak Grove?
Total Male Population of Oak Grove is 182.
What is the Total Female Population of Oak Grove?
Total Female Population of Oak Grove is 171.
What is the Ratio of Males per 100 Females in Oak Grove?
There are 106.43 Males per 100 Females in Oak Grove.
What is the Ratio of Females per 100 Males in Oak Grove?
There are 93.96 Females per 100 Males in Oak Grove.
What is the Median Population Age in Oak Grove?
Median Population Age in Oak Grove is 56.4 Years.
What is the Average Family Size in Oak Grove
Average Family Size in Oak Grove is 2.2 People.
What is the Average Household Size in Oak Grove
Average Household Size in Oak Grove is 1.8 People.
What is Per Capita Income in Oak Grove?
Per Capita income in Oak Grove is $27,182.
What is the Median Family Income in Oak Grove?
Median Family Income in Oak Grove is $42,206.
What is the Median Household income in Oak Grove?
Median Household Income in Oak Grove is $40,486.
What is Inequality or Gini Index in Oak Grove?
Inequality or Gini Index in Oak Grove is 0.37.
How Large is the Labor Force in Oak Grove?
There are 187 People in the Labor Forcein in Oak Grove.
What is the Percentage of People in the Labor Force in Oak Grove?
59.4% of People are in the Labor Force in Oak Grove.
What is the Unemployment Rate in Oak Grove?
Unemployment Rate in Oak Grove is 7.5%.