Immigrants from Bulgaria 1 or more Vehicles in Household
COMPARE
Immigrants from Bulgaria
Select to Compare
1 or more Vehicles in Household
Immigrants from Bulgaria 1 or more Vehicles in Household
89.6%
1+ VEHICLES AVAILABLE
40.7/ 100
METRIC RATING
184th/ 347
METRIC RANK
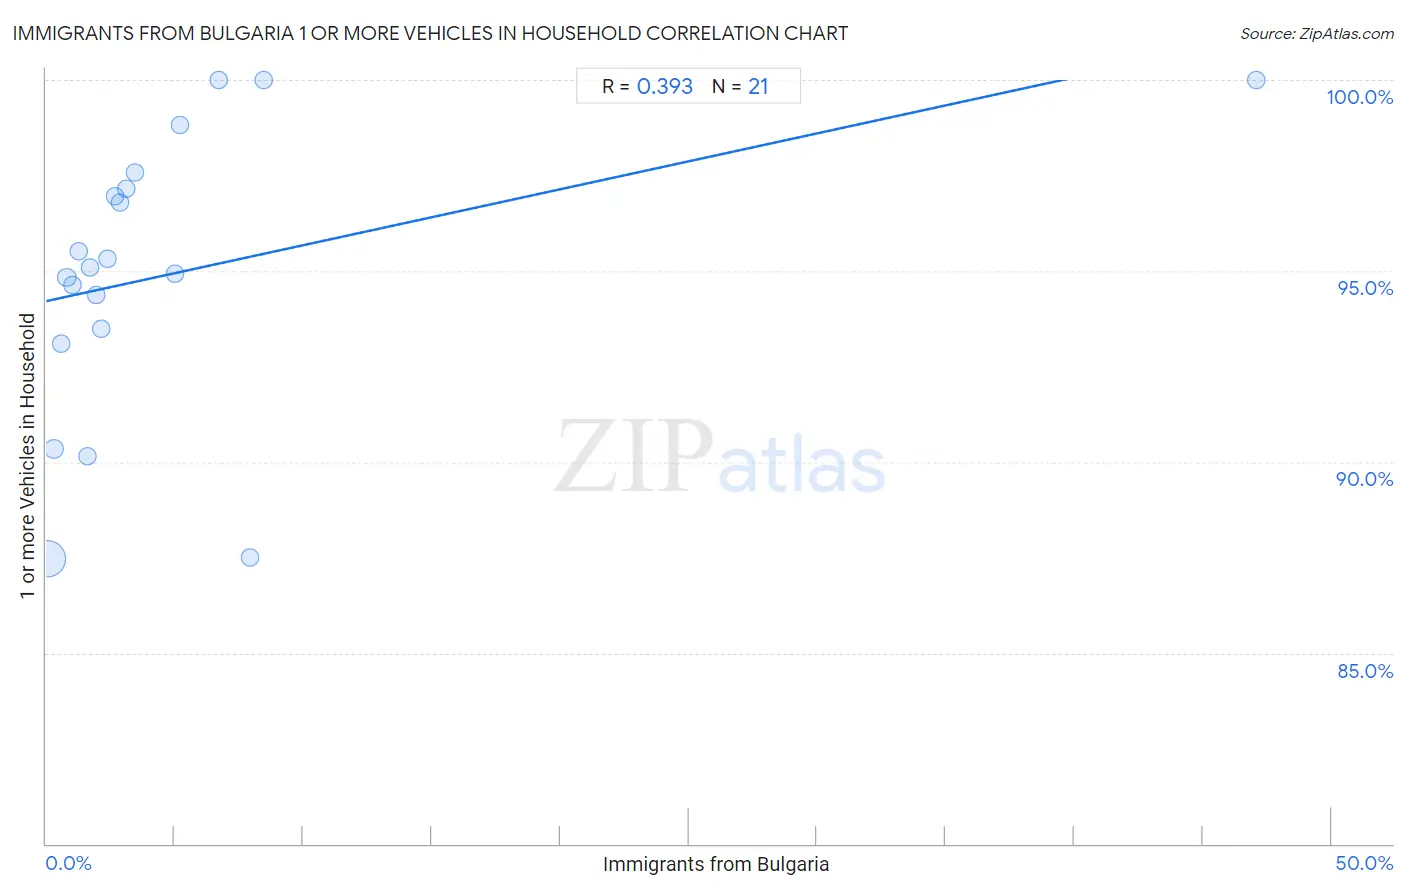
Immigrants from Bulgaria 1 or more Vehicles in Household Correlation Chart
The statistical analysis conducted on geographies consisting of 172,541,611 people shows a mild positive correlation between the proportion of Immigrants from Bulgaria and percentage of households with 1 or more vehicles available in the United States with a correlation coefficient (R) of 0.393 and weighted average of 89.6%. On average, for every 1% (one percent) increase in Immigrants from Bulgaria within a typical geography, there is an increase of 0.15% in percentage of households with 1 or more vehicles available.
It is essential to understand that the correlation between the percentage of Immigrants from Bulgaria and percentage of households with 1 or more vehicles available does not imply a direct cause-and-effect relationship. It remains uncertain whether the presence of Immigrants from Bulgaria influences an upward or downward trend in the level of percentage of households with 1 or more vehicles available within an area, or if Immigrants from Bulgaria simply ended up residing in those areas with higher or lower levels of percentage of households with 1 or more vehicles available due to other factors.
Demographics Similar to Immigrants from Bulgaria by 1 or more Vehicles in Household
In terms of 1 or more vehicles in household, the demographic groups most similar to Immigrants from Bulgaria are Ethiopian (89.6%, a difference of 0.010%), Immigrants from Brazil (89.6%, a difference of 0.010%), Pueblo (89.6%, a difference of 0.010%), South American (89.5%, a difference of 0.020%), and Immigrants from Ethiopia (89.6%, a difference of 0.030%).
| Demographics | Rating | Rank | 1 or more Vehicles in Household |
| Hmong | 45.8 /100 | #177 | Average 89.6% |
| Immigrants from El Salvador | 44.1 /100 | #178 | Average 89.6% |
| German Russians | 44.0 /100 | #179 | Average 89.6% |
| Arabs | 43.3 /100 | #180 | Average 89.6% |
| Immigrants from Ethiopia | 42.5 /100 | #181 | Average 89.6% |
| Ukrainians | 42.4 /100 | #182 | Average 89.6% |
| Ethiopians | 41.2 /100 | #183 | Average 89.6% |
| Immigrants from Bulgaria | 40.7 /100 | #184 | Average 89.6% |
| Immigrants from Brazil | 40.1 /100 | #185 | Average 89.6% |
| Pueblo | 39.9 /100 | #186 | Fair 89.6% |
| South Americans | 39.6 /100 | #187 | Fair 89.5% |
| Immigrants from Nepal | 38.9 /100 | #188 | Fair 89.5% |
| Carpatho Rusyns | 37.8 /100 | #189 | Fair 89.5% |
| Shoshone | 37.5 /100 | #190 | Fair 89.5% |
| Immigrants from Poland | 37.1 /100 | #191 | Fair 89.5% |
Immigrants from Bulgaria 1 or more Vehicles in Household Correlation Summary
| Measurement | Immigrants from Bulgaria Data | 1 or more Vehicles in Household Data |
| Minimum | 0.050% | 87.4% |
| Maximum | 47.1% | 100.0% |
| Range | 47.0% | 12.6% |
| Mean | 5.1% | 95.0% |
| Median | 2.4% | 95.1% |
| Interquartile 25% (IQ1) | 1.1% | 93.3% |
| Interquartile 75% (IQ3) | 5.1% | 97.4% |
| Interquartile Range (IQR) | 4.0% | 4.1% |
| Standard Deviation (Sample) | 9.9% | 3.7% |
| Standard Deviation (Population) | 9.7% | 3.6% |
Correlation Details
| Immigrants from Bulgaria Percentile | Sample Size | 1 or more Vehicles in Household |
[ 0.0% - 0.5% ] 0.050% | 161,429,455 | 87.4% |
[ 0.0% - 0.5% ] 0.32% | 7,168,099 | 90.3% |
[ 0.5% - 1.0% ] 0.56% | 1,949,447 | 93.1% |
[ 0.5% - 1.0% ] 0.80% | 843,860 | 94.8% |
[ 1.0% - 1.5% ] 1.03% | 443,079 | 94.6% |
[ 1.0% - 1.5% ] 1.26% | 295,250 | 95.5% |
[ 1.5% - 2.0% ] 1.59% | 163,623 | 90.2% |
[ 1.5% - 2.0% ] 1.70% | 97,183 | 95.1% |
[ 1.5% - 2.0% ] 1.97% | 6,608 | 94.4% |
[ 2.0% - 2.5% ] 2.16% | 41,662 | 93.5% |
[ 2.0% - 2.5% ] 2.38% | 71,461 | 95.3% |
[ 2.5% - 3.0% ] 2.70% | 7,854 | 96.9% |
[ 2.5% - 3.0% ] 2.85% | 4,354 | 96.8% |
[ 3.0% - 3.5% ] 3.13% | 3,294 | 97.2% |
[ 3.0% - 3.5% ] 3.46% | 9,960 | 97.6% |
[ 4.5% - 5.0% ] 5.00% | 2,160 | 94.9% |
[ 5.0% - 5.5% ] 5.23% | 3,042 | 98.8% |
[ 6.5% - 7.0% ] 6.70% | 224 | 100.0% |
[ 7.5% - 8.0% ] 7.93% | 656 | 87.5% |
[ 8.0% - 8.5% ] 8.46% | 272 | 100.0% |
[ 47.0% - 47.5% ] 47.06% | 68 | 100.0% |