Annetta South, TX
Annetta South Map
Annetta South Overview
780
TOTAL POPULATION
417
MALE POPULATION
363
FEMALE POPULATION
114.88
MALES / 100 FEMALES
87.05
FEMALES / 100 MALES
39.3
MEDIAN AGE
3.5
AVG FAMILY SIZE
3.1
AVG HOUSEHOLD SIZE
$54,112
PER CAPITA INCOME
$148,750
AVG FAMILY INCOME
$131,667
AVG HOUSEHOLD INCOME
32.5%
WAGE / INCOME GAP [ % ]
67.5¢/ $1
WAGE / INCOME GAP [ $ ]
0.33
INEQUALITY / GINI INDEX
390
LABOR FORCE [ PEOPLE ]
64.4%
PERCENT IN LABOR FORCE
3.1%
UNEMPLOYMENT RATE
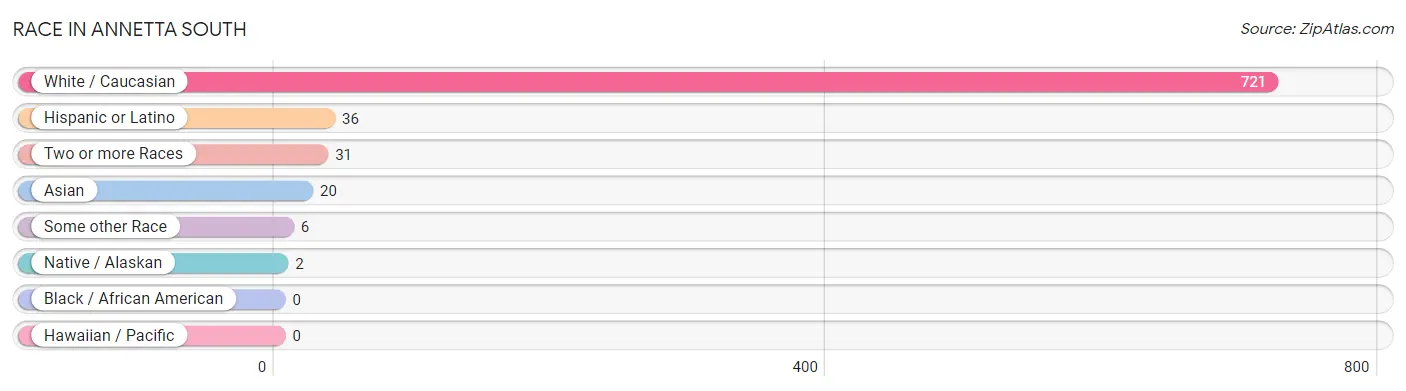
Race in Annetta South
The most populous races in Annetta South are White / Caucasian (721 | 92.4%), Hispanic or Latino (36 | 4.6%), and Two or more Races (31 | 4.0%).
| Race | # Population | % Population |
| Asian | 20 | 2.6% |
| Black / African American | 0 | 0.0% |
| Hawaiian / Pacific | 0 | 0.0% |
| Hispanic or Latino | 36 | 4.6% |
| Native / Alaskan | 2 | 0.3% |
| White / Caucasian | 721 | 92.4% |
| Two or more Races | 31 | 4.0% |
| Some other Race | 6 | 0.8% |
| Total | 780 | 100.0% |
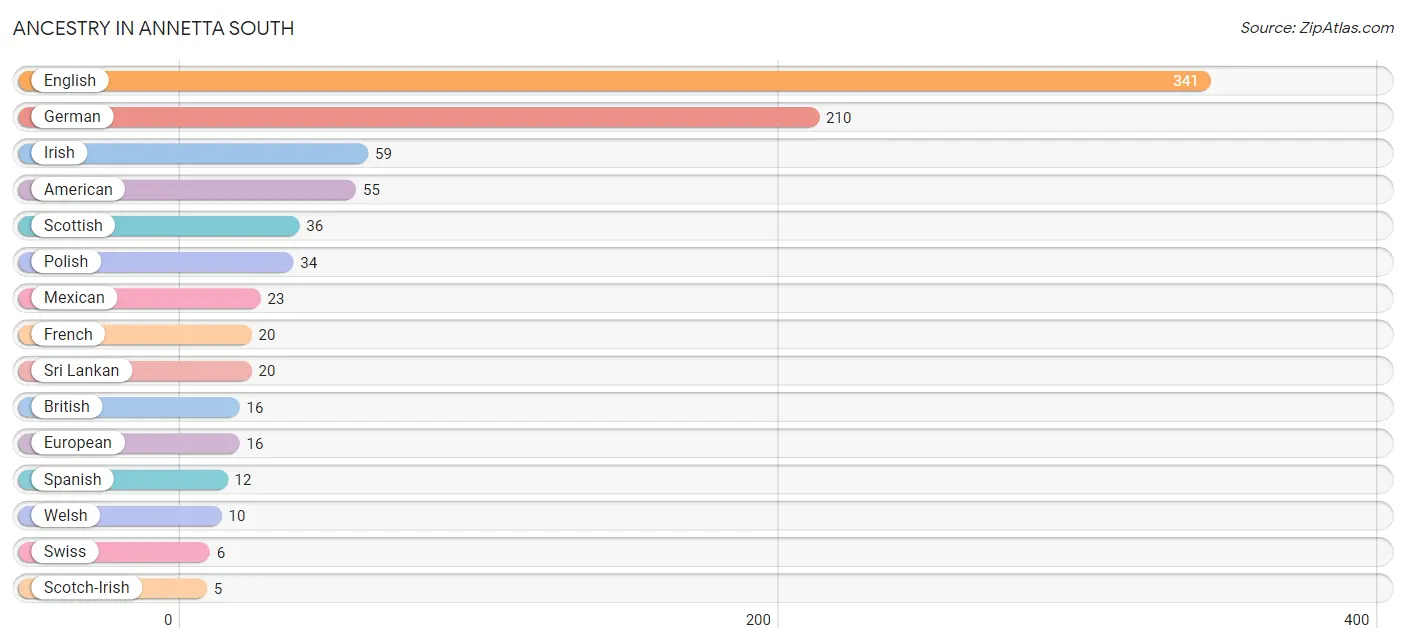
Ancestry in Annetta South
The most populous ancestries reported in Annetta South are English (341 | 43.7%), German (210 | 26.9%), Irish (59 | 7.6%), American (55 | 7.0%), and Scottish (36 | 4.6%), together accounting for 89.9% of all Annetta South residents.
| Ancestry | # Population | % Population |
| American | 55 | 7.0% |
| Arab | 2 | 0.3% |
| Armenian | 3 | 0.4% |
| British | 16 | 2.1% |
| Cherokee | 4 | 0.5% |
| Choctaw | 1 | 0.1% |
| Czechoslovakian | 3 | 0.4% |
| Danish | 1 | 0.1% |
| Dutch | 2 | 0.3% |
| Eastern European | 1 | 0.1% |
| English | 341 | 43.7% |
| European | 16 | 2.1% |
| French | 20 | 2.6% |
| German | 210 | 26.9% |
| Irish | 59 | 7.6% |
| Lebanese | 2 | 0.3% |
| Mexican | 23 | 2.9% |
| Polish | 34 | 4.4% |
| Scotch-Irish | 5 | 0.6% |
| Scottish | 36 | 4.6% |
| Spaniard | 1 | 0.1% |
| Spanish | 12 | 1.5% |
| Sri Lankan | 20 | 2.6% |
| Swedish | 2 | 0.3% |
| Swiss | 6 | 0.8% |
| Welsh | 10 | 1.3% | View All 26 Rows |
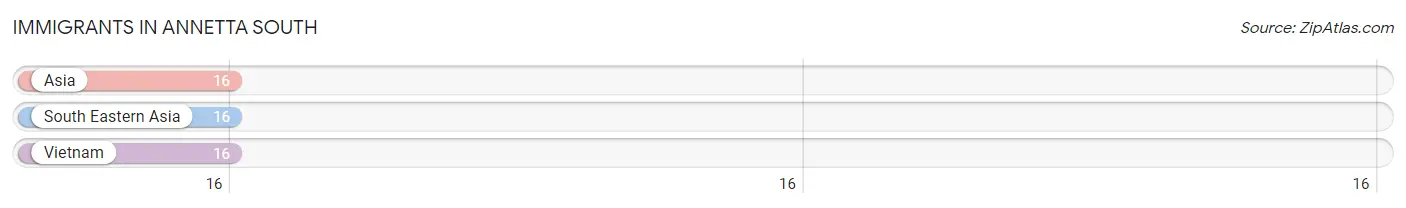
Immigrants in Annetta South
The most numerous immigrant groups reported in Annetta South came from Asia (16 | 2.1%), South Eastern Asia (16 | 2.1%), and Vietnam (16 | 2.1%), together accounting for 6.1% of all Annetta South residents.
| Immigration Origin | # Population | % Population |
| Asia | 16 | 2.1% |
| South Eastern Asia | 16 | 2.1% |
| Vietnam | 16 | 2.1% | View All 3 Rows |
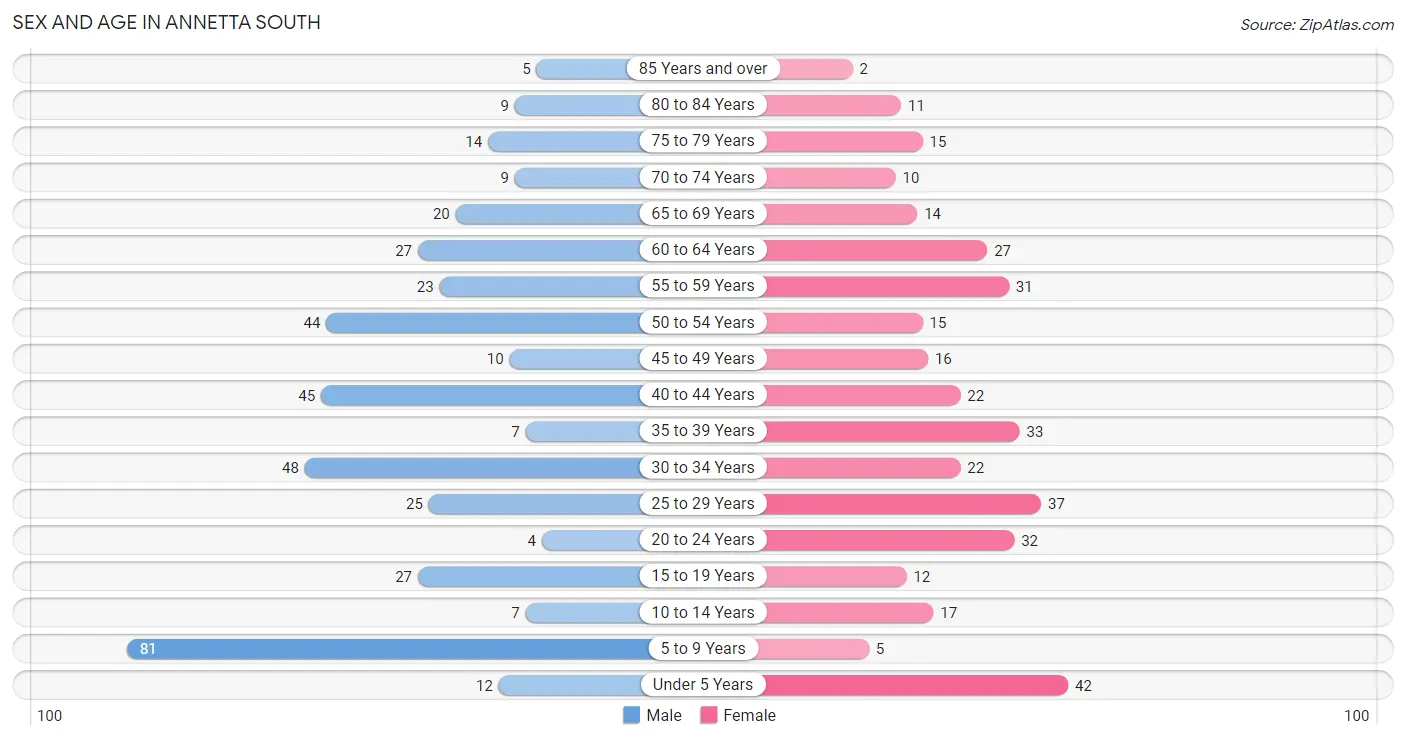
Sex and Age in Annetta South
Sex and Age in Annetta South
The most populous age groups in Annetta South are 5 to 9 Years (81 | 19.4%) for men and Under 5 Years (42 | 11.6%) for women.
| Age Bracket | Male | Female |
| Under 5 Years | 12 (2.9%) | 42 (11.6%) |
| 5 to 9 Years | 81 (19.4%) | 5 (1.4%) |
| 10 to 14 Years | 7 (1.7%) | 17 (4.7%) |
| 15 to 19 Years | 27 (6.5%) | 12 (3.3%) |
| 20 to 24 Years | 4 (1.0%) | 32 (8.8%) |
| 25 to 29 Years | 25 (6.0%) | 37 (10.2%) |
| 30 to 34 Years | 48 (11.5%) | 22 (6.1%) |
| 35 to 39 Years | 7 (1.7%) | 33 (9.1%) |
| 40 to 44 Years | 45 (10.8%) | 22 (6.1%) |
| 45 to 49 Years | 10 (2.4%) | 16 (4.4%) |
| 50 to 54 Years | 44 (10.5%) | 15 (4.1%) |
| 55 to 59 Years | 23 (5.5%) | 31 (8.5%) |
| 60 to 64 Years | 27 (6.5%) | 27 (7.4%) |
| 65 to 69 Years | 20 (4.8%) | 14 (3.9%) |
| 70 to 74 Years | 9 (2.2%) | 10 (2.8%) |
| 75 to 79 Years | 14 (3.4%) | 15 (4.1%) |
| 80 to 84 Years | 9 (2.2%) | 11 (3.0%) |
| 85 Years and over | 5 (1.2%) | 2 (0.5%) |
| Total | 417 (100.0%) | 363 (100.0%) |
Families and Households in Annetta South
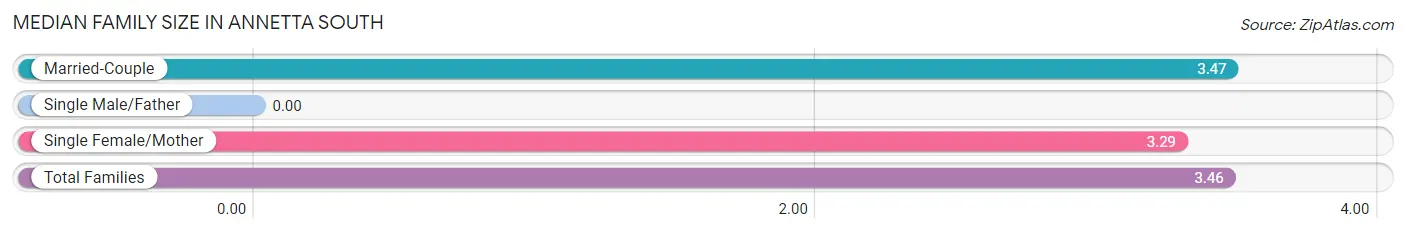
Median Family Size in Annetta South
| Family Type | # Families | Family Size |
| Married-Couple | 203 (96.7%) | 3.47 |
| Single Male/Father | 0 (0.0%) | - |
| Single Female/Mother | 7 (3.3%) | 3.29 |
| Total Families | 210 (100.0%) | 3.46 |
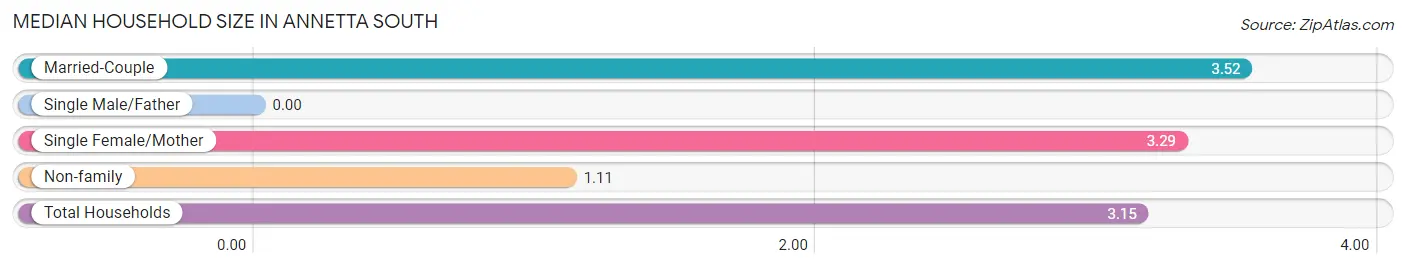
Median Household Size in Annetta South
| Household Type | # Households | Household Size |
| Married-Couple | 203 (81.9%) | 3.52 |
| Single Male/Father | 0 (0.0%) | - |
| Single Female/Mother | 7 (2.8%) | 3.29 |
| Non-family | 38 (15.3%) | 1.11 |
| Total Households | 248 (100.0%) | 3.15 |
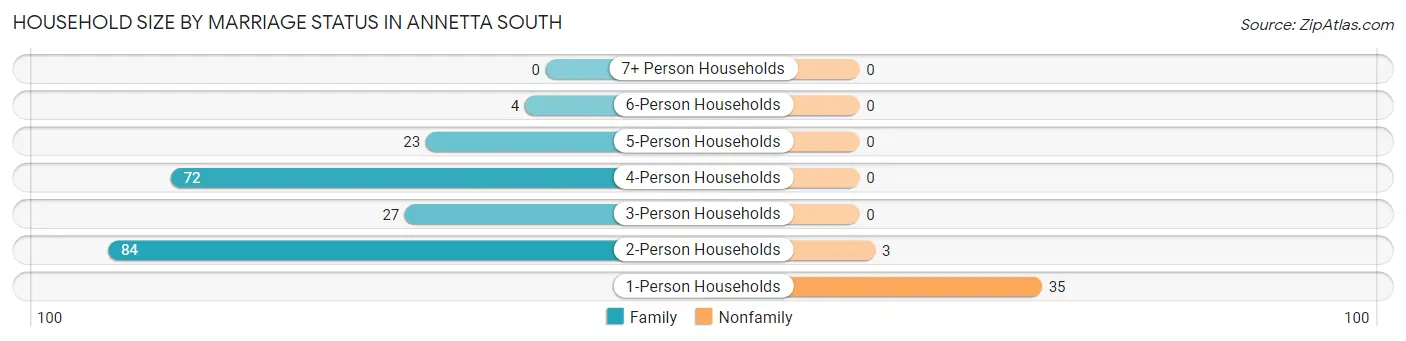
Household Size by Marriage Status in Annetta South
Out of a total of 248 households in Annetta South, 210 (84.7%) are family households, while 38 (15.3%) are nonfamily households. The most numerous type of family households are 2-person households, comprising 84, and the most common type of nonfamily households are 1-person households, comprising 35.
| Household Size | Family Households | Nonfamily Households |
| 1-Person Households | - | 35 (14.1%) |
| 2-Person Households | 84 (33.9%) | 3 (1.2%) |
| 3-Person Households | 27 (10.9%) | 0 (0.0%) |
| 4-Person Households | 72 (29.0%) | 0 (0.0%) |
| 5-Person Households | 23 (9.3%) | 0 (0.0%) |
| 6-Person Households | 4 (1.6%) | 0 (0.0%) |
| 7+ Person Households | 0 (0.0%) | 0 (0.0%) |
| Total | 210 (84.7%) | 38 (15.3%) |
Female Fertility in Annetta South
Fertility by Age in Annetta South
Average fertility rate in Annetta South is 170.0 births per 1,000 women. Women in the age bracket of 20 to 34 years have the highest fertility rate with 341.0 births per 1,000 women. Women in the age bracket of 20 to 34 years acount for 100.0% of all women with births.
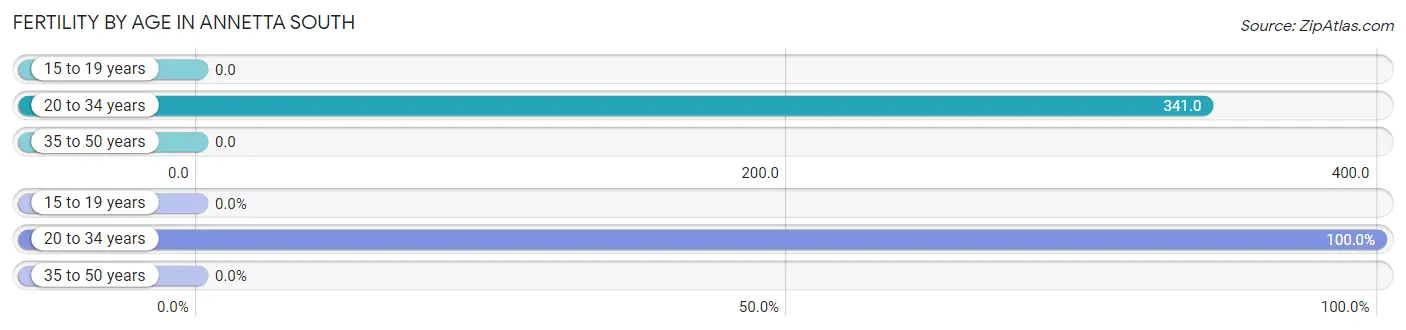
| Age Bracket | Women with Births | Births / 1,000 Women |
| 15 to 19 years | 0 (0.0%) | 0.0 |
| 20 to 34 years | 31 (100.0%) | 341.0 |
| 35 to 50 years | 0 (0.0%) | 0.0 |
| Total | 31 (100.0%) | 170.0 |
Fertility by Age by Marriage Status in Annetta South
67.7% of women with births (31) in Annetta South are married. The highest percentage of unmarried women with births falls into 20 to 34 years age bracket with 32.3% of them unmarried at the time of birth, while the lowest percentage of unmarried women with births belong to 20 to 34 years age bracket with 32.3% of them unmarried.
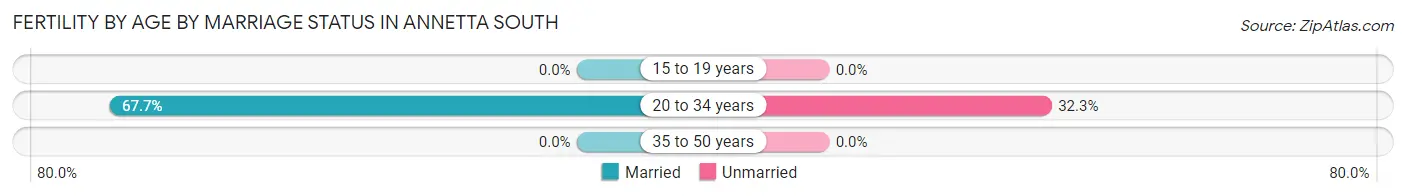
| Age Bracket | Married | Unmarried |
| 15 to 19 years | 0 (0.0%) | 0 (0.0%) |
| 20 to 34 years | 21 (67.7%) | 10 (32.3%) |
| 35 to 50 years | 0 (0.0%) | 0 (0.0%) |
| Total | 21 (67.7%) | 10 (32.3%) |
Fertility by Education in Annetta South
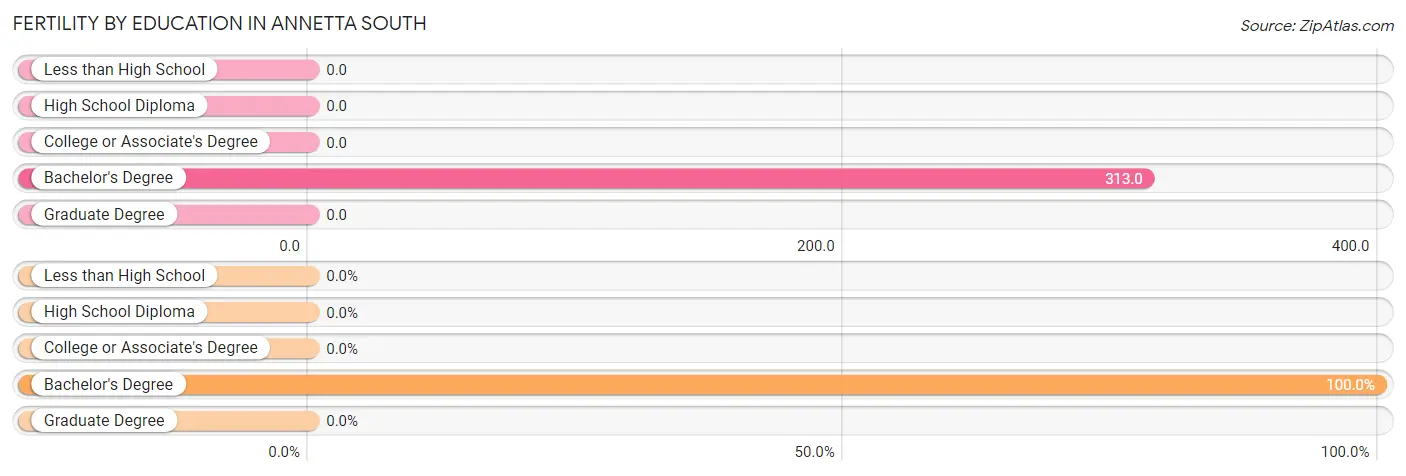
| Educational Attainment | Women with Births | Births / 1,000 Women |
| Less than High School | 0 (0.0%) | 0.0 |
| High School Diploma | 0 (0.0%) | 0.0 |
| College or Associate's Degree | 0 (0.0%) | 0.0 |
| Bachelor's Degree | 31 (100.0%) | 313.0 |
| Graduate Degree | 0 (0.0%) | 0.0 |
| Total | 31 (100.0%) | 170.0 |
Fertility by Education by Marriage Status in Annetta South
32.3% of women with births in Annetta South are unmarried. Women with the educational attainment of bachelor's degree are most likely to be married with 67.7% of them married at childbirth, while women with the educational attainment of bachelor's degree are least likely to be married with 32.3% of them unmarried at childbirth.
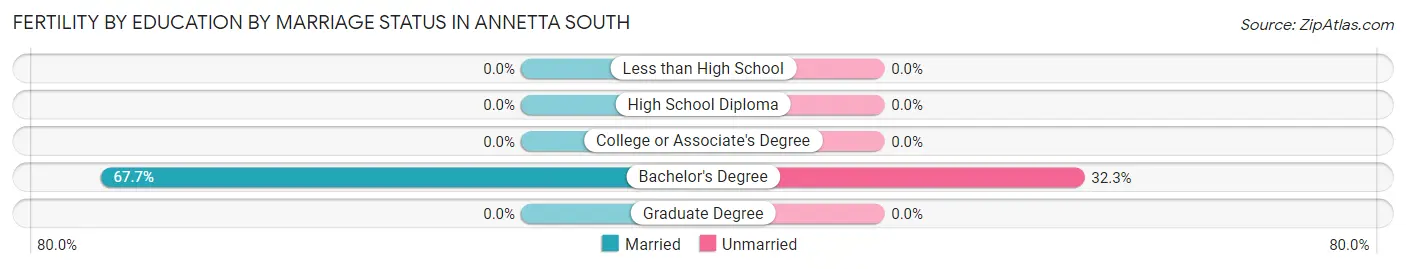
| Educational Attainment | Married | Unmarried |
| Less than High School | 0 (0.0%) | 0 (0.0%) |
| High School Diploma | 0 (0.0%) | 0 (0.0%) |
| College or Associate's Degree | 0 (0.0%) | 0 (0.0%) |
| Bachelor's Degree | 21 (67.7%) | 10 (32.3%) |
| Graduate Degree | 0 (0.0%) | 0 (0.0%) |
| Total | 21 (67.7%) | 10 (32.3%) |
Income in Annetta South
Income Overview in Annetta South
Per Capita Income in Annetta South is $54,112, while median incomes of families and households are $148,750 and $131,667 respectively.
| Characteristic | Number | Measure |
| Per Capita Income | 780 | $54,112 |
| Median Family Income | 210 | $148,750 |
| Mean Family Income | 210 | $176,096 |
| Median Household Income | 248 | $131,667 |
| Mean Household Income | 248 | $160,482 |
| Income Deficit | 210 | $0 |
| Wage / Income Gap (%) | 780 | 32.55% |
| Wage / Income Gap ($) | 780 | 67.45¢ per $1 |
| Gini / Inequality Index | 780 | 0.33 |
Earnings by Sex in Annetta South
Average Earnings in Annetta South are $54,432, $75,139 for men and $50,682 for women, a difference of 32.6%.
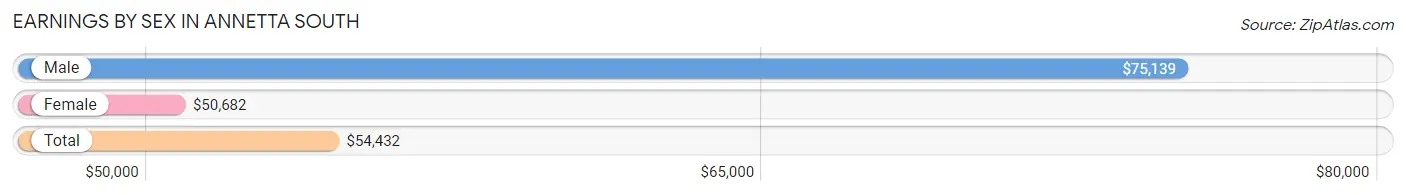
| Sex | Number | Average Earnings |
| Male | 239 (59.3%) | $75,139 |
| Female | 164 (40.7%) | $50,682 |
| Total | 403 (100.0%) | $54,432 |
Earnings by Sex by Income Bracket in Annetta South
The most common earnings brackets in Annetta South are $100,000+ for men (98 | 41.0%) and $50,000 to $54,999 for women (28 | 17.1%).
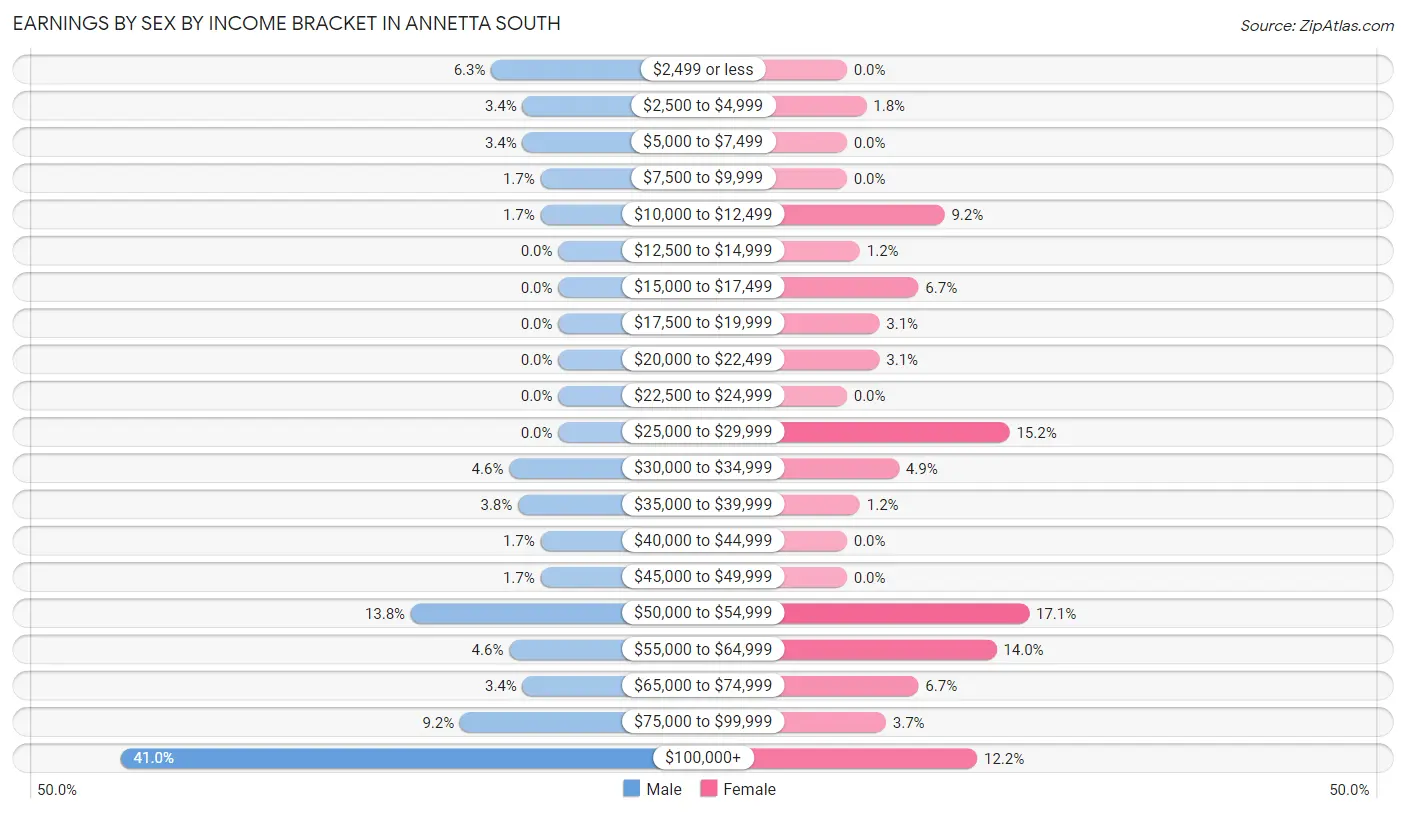
| Income | Male | Female |
| $2,499 or less | 15 (6.3%) | 0 (0.0%) |
| $2,500 to $4,999 | 8 (3.4%) | 3 (1.8%) |
| $5,000 to $7,499 | 8 (3.4%) | 0 (0.0%) |
| $7,500 to $9,999 | 4 (1.7%) | 0 (0.0%) |
| $10,000 to $12,499 | 4 (1.7%) | 15 (9.1%) |
| $12,500 to $14,999 | 0 (0.0%) | 2 (1.2%) |
| $15,000 to $17,499 | 0 (0.0%) | 11 (6.7%) |
| $17,500 to $19,999 | 0 (0.0%) | 5 (3.0%) |
| $20,000 to $22,499 | 0 (0.0%) | 5 (3.0%) |
| $22,500 to $24,999 | 0 (0.0%) | 0 (0.0%) |
| $25,000 to $29,999 | 0 (0.0%) | 25 (15.2%) |
| $30,000 to $34,999 | 11 (4.6%) | 8 (4.9%) |
| $35,000 to $39,999 | 9 (3.8%) | 2 (1.2%) |
| $40,000 to $44,999 | 4 (1.7%) | 0 (0.0%) |
| $45,000 to $49,999 | 4 (1.7%) | 0 (0.0%) |
| $50,000 to $54,999 | 33 (13.8%) | 28 (17.1%) |
| $55,000 to $64,999 | 11 (4.6%) | 23 (14.0%) |
| $65,000 to $74,999 | 8 (3.4%) | 11 (6.7%) |
| $75,000 to $99,999 | 22 (9.2%) | 6 (3.7%) |
| $100,000+ | 98 (41.0%) | 20 (12.2%) |
| Total | 239 (100.0%) | 164 (100.0%) |
Earnings by Sex by Educational Attainment in Annetta South
Average earnings in Annetta South are $80,000 for men and $51,420 for women, a difference of 35.7%. Men with an educational attainment of bachelor's degree enjoy the highest average annual earnings of $184,750, while those with college or associate's degree education earn the least with $51,394. Women with an educational attainment of bachelor's degree earn the most with the average annual earnings of $51,591, while those with bachelor's degree education have the smallest earnings of $51,591.
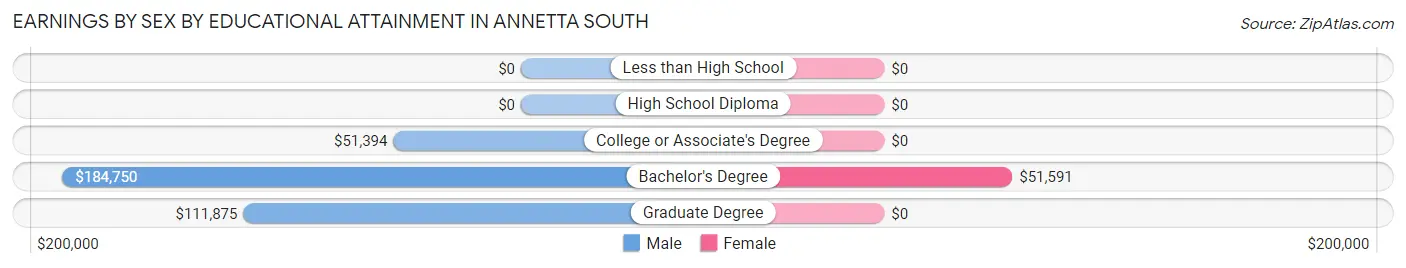
| Educational Attainment | Male Income | Female Income |
| Less than High School | - | - |
| High School Diploma | - | - |
| College or Associate's Degree | $51,394 | $0 |
| Bachelor's Degree | $184,750 | $51,591 |
| Graduate Degree | $111,875 | $0 |
| Total | $80,000 | $51,420 |
Family Income in Annetta South
Family Income Brackets in Annetta South
According to the Annetta South family income data, there are 84 families falling into the $200,000+ income range, which is the most common income bracket and makes up 40.0% of all families.
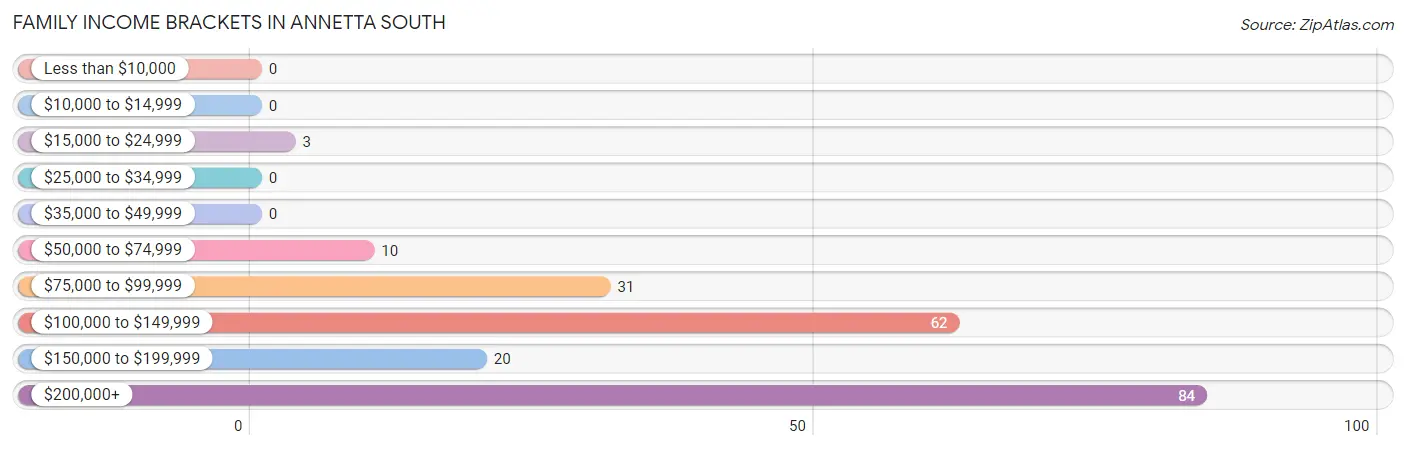
| Income Bracket | # Families | % Families |
| Less than $10,000 | 0 | 0.0% |
| $10,000 to $14,999 | 0 | 0.0% |
| $15,000 to $24,999 | 3 | 1.4% |
| $25,000 to $34,999 | 0 | 0.0% |
| $35,000 to $49,999 | 0 | 0.0% |
| $50,000 to $74,999 | 10 | 4.8% |
| $75,000 to $99,999 | 31 | 14.8% |
| $100,000 to $149,999 | 62 | 29.5% |
| $150,000 to $199,999 | 20 | 9.5% |
| $200,000+ | 84 | 40.0% |
Family Income by Famaliy Size in Annetta South
5-person families (17 | 8.1%) account for the highest median family income in Annetta South with $250,001 per family, while 3-person families (35 | 16.7%) have the highest median income of $65,990 per family member.
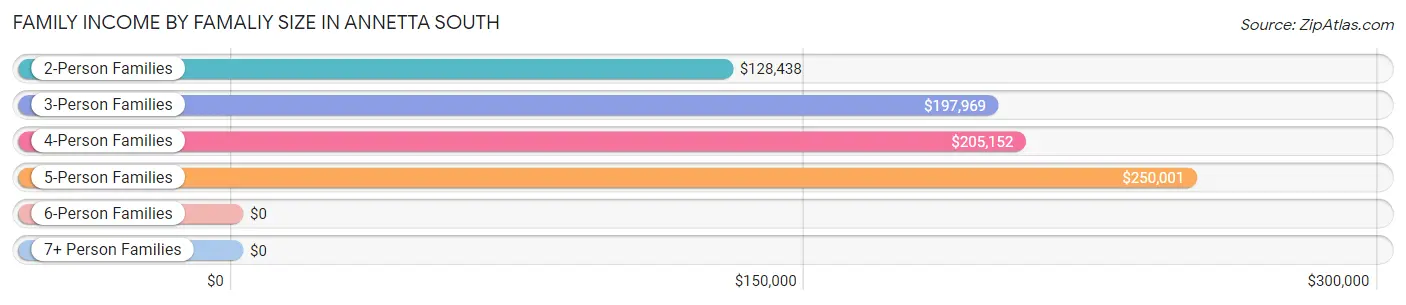
| Income Bracket | # Families | Median Income |
| 2-Person Families | 84 (40.0%) | $128,438 |
| 3-Person Families | 35 (16.7%) | $197,969 |
| 4-Person Families | 72 (34.3%) | $205,152 |
| 5-Person Families | 17 (8.1%) | $250,001 |
| 6-Person Families | 2 (0.9%) | $0 |
| 7+ Person Families | 0 (0.0%) | $0 |
| Total | 210 (100.0%) | $148,750 |
Family Income by Number of Earners in Annetta South
The median family income in Annetta South is $148,750, with families comprising 3+ earners (34) having the highest median family income of $223,750, while families with no earners (30) have the lowest median family income of $93,750, accounting for 16.2% and 14.3% of families, respectively.
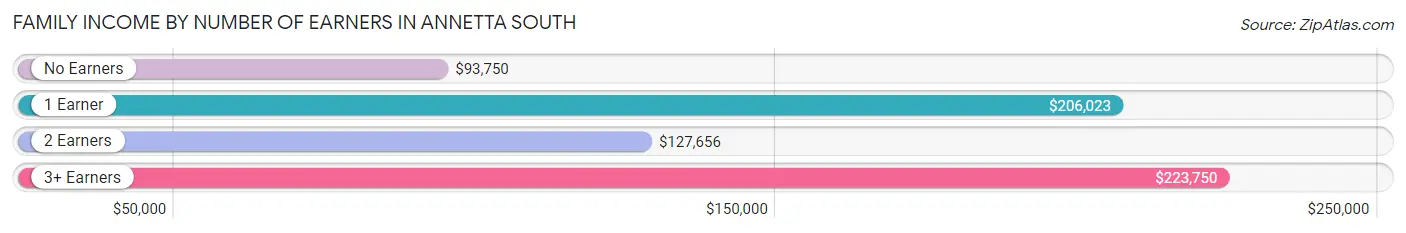
| Number of Earners | # Families | Median Income |
| No Earners | 30 (14.3%) | $93,750 |
| 1 Earner | 61 (29.0%) | $206,023 |
| 2 Earners | 85 (40.5%) | $127,656 |
| 3+ Earners | 34 (16.2%) | $223,750 |
| Total | 210 (100.0%) | $148,750 |
Household Income in Annetta South
Household Income Brackets in Annetta South
With 87 households falling in the category, the $200,000+ income range is the most frequent in Annetta South, accounting for 35.1% of all households.
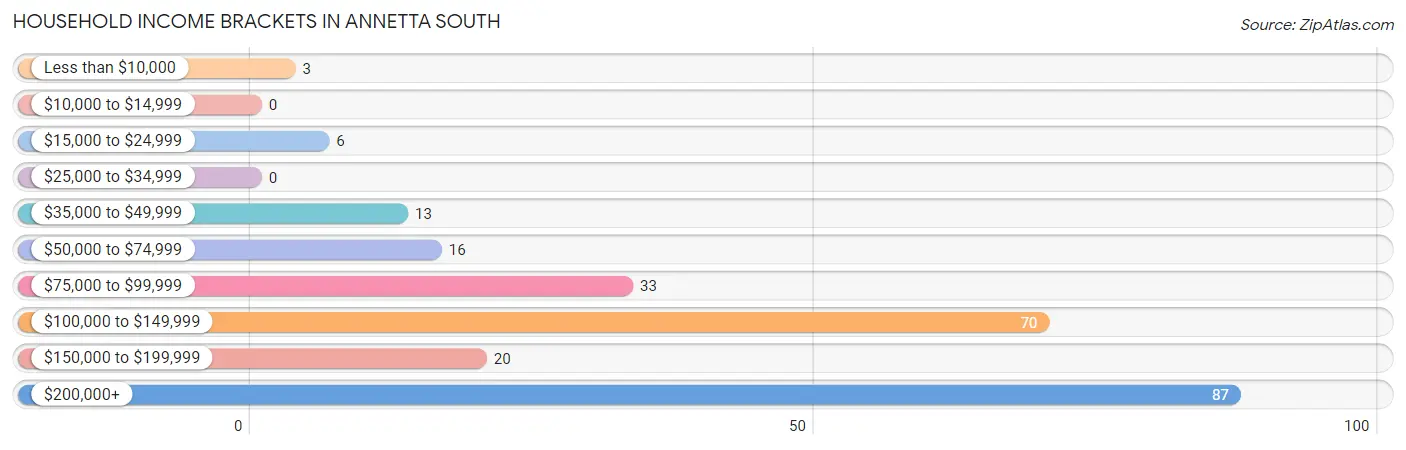
| Income Bracket | # Households | % Households |
| Less than $10,000 | 3 | 1.2% |
| $10,000 to $14,999 | 0 | 0.0% |
| $15,000 to $24,999 | 6 | 2.4% |
| $25,000 to $34,999 | 0 | 0.0% |
| $35,000 to $49,999 | 13 | 5.2% |
| $50,000 to $74,999 | 16 | 6.5% |
| $75,000 to $99,999 | 33 | 13.3% |
| $100,000 to $149,999 | 70 | 28.2% |
| $150,000 to $199,999 | 20 | 8.1% |
| $200,000+ | 87 | 35.1% |
Household Income by Householder Age in Annetta South
The median household income in Annetta South is $131,667, with the highest median household income of $205,189 found in the 25 to 44 years age bracket for the primary householder. A total of 87 households (35.1%) fall into this category.
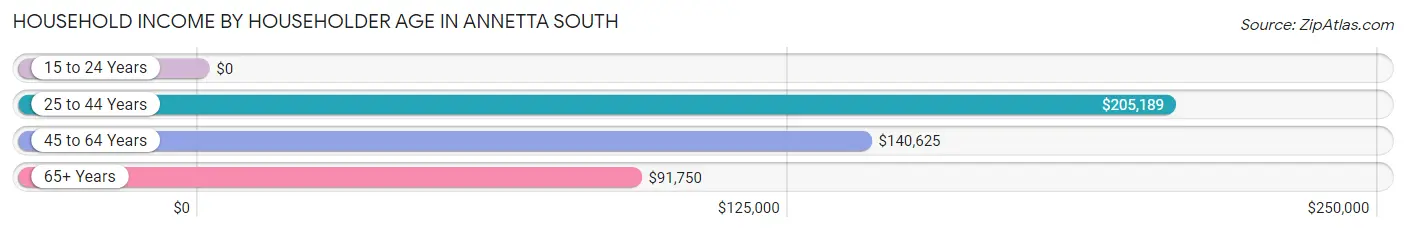
| Income Bracket | # Households | Median Income |
| 15 to 24 Years | 0 (0.0%) | $0 |
| 25 to 44 Years | 87 (35.1%) | $205,189 |
| 45 to 64 Years | 99 (39.9%) | $140,625 |
| 65+ Years | 62 (25.0%) | $91,750 |
| Total | 248 (100.0%) | $131,667 |
Poverty in Annetta South
Income Below Poverty by Sex and Age in Annetta South
With 0.7% poverty level for males and 0.8% for females among the residents of Annetta South, 55 to 64 year old males and 75 year old and over females are the most vulnerable to poverty, with 3 males (6.0%) and 3 females (10.7%) in their respective age groups living below the poverty level.
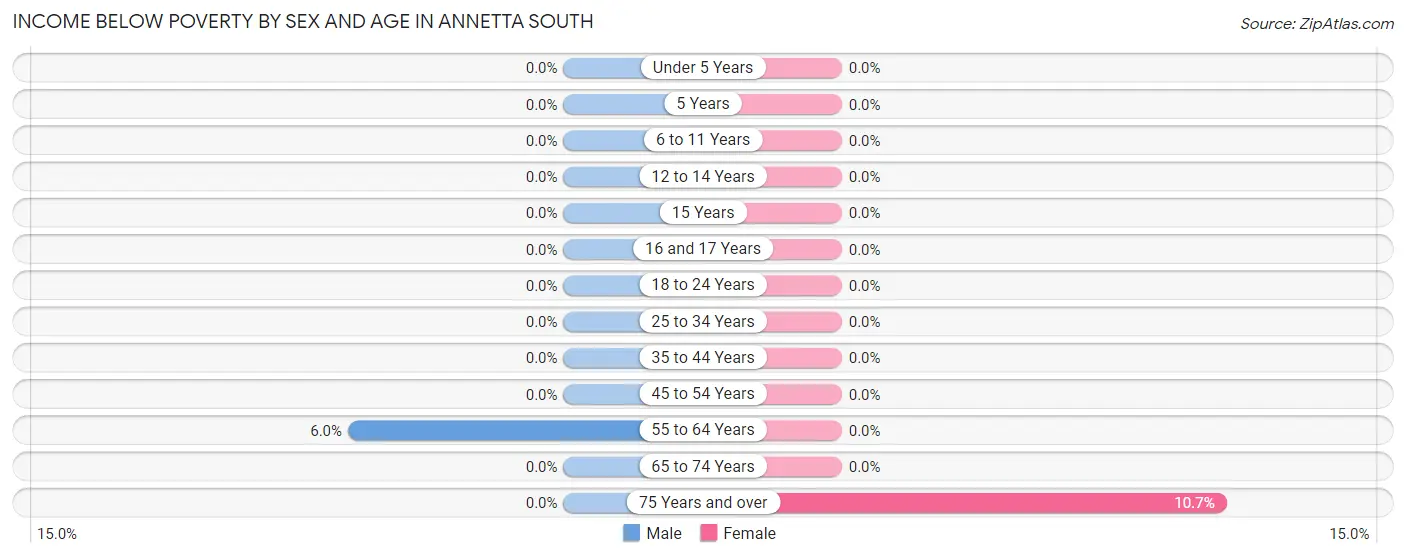
| Age Bracket | Male | Female |
| Under 5 Years | 0 (0.0%) | 0 (0.0%) |
| 5 Years | 0 (0.0%) | 0 (0.0%) |
| 6 to 11 Years | 0 (0.0%) | 0 (0.0%) |
| 12 to 14 Years | 0 (0.0%) | 0 (0.0%) |
| 15 Years | 0 (0.0%) | 0 (0.0%) |
| 16 and 17 Years | 0 (0.0%) | 0 (0.0%) |
| 18 to 24 Years | 0 (0.0%) | 0 (0.0%) |
| 25 to 34 Years | 0 (0.0%) | 0 (0.0%) |
| 35 to 44 Years | 0 (0.0%) | 0 (0.0%) |
| 45 to 54 Years | 0 (0.0%) | 0 (0.0%) |
| 55 to 64 Years | 3 (6.0%) | 0 (0.0%) |
| 65 to 74 Years | 0 (0.0%) | 0 (0.0%) |
| 75 Years and over | 0 (0.0%) | 3 (10.7%) |
| Total | 3 (0.7%) | 3 (0.8%) |
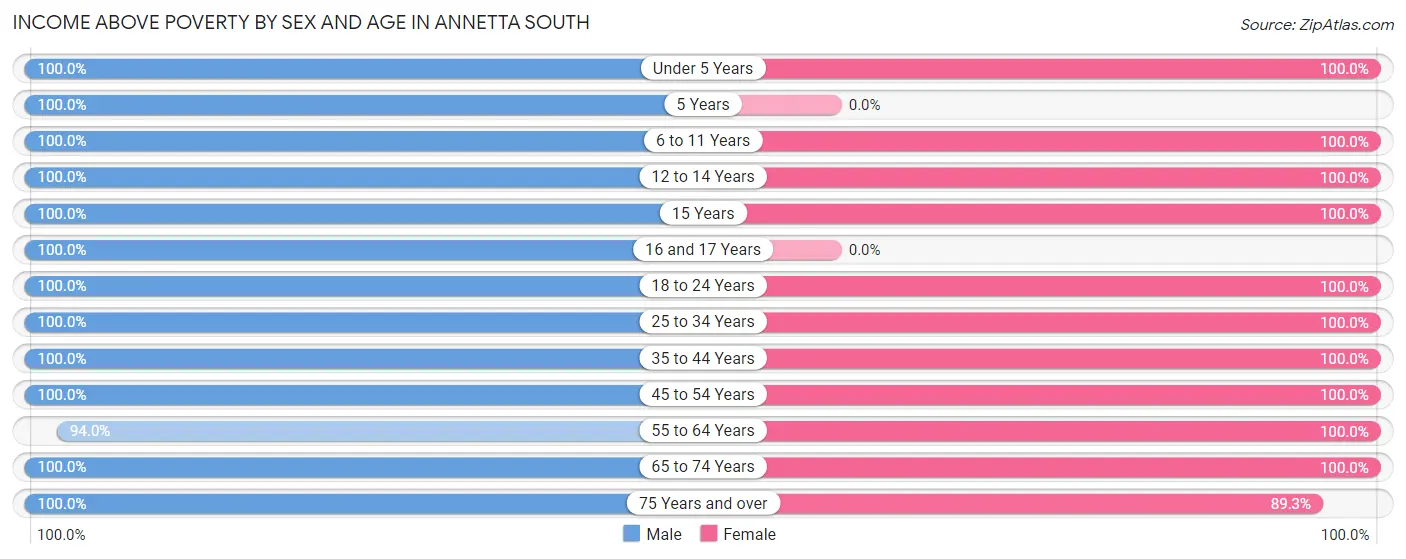
Income Above Poverty by Sex and Age in Annetta South
According to the poverty statistics in Annetta South, males aged under 5 years and females aged under 5 years are the age groups that are most secure financially, with 100.0% of males and 100.0% of females in these age groups living above the poverty line.
| Age Bracket | Male | Female |
| Under 5 Years | 5 (100.0%) | 42 (100.0%) |
| 5 Years | 2 (100.0%) | 0 (0.0%) |
| 6 to 11 Years | 81 (100.0%) | 9 (100.0%) |
| 12 to 14 Years | 5 (100.0%) | 13 (100.0%) |
| 15 Years | 6 (100.0%) | 4 (100.0%) |
| 16 and 17 Years | 16 (100.0%) | 0 (0.0%) |
| 18 to 24 Years | 9 (100.0%) | 40 (100.0%) |
| 25 to 34 Years | 73 (100.0%) | 59 (100.0%) |
| 35 to 44 Years | 52 (100.0%) | 55 (100.0%) |
| 45 to 54 Years | 54 (100.0%) | 31 (100.0%) |
| 55 to 64 Years | 47 (94.0%) | 58 (100.0%) |
| 65 to 74 Years | 29 (100.0%) | 24 (100.0%) |
| 75 Years and over | 28 (100.0%) | 25 (89.3%) |
| Total | 407 (99.3%) | 360 (99.2%) |
Income Below Poverty Among Married-Couple Families in Annetta South
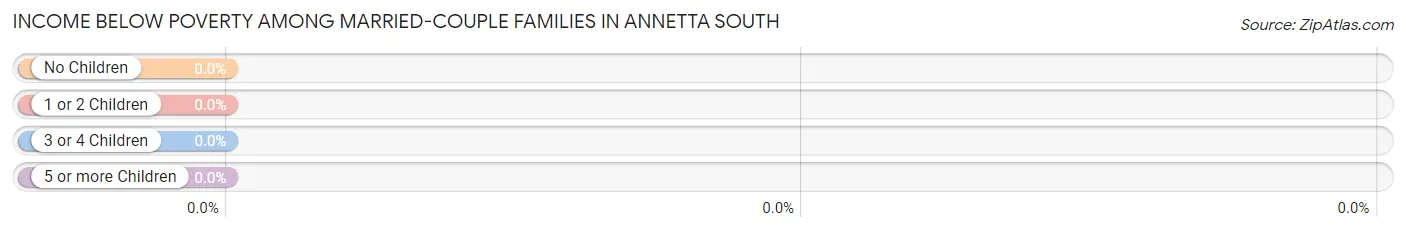
| Children | Above Poverty | Below Poverty |
| No Children | 116 (100.0%) | 0 (0.0%) |
| 1 or 2 Children | 78 (100.0%) | 0 (0.0%) |
| 3 or 4 Children | 9 (100.0%) | 0 (0.0%) |
| 5 or more Children | 0 (0.0%) | 0 (0.0%) |
| Total | 203 (100.0%) | 0 (0.0%) |
Income Below Poverty Among Single-Parent Households in Annetta South
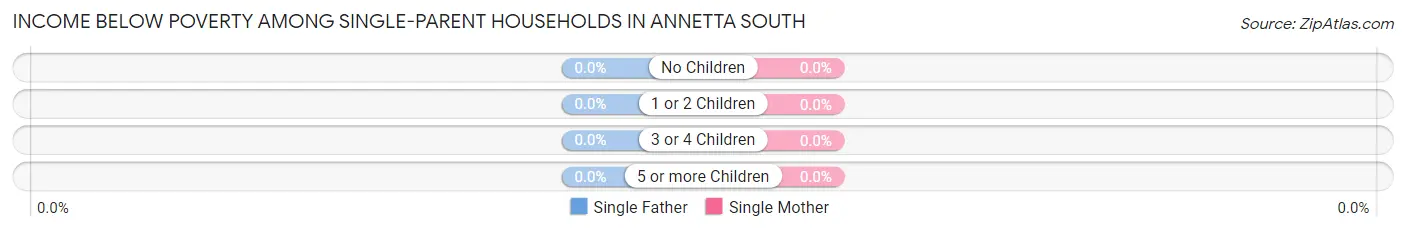
| Children | Single Father | Single Mother |
| No Children | 0 (0.0%) | 0 (0.0%) |
| 1 or 2 Children | 0 (0.0%) | 0 (0.0%) |
| 3 or 4 Children | 0 (0.0%) | 0 (0.0%) |
| 5 or more Children | 0 (0.0%) | 0 (0.0%) |
| Total | 0 (0.0%) | 0 (0.0%) |
Income Below Poverty Among Married-Couple vs Single-Parent Households in Annetta South
| Children | Married-Couple Families | Single-Parent Households |
| No Children | 0 (0.0%) | 0 (0.0%) |
| 1 or 2 Children | 0 (0.0%) | 0 (0.0%) |
| 3 or 4 Children | 0 (0.0%) | 0 (0.0%) |
| 5 or more Children | 0 (0.0%) | 0 (0.0%) |
| Total | 0 (0.0%) | 0 (0.0%) |
Employment Characteristics in Annetta South
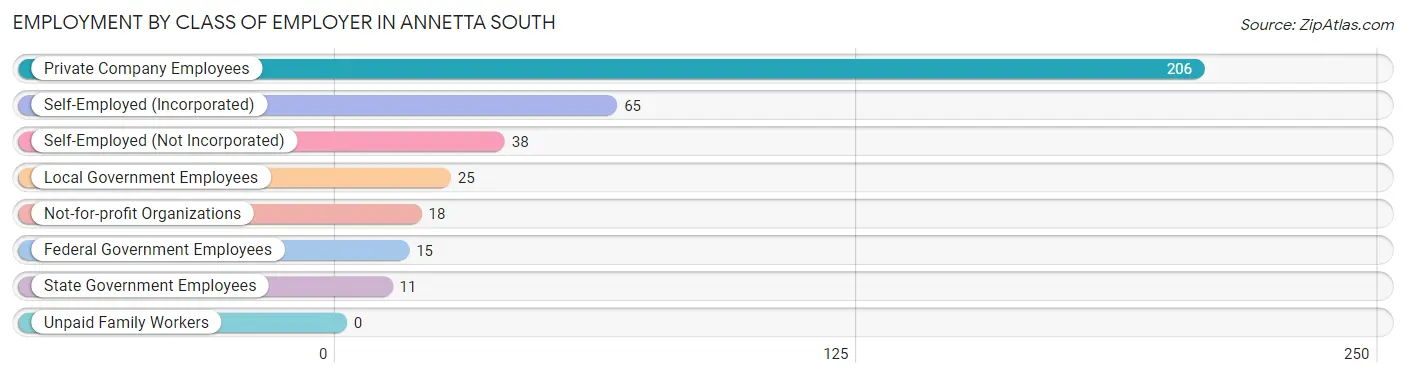
Employment by Class of Employer in Annetta South
Among the 378 employed individuals in Annetta South, private company employees (206 | 54.5%), self-employed (incorporated) (65 | 17.2%), and self-employed (not incorporated) (38 | 10.1%) make up the most common classes of employment.
| Employer Class | # Employees | % Employees |
| Private Company Employees | 206 | 54.5% |
| Self-Employed (Incorporated) | 65 | 17.2% |
| Self-Employed (Not Incorporated) | 38 | 10.1% |
| Not-for-profit Organizations | 18 | 4.8% |
| Local Government Employees | 25 | 6.6% |
| State Government Employees | 11 | 2.9% |
| Federal Government Employees | 15 | 4.0% |
| Unpaid Family Workers | 0 | 0.0% |
| Total | 378 | 100.0% |
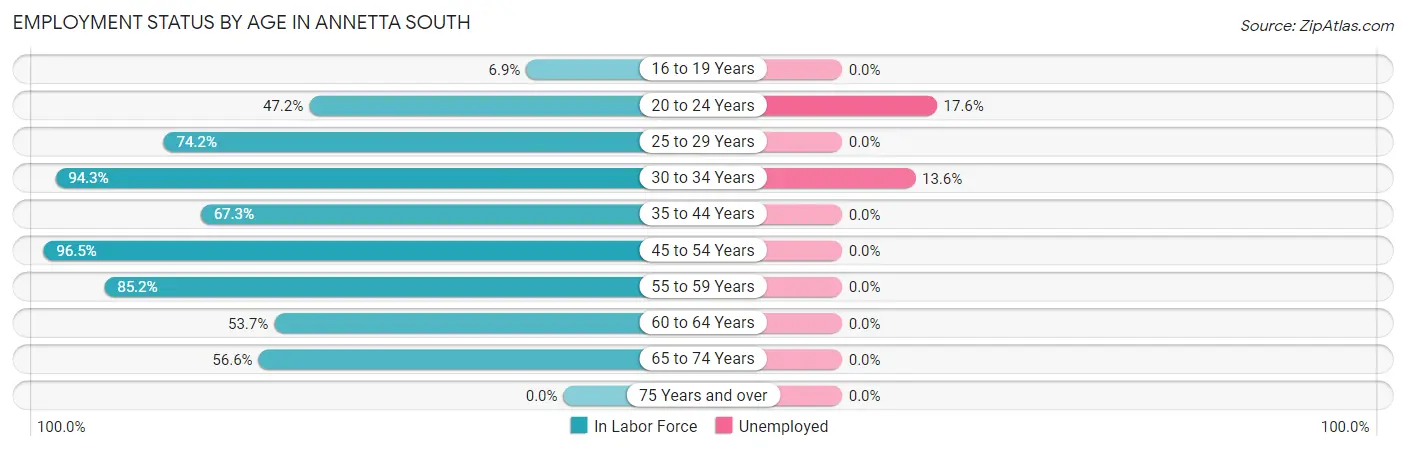
Employment Status by Age in Annetta South
According to the labor force statistics for Annetta South, out of the total population over 16 years of age (606), 64.4% or 390 individuals are in the labor force, with 3.1% or 12 of them unemployed. The age group with the highest labor force participation rate is 45 to 54 years, with 96.5% or 82 individuals in the labor force. Within the labor force, the 20 to 24 years age range has the highest percentage of unemployed individuals, with 17.6% or 3 of them being unemployed.
| Age Bracket | In Labor Force | Unemployed |
| 16 to 19 Years | 2 (6.9%) | 0 (0.0%) |
| 20 to 24 Years | 17 (47.2%) | 3 (17.6%) |
| 25 to 29 Years | 46 (74.2%) | 0 (0.0%) |
| 30 to 34 Years | 66 (94.3%) | 9 (13.6%) |
| 35 to 44 Years | 72 (67.3%) | 0 (0.0%) |
| 45 to 54 Years | 82 (96.5%) | 0 (0.0%) |
| 55 to 59 Years | 46 (85.2%) | 0 (0.0%) |
| 60 to 64 Years | 29 (53.7%) | 0 (0.0%) |
| 65 to 74 Years | 30 (56.6%) | 0 (0.0%) |
| 75 Years and over | 0 (0.0%) | 0 (0.0%) |
| Total | 390 (64.4%) | 12 (3.1%) |
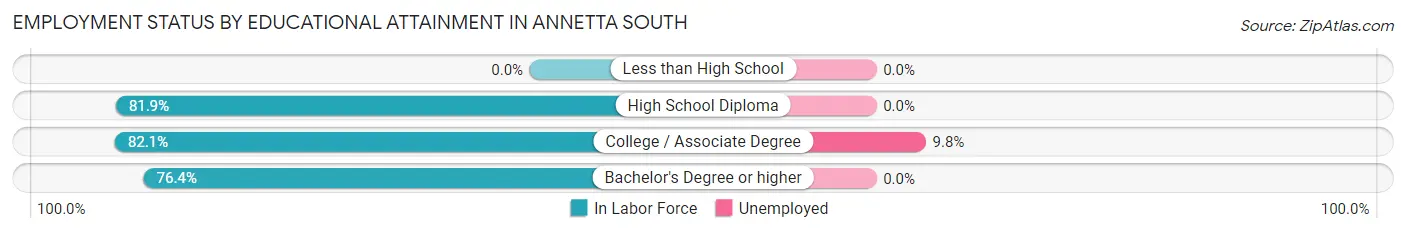
Employment Status by Educational Attainment in Annetta South
According to labor force statistics for Annetta South, 78.9% of individuals (341) out of the total population between 25 and 64 years of age (432) are in the labor force, with 2.6% or 9 of them being unemployed. The group with the highest labor force participation rate are those with the educational attainment of college / associate degree, with 82.1% or 92 individuals in the labor force. Within the labor force, individuals with college / associate degree education have the highest percentage of unemployment, with 9.8% or 9 of them being unemployed.
| Educational Attainment | In Labor Force | Unemployed |
| Less than High School | 0 (0.0%) | 0 (0.0%) |
| High School Diploma | 68 (81.9%) | 0 (0.0%) |
| College / Associate Degree | 92 (82.1%) | 11 (9.8%) |
| Bachelor's Degree or higher | 181 (76.4%) | 0 (0.0%) |
| Total | 341 (78.9%) | 11 (2.6%) |
Employment Occupations by Sex in Annetta South
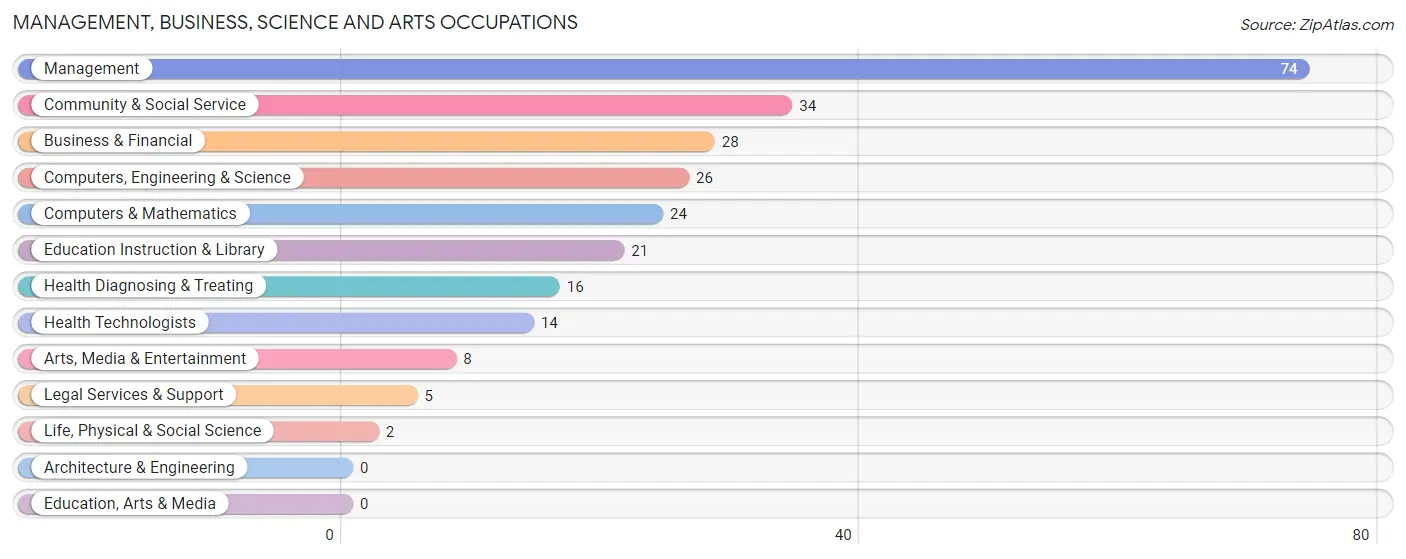
Management, Business, Science and Arts Occupations
The most common Management, Business, Science and Arts occupations in Annetta South are Management (74 | 19.6%), Community & Social Service (34 | 9.0%), Business & Financial (28 | 7.4%), Computers, Engineering & Science (26 | 6.9%), and Computers & Mathematics (24 | 6.4%).
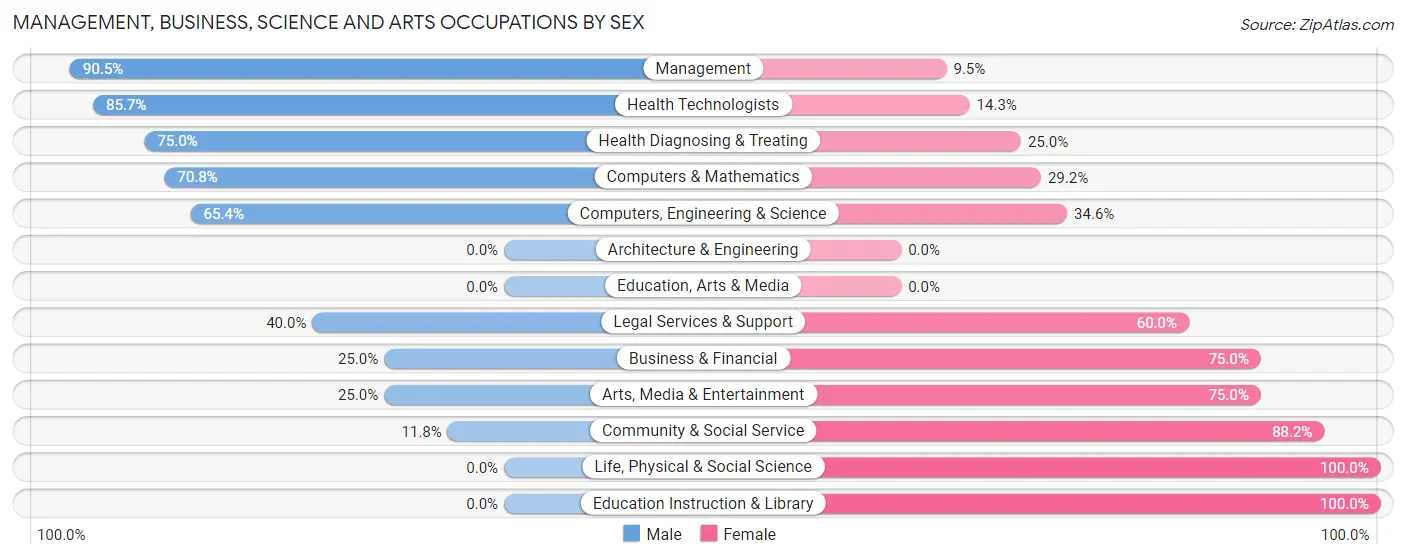
Management, Business, Science and Arts Occupations by Sex
Within the Management, Business, Science and Arts occupations in Annetta South, the most male-oriented occupations are Management (90.5%), Health Technologists (85.7%), and Health Diagnosing & Treating (75.0%), while the most female-oriented occupations are Life, Physical & Social Science (100.0%), Education Instruction & Library (100.0%), and Community & Social Service (88.2%).
| Occupation | Male | Female |
| Management | 67 (90.5%) | 7 (9.5%) |
| Business & Financial | 7 (25.0%) | 21 (75.0%) |
| Computers, Engineering & Science | 17 (65.4%) | 9 (34.6%) |
| Computers & Mathematics | 17 (70.8%) | 7 (29.2%) |
| Architecture & Engineering | 0 (0.0%) | 0 (0.0%) |
| Life, Physical & Social Science | 0 (0.0%) | 2 (100.0%) |
| Community & Social Service | 4 (11.8%) | 30 (88.2%) |
| Education, Arts & Media | 0 (0.0%) | 0 (0.0%) |
| Legal Services & Support | 2 (40.0%) | 3 (60.0%) |
| Education Instruction & Library | 0 (0.0%) | 21 (100.0%) |
| Arts, Media & Entertainment | 2 (25.0%) | 6 (75.0%) |
| Health Diagnosing & Treating | 12 (75.0%) | 4 (25.0%) |
| Health Technologists | 12 (85.7%) | 2 (14.3%) |
| Total (Category) | 107 (60.1%) | 71 (39.9%) |
| Total (Overall) | 219 (57.9%) | 159 (42.1%) |
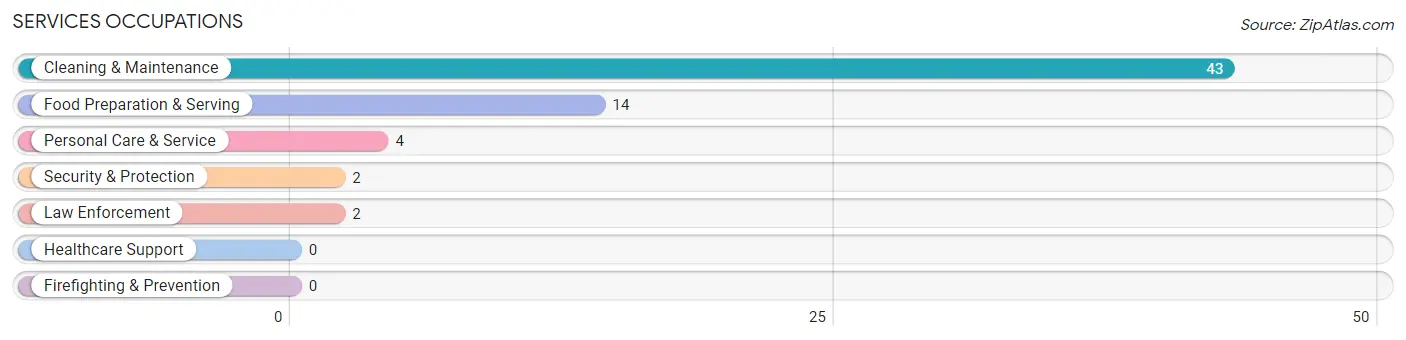
Services Occupations
The most common Services occupations in Annetta South are Cleaning & Maintenance (43 | 11.4%), Food Preparation & Serving (14 | 3.7%), Personal Care & Service (4 | 1.1%), Security & Protection (2 | 0.5%), and Law Enforcement (2 | 0.5%).
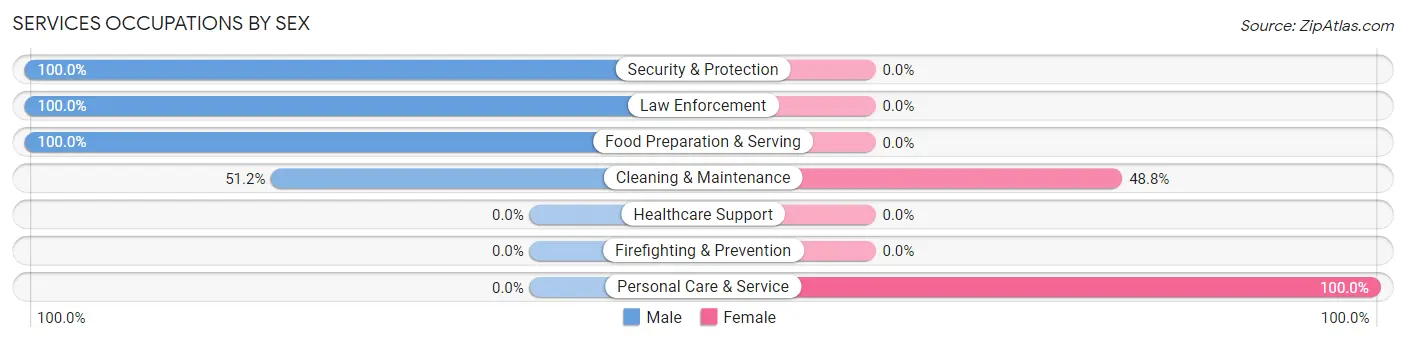
Services Occupations by Sex
Within the Services occupations in Annetta South, the most male-oriented occupations are Security & Protection (100.0%), Law Enforcement (100.0%), and Food Preparation & Serving (100.0%), while the most female-oriented occupations are Personal Care & Service (100.0%), and Cleaning & Maintenance (48.8%).
| Occupation | Male | Female |
| Healthcare Support | 0 (0.0%) | 0 (0.0%) |
| Security & Protection | 2 (100.0%) | 0 (0.0%) |
| Firefighting & Prevention | 0 (0.0%) | 0 (0.0%) |
| Law Enforcement | 2 (100.0%) | 0 (0.0%) |
| Food Preparation & Serving | 14 (100.0%) | 0 (0.0%) |
| Cleaning & Maintenance | 22 (51.2%) | 21 (48.8%) |
| Personal Care & Service | 0 (0.0%) | 4 (100.0%) |
| Total (Category) | 38 (60.3%) | 25 (39.7%) |
| Total (Overall) | 219 (57.9%) | 159 (42.1%) |
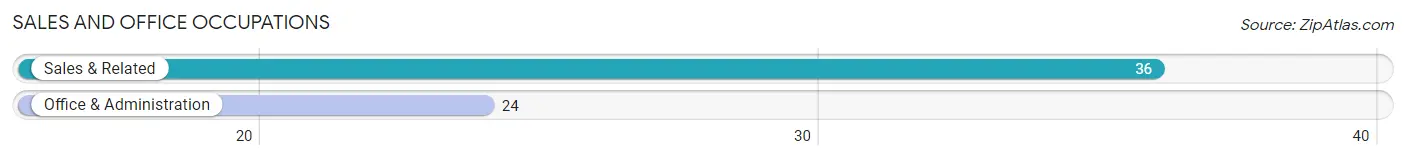
Sales and Office Occupations
The most common Sales and Office occupations in Annetta South are Sales & Related (36 | 9.5%), and Office & Administration (24 | 6.4%).
Sales and Office Occupations by Sex
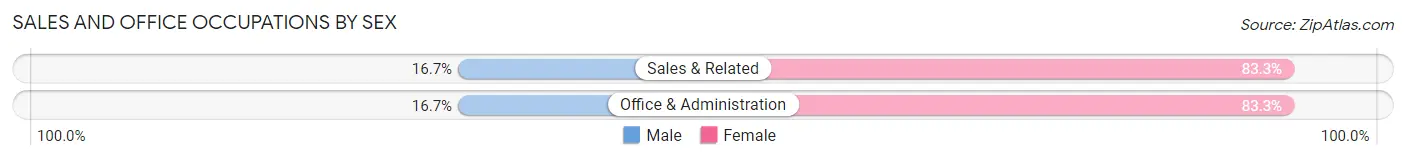
| Occupation | Male | Female |
| Sales & Related | 6 (16.7%) | 30 (83.3%) |
| Office & Administration | 4 (16.7%) | 20 (83.3%) |
| Total (Category) | 10 (16.7%) | 50 (83.3%) |
| Total (Overall) | 219 (57.9%) | 159 (42.1%) |
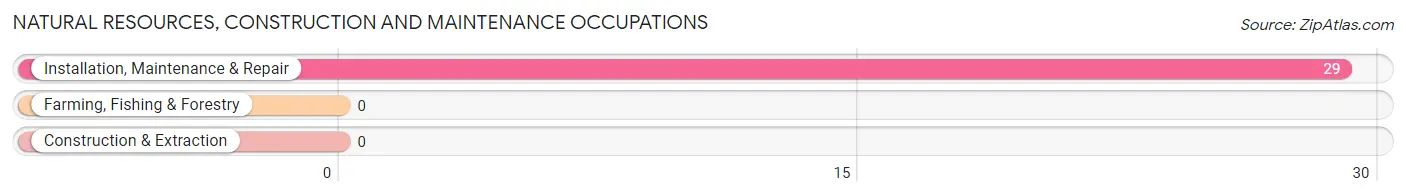
Natural Resources, Construction and Maintenance Occupations
The most common Natural Resources, Construction and Maintenance occupations in Annetta South are , and Installation, Maintenance & Repair (29 | 7.7%).
Natural Resources, Construction and Maintenance Occupations by Sex
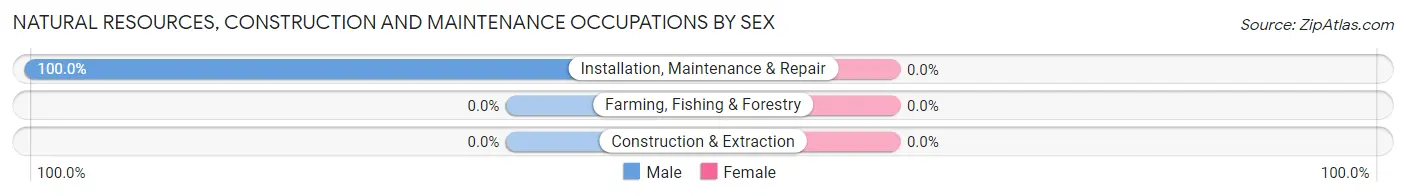
| Occupation | Male | Female |
| Farming, Fishing & Forestry | 0 (0.0%) | 0 (0.0%) |
| Construction & Extraction | 0 (0.0%) | 0 (0.0%) |
| Installation, Maintenance & Repair | 29 (100.0%) | 0 (0.0%) |
| Total (Category) | 29 (100.0%) | 0 (0.0%) |
| Total (Overall) | 219 (57.9%) | 159 (42.1%) |
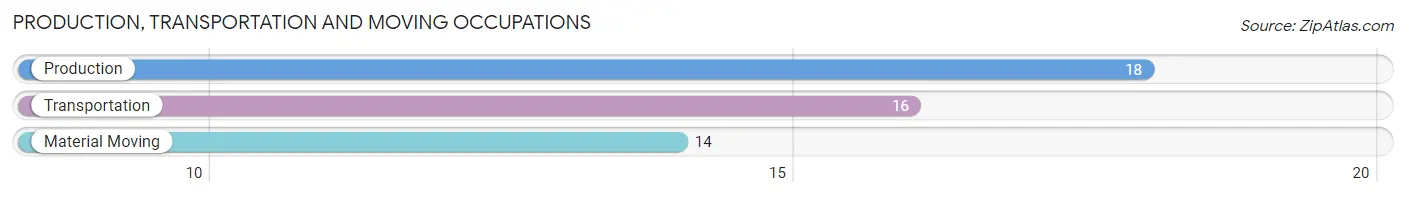
Production, Transportation and Moving Occupations
The most common Production, Transportation and Moving occupations in Annetta South are Production (18 | 4.8%), Transportation (16 | 4.2%), and Material Moving (14 | 3.7%).
Production, Transportation and Moving Occupations by Sex
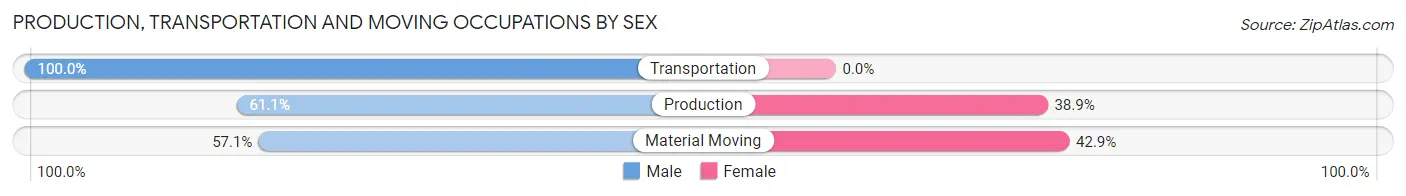
| Occupation | Male | Female |
| Production | 11 (61.1%) | 7 (38.9%) |
| Transportation | 16 (100.0%) | 0 (0.0%) |
| Material Moving | 8 (57.1%) | 6 (42.9%) |
| Total (Category) | 35 (72.9%) | 13 (27.1%) |
| Total (Overall) | 219 (57.9%) | 159 (42.1%) |
Employment Industries by Sex in Annetta South
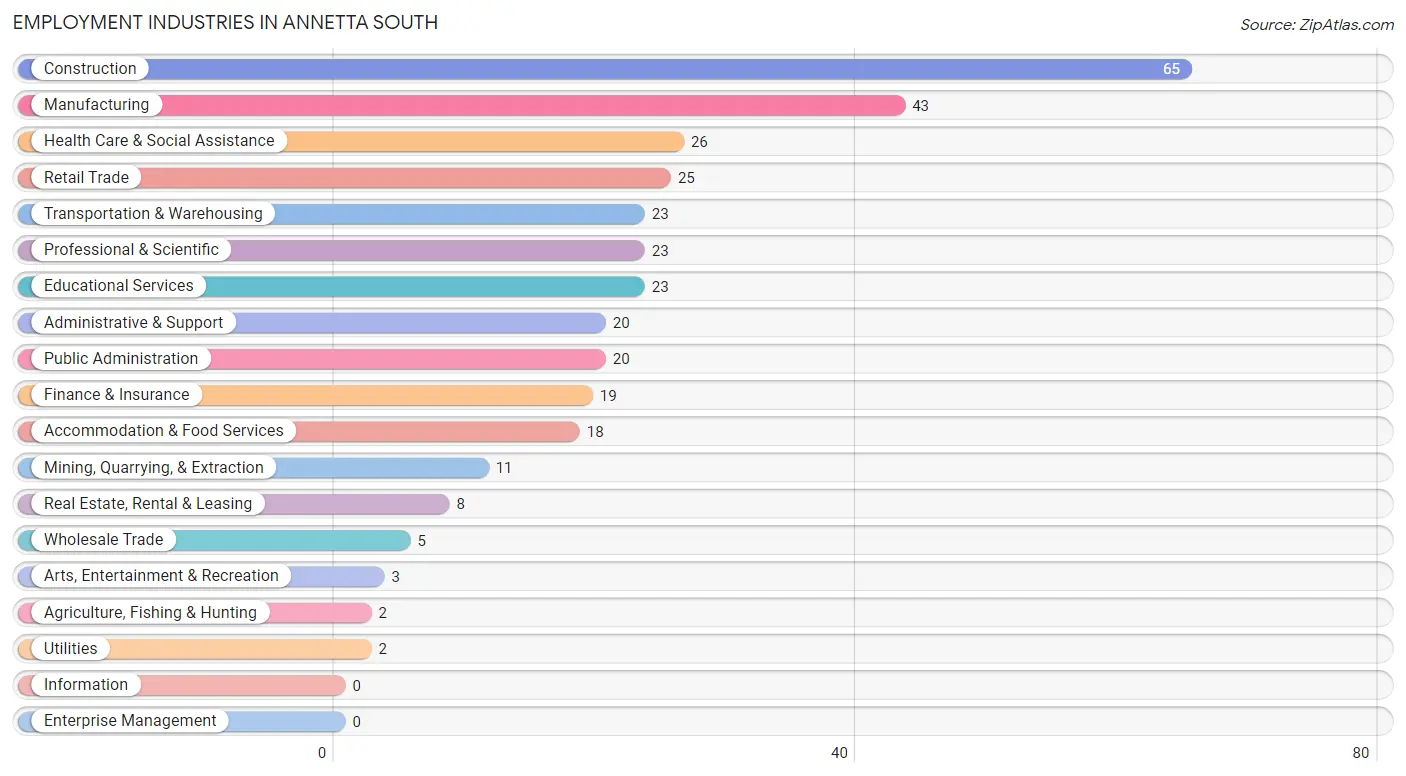
Employment Industries in Annetta South
The major employment industries in Annetta South include Construction (65 | 17.2%), Manufacturing (43 | 11.4%), Health Care & Social Assistance (26 | 6.9%), Retail Trade (25 | 6.6%), and Transportation & Warehousing (23 | 6.1%).
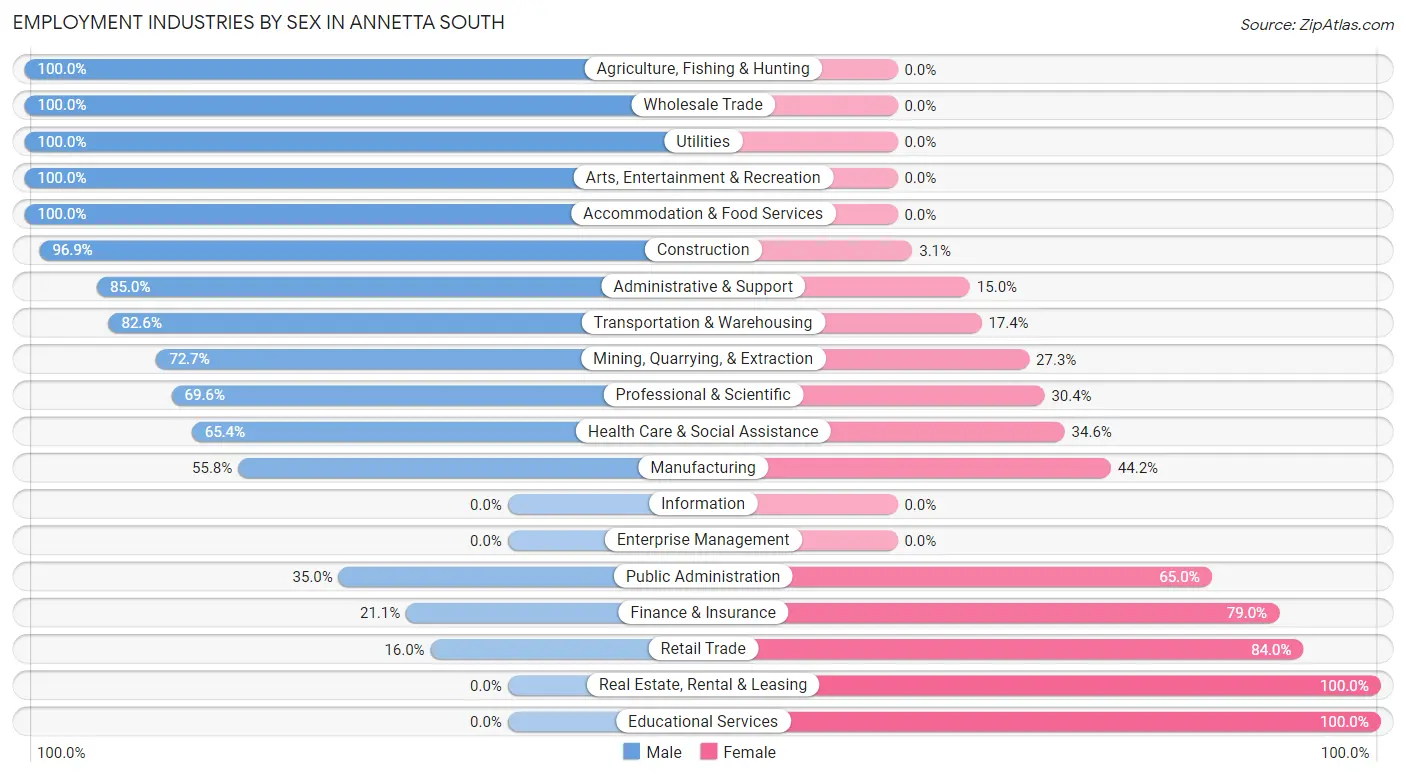
Employment Industries by Sex in Annetta South
The Annetta South industries that see more men than women are Agriculture, Fishing & Hunting (100.0%), Wholesale Trade (100.0%), and Utilities (100.0%), whereas the industries that tend to have a higher number of women are Real Estate, Rental & Leasing (100.0%), Educational Services (100.0%), and Retail Trade (84.0%).
| Industry | Male | Female |
| Agriculture, Fishing & Hunting | 2 (100.0%) | 0 (0.0%) |
| Mining, Quarrying, & Extraction | 8 (72.7%) | 3 (27.3%) |
| Construction | 63 (96.9%) | 2 (3.1%) |
| Manufacturing | 24 (55.8%) | 19 (44.2%) |
| Wholesale Trade | 5 (100.0%) | 0 (0.0%) |
| Retail Trade | 4 (16.0%) | 21 (84.0%) |
| Transportation & Warehousing | 19 (82.6%) | 4 (17.4%) |
| Utilities | 2 (100.0%) | 0 (0.0%) |
| Information | 0 (0.0%) | 0 (0.0%) |
| Finance & Insurance | 4 (21.0%) | 15 (78.9%) |
| Real Estate, Rental & Leasing | 0 (0.0%) | 8 (100.0%) |
| Professional & Scientific | 16 (69.6%) | 7 (30.4%) |
| Enterprise Management | 0 (0.0%) | 0 (0.0%) |
| Administrative & Support | 17 (85.0%) | 3 (15.0%) |
| Educational Services | 0 (0.0%) | 23 (100.0%) |
| Health Care & Social Assistance | 17 (65.4%) | 9 (34.6%) |
| Arts, Entertainment & Recreation | 3 (100.0%) | 0 (0.0%) |
| Accommodation & Food Services | 18 (100.0%) | 0 (0.0%) |
| Public Administration | 7 (35.0%) | 13 (65.0%) |
| Total | 219 (57.9%) | 159 (42.1%) |
Education in Annetta South
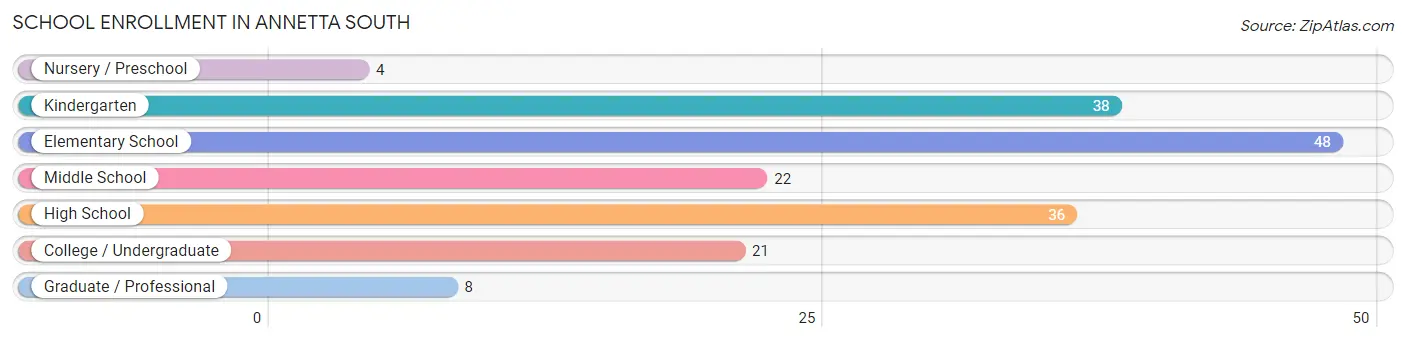
School Enrollment in Annetta South
The most common levels of schooling among the 177 students in Annetta South are elementary school (48 | 27.1%), kindergarten (38 | 21.5%), and high school (36 | 20.3%).
| School Level | # Students | % Students |
| Nursery / Preschool | 4 | 2.3% |
| Kindergarten | 38 | 21.5% |
| Elementary School | 48 | 27.1% |
| Middle School | 22 | 12.4% |
| High School | 36 | 20.3% |
| College / Undergraduate | 21 | 11.9% |
| Graduate / Professional | 8 | 4.5% |
| Total | 177 | 100.0% |
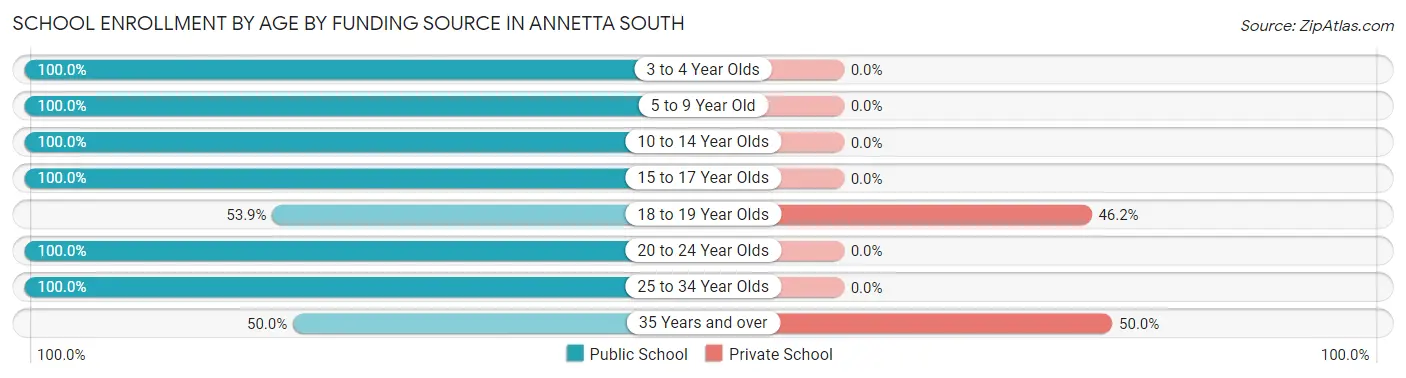
School Enrollment by Age by Funding Source in Annetta South
Out of a total of 177 students who are enrolled in schools in Annetta South, 8 (4.5%) attend a private institution, while the remaining 169 (95.5%) are enrolled in public schools. The age group of 35 years and over has the highest likelihood of being enrolled in private schools, with 2 (50.0% in the age bracket) enrolled. Conversely, the age group of 3 to 4 year olds has the lowest likelihood of being enrolled in a private school, with 2 (100.0% in the age bracket) attending a public institution.
| Age Bracket | Public School | Private School |
| 3 to 4 Year Olds | 2 (100.0%) | 0 (0.0%) |
| 5 to 9 Year Old | 86 (100.0%) | 0 (0.0%) |
| 10 to 14 Year Olds | 24 (100.0%) | 0 (0.0%) |
| 15 to 17 Year Olds | 26 (100.0%) | 0 (0.0%) |
| 18 to 19 Year Olds | 7 (53.8%) | 6 (46.2%) |
| 20 to 24 Year Olds | 14 (100.0%) | 0 (0.0%) |
| 25 to 34 Year Olds | 8 (100.0%) | 0 (0.0%) |
| 35 Years and over | 2 (50.0%) | 2 (50.0%) |
| Total | 169 (95.5%) | 8 (4.5%) |
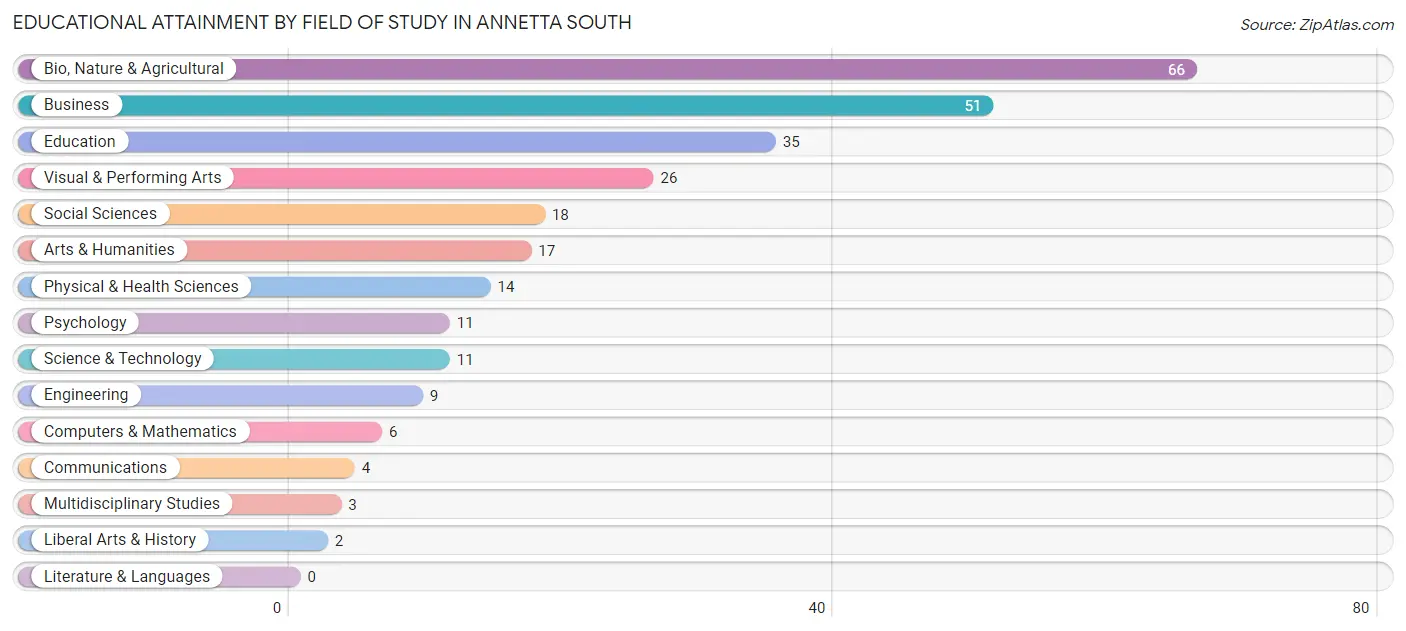
Educational Attainment by Field of Study in Annetta South
Bio, nature & agricultural (66 | 24.2%), business (51 | 18.7%), education (35 | 12.8%), visual & performing arts (26 | 9.5%), and social sciences (18 | 6.6%) are the most common fields of study among 273 individuals in Annetta South who have obtained a bachelor's degree or higher.
| Field of Study | # Graduates | % Graduates |
| Computers & Mathematics | 6 | 2.2% |
| Bio, Nature & Agricultural | 66 | 24.2% |
| Physical & Health Sciences | 14 | 5.1% |
| Psychology | 11 | 4.0% |
| Social Sciences | 18 | 6.6% |
| Engineering | 9 | 3.3% |
| Multidisciplinary Studies | 3 | 1.1% |
| Science & Technology | 11 | 4.0% |
| Business | 51 | 18.7% |
| Education | 35 | 12.8% |
| Literature & Languages | 0 | 0.0% |
| Liberal Arts & History | 2 | 0.7% |
| Visual & Performing Arts | 26 | 9.5% |
| Communications | 4 | 1.5% |
| Arts & Humanities | 17 | 6.2% |
| Total | 273 | 100.0% |
Transportation & Commute in Annetta South
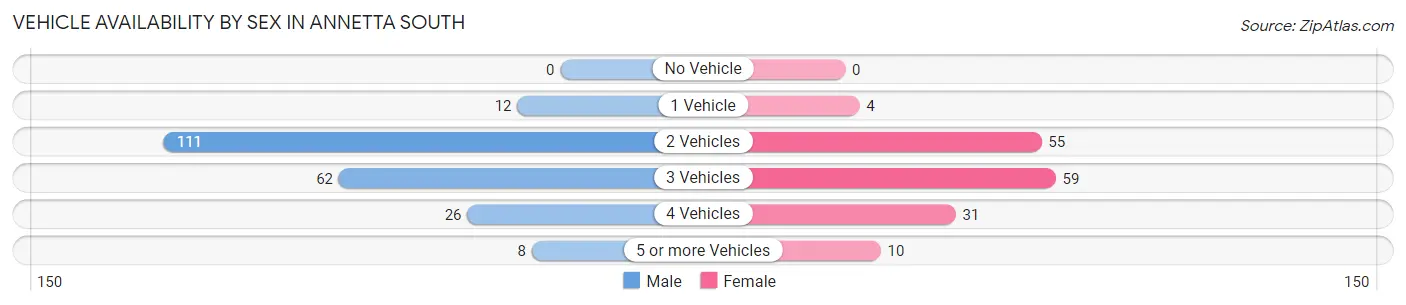
Vehicle Availability by Sex in Annetta South
The most prevalent vehicle ownership categories in Annetta South are males with 2 vehicles (111, accounting for 50.7%) and females with 2 vehicles (55, making up 69.8%).
| Vehicles Available | Male | Female |
| No Vehicle | 0 (0.0%) | 0 (0.0%) |
| 1 Vehicle | 12 (5.5%) | 4 (2.5%) |
| 2 Vehicles | 111 (50.7%) | 55 (34.6%) |
| 3 Vehicles | 62 (28.3%) | 59 (37.1%) |
| 4 Vehicles | 26 (11.9%) | 31 (19.5%) |
| 5 or more Vehicles | 8 (3.6%) | 10 (6.3%) |
| Total | 219 (100.0%) | 159 (100.0%) |
Commute Time in Annetta South
The most frequently occuring commute durations in Annetta South are 30 to 34 minutes (82 commuters, 23.7%), 60 to 89 minutes (73 commuters, 21.1%), and 20 to 24 minutes (57 commuters, 16.5%).
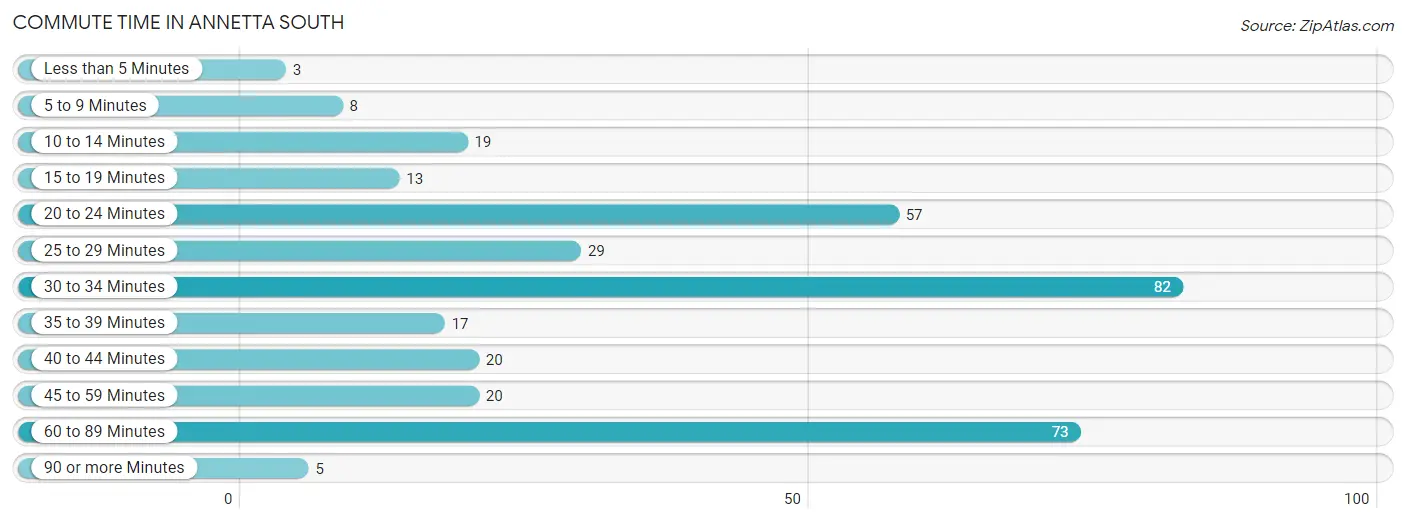
| Commute Time | # Commuters | % Commuters |
| Less than 5 Minutes | 3 | 0.9% |
| 5 to 9 Minutes | 8 | 2.3% |
| 10 to 14 Minutes | 19 | 5.5% |
| 15 to 19 Minutes | 13 | 3.8% |
| 20 to 24 Minutes | 57 | 16.5% |
| 25 to 29 Minutes | 29 | 8.4% |
| 30 to 34 Minutes | 82 | 23.7% |
| 35 to 39 Minutes | 17 | 4.9% |
| 40 to 44 Minutes | 20 | 5.8% |
| 45 to 59 Minutes | 20 | 5.8% |
| 60 to 89 Minutes | 73 | 21.1% |
| 90 or more Minutes | 5 | 1.5% |
Commute Time by Sex in Annetta South
The most common commute times in Annetta South are 30 to 34 minutes (59 commuters, 28.1%) for males and 20 to 24 minutes (27 commuters, 19.9%) for females.
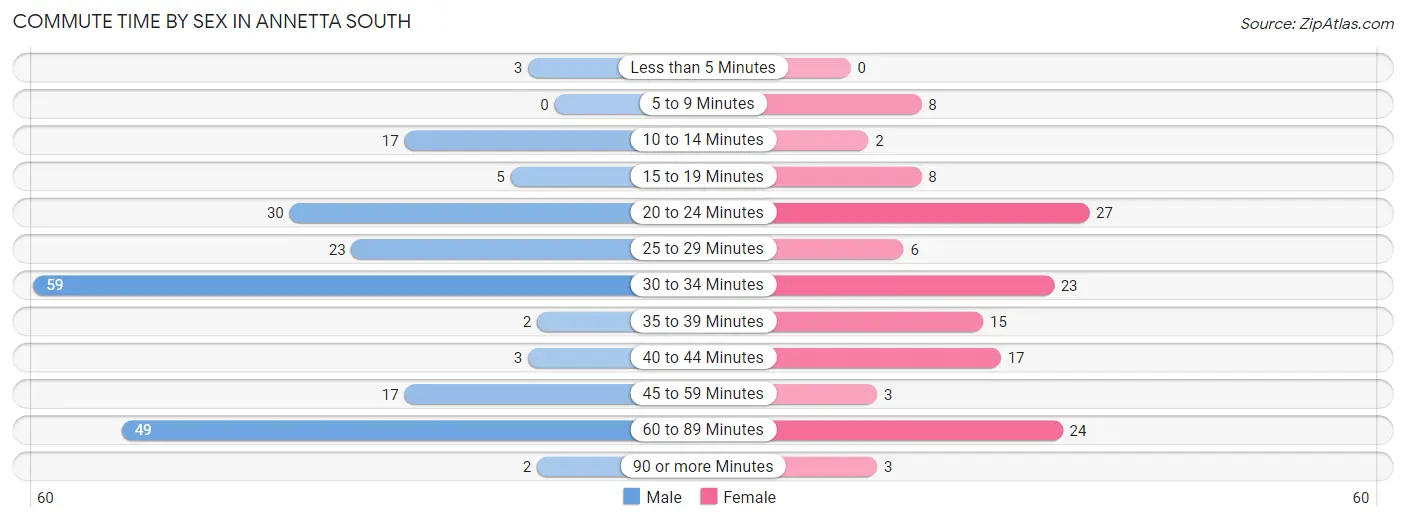
| Commute Time | Male | Female |
| Less than 5 Minutes | 3 (1.4%) | 0 (0.0%) |
| 5 to 9 Minutes | 0 (0.0%) | 8 (5.9%) |
| 10 to 14 Minutes | 17 (8.1%) | 2 (1.5%) |
| 15 to 19 Minutes | 5 (2.4%) | 8 (5.9%) |
| 20 to 24 Minutes | 30 (14.3%) | 27 (19.9%) |
| 25 to 29 Minutes | 23 (11.0%) | 6 (4.4%) |
| 30 to 34 Minutes | 59 (28.1%) | 23 (16.9%) |
| 35 to 39 Minutes | 2 (0.9%) | 15 (11.0%) |
| 40 to 44 Minutes | 3 (1.4%) | 17 (12.5%) |
| 45 to 59 Minutes | 17 (8.1%) | 3 (2.2%) |
| 60 to 89 Minutes | 49 (23.3%) | 24 (17.6%) |
| 90 or more Minutes | 2 (0.9%) | 3 (2.2%) |
Time of Departure to Work by Sex in Annetta South
The most frequent times of departure to work in Annetta South are 7:00 AM to 7:29 AM (92, 43.8%) for males and 8:00 AM to 8:29 AM (33, 24.3%) for females.
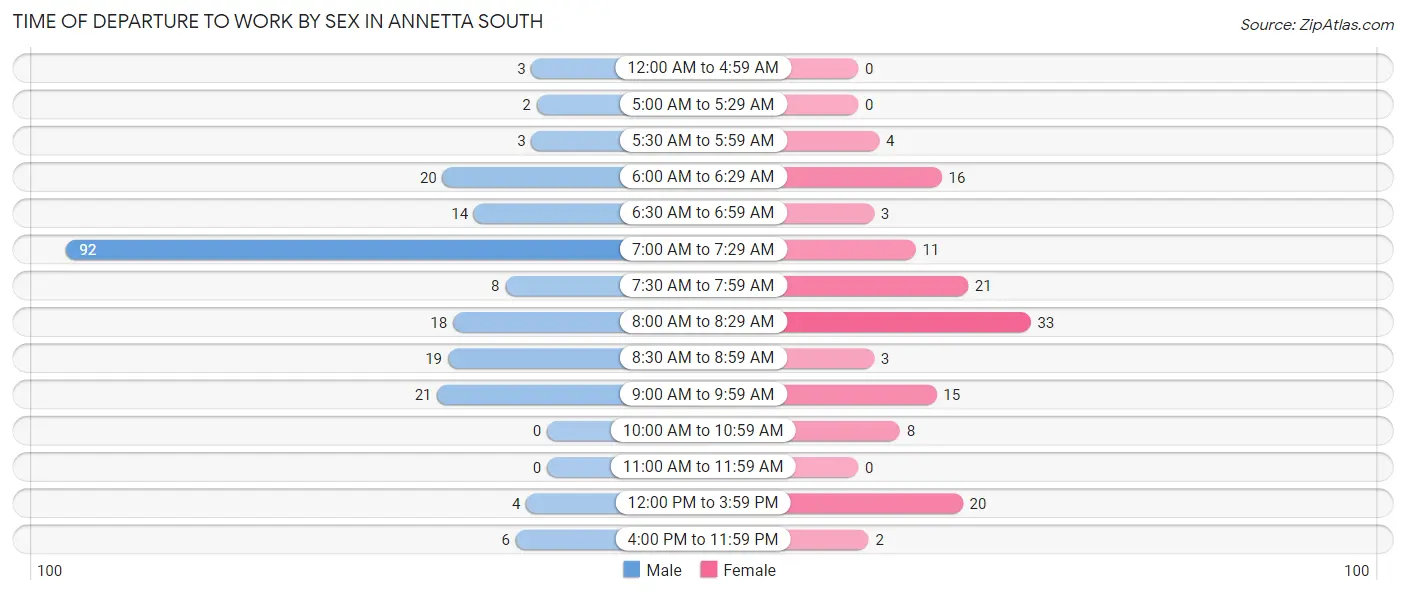
| Time of Departure | Male | Female |
| 12:00 AM to 4:59 AM | 3 (1.4%) | 0 (0.0%) |
| 5:00 AM to 5:29 AM | 2 (0.9%) | 0 (0.0%) |
| 5:30 AM to 5:59 AM | 3 (1.4%) | 4 (2.9%) |
| 6:00 AM to 6:29 AM | 20 (9.5%) | 16 (11.8%) |
| 6:30 AM to 6:59 AM | 14 (6.7%) | 3 (2.2%) |
| 7:00 AM to 7:29 AM | 92 (43.8%) | 11 (8.1%) |
| 7:30 AM to 7:59 AM | 8 (3.8%) | 21 (15.4%) |
| 8:00 AM to 8:29 AM | 18 (8.6%) | 33 (24.3%) |
| 8:30 AM to 8:59 AM | 19 (9.0%) | 3 (2.2%) |
| 9:00 AM to 9:59 AM | 21 (10.0%) | 15 (11.0%) |
| 10:00 AM to 10:59 AM | 0 (0.0%) | 8 (5.9%) |
| 11:00 AM to 11:59 AM | 0 (0.0%) | 0 (0.0%) |
| 12:00 PM to 3:59 PM | 4 (1.9%) | 20 (14.7%) |
| 4:00 PM to 11:59 PM | 6 (2.9%) | 2 (1.5%) |
| Total | 210 (100.0%) | 136 (100.0%) |
Housing Occupancy in Annetta South
Occupancy by Ownership in Annetta South
Of the total 248 dwellings in Annetta South, owner-occupied units account for 243 (98.0%), while renter-occupied units make up 5 (2.0%).
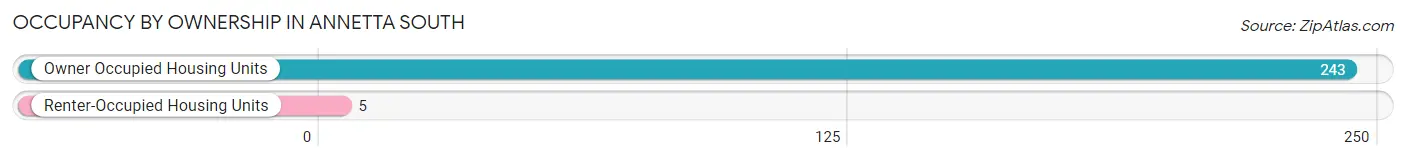
| Occupancy | # Housing Units | % Housing Units |
| Owner Occupied Housing Units | 243 | 98.0% |
| Renter-Occupied Housing Units | 5 | 2.0% |
| Total Occupied Housing Units | 248 | 100.0% |
Occupancy by Household Size in Annetta South
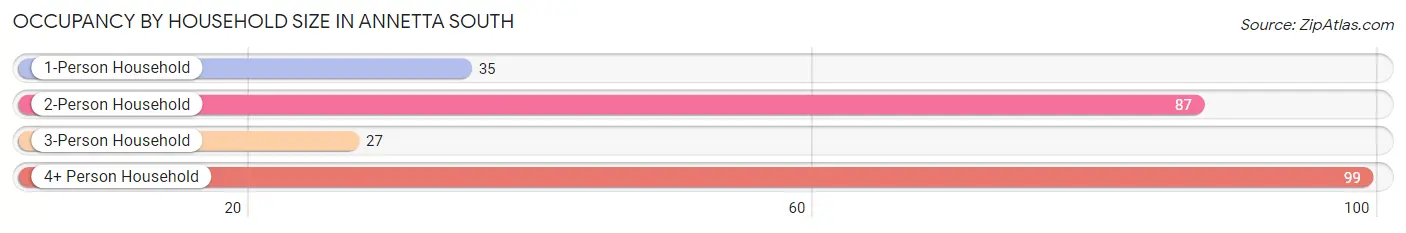
| Household Size | # Housing Units | % Housing Units |
| 1-Person Household | 35 | 14.1% |
| 2-Person Household | 87 | 35.1% |
| 3-Person Household | 27 | 10.9% |
| 4+ Person Household | 99 | 39.9% |
| Total Housing Units | 248 | 100.0% |
Occupancy by Ownership by Household Size in Annetta South
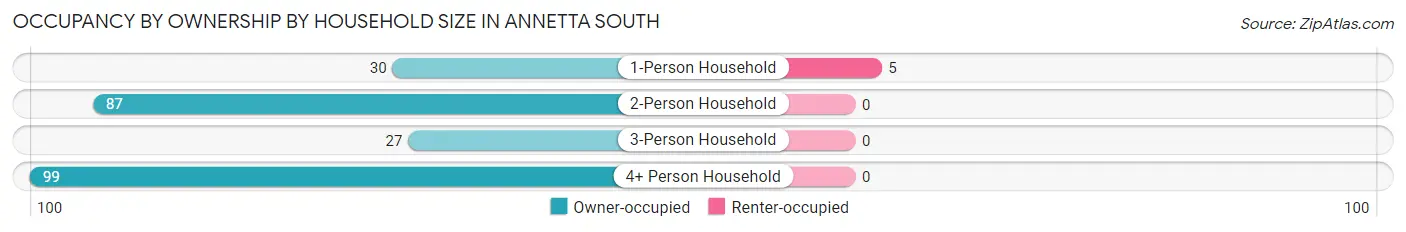
| Household Size | Owner-occupied | Renter-occupied |
| 1-Person Household | 30 (85.7%) | 5 (14.3%) |
| 2-Person Household | 87 (100.0%) | 0 (0.0%) |
| 3-Person Household | 27 (100.0%) | 0 (0.0%) |
| 4+ Person Household | 99 (100.0%) | 0 (0.0%) |
| Total Housing Units | 243 (98.0%) | 5 (2.0%) |
Occupancy by Educational Attainment in Annetta South
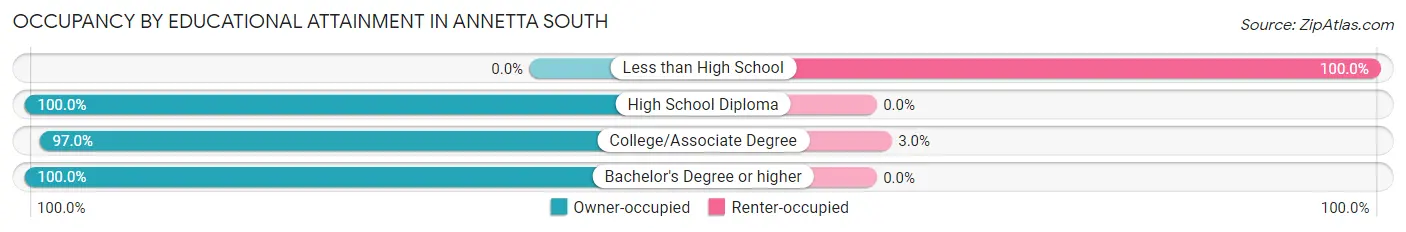
| Household Size | Owner-occupied | Renter-occupied |
| Less than High School | 0 (0.0%) | 3 (100.0%) |
| High School Diploma | 26 (100.0%) | 0 (0.0%) |
| College/Associate Degree | 65 (97.0%) | 2 (3.0%) |
| Bachelor's Degree or higher | 152 (100.0%) | 0 (0.0%) |
Occupancy by Age of Householder in Annetta South
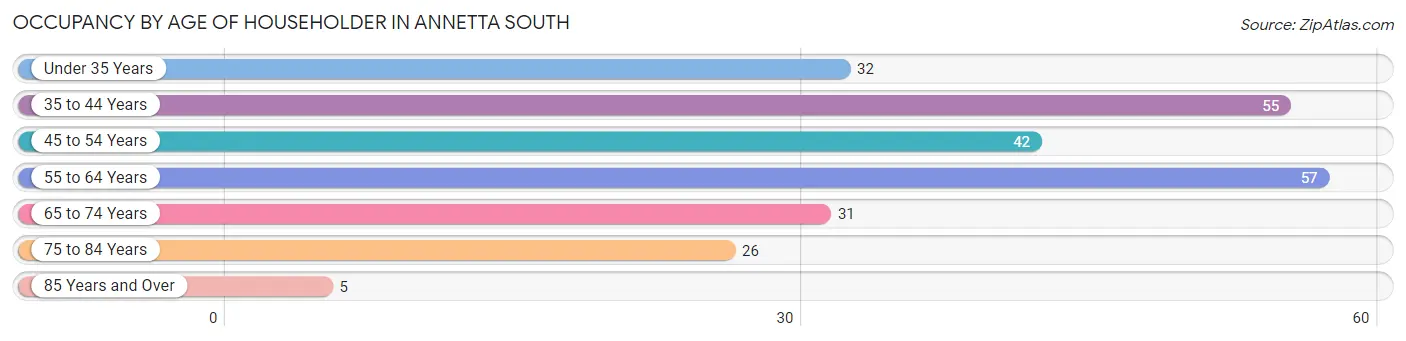
| Age Bracket | # Households | % Households |
| Under 35 Years | 32 | 12.9% |
| 35 to 44 Years | 55 | 22.2% |
| 45 to 54 Years | 42 | 16.9% |
| 55 to 64 Years | 57 | 23.0% |
| 65 to 74 Years | 31 | 12.5% |
| 75 to 84 Years | 26 | 10.5% |
| 85 Years and Over | 5 | 2.0% |
| Total | 248 | 100.0% |
Housing Finances in Annetta South
Median Income by Occupancy in Annetta South
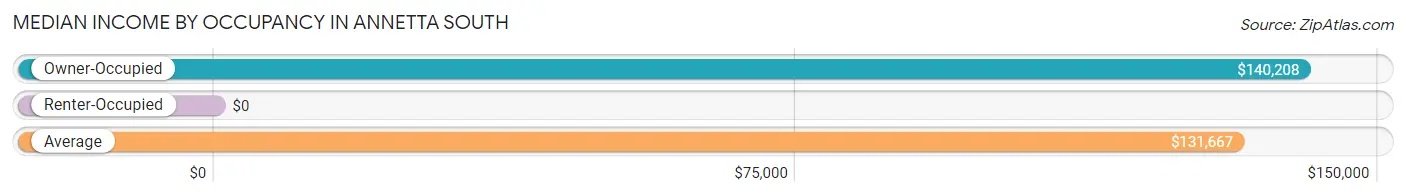
| Occupancy Type | # Households | Median Income |
| Owner-Occupied | 243 (98.0%) | $140,208 |
| Renter-Occupied | 5 (2.0%) | $0 |
| Average | 248 (100.0%) | $131,667 |
Occupancy by Householder Income Bracket in Annetta South
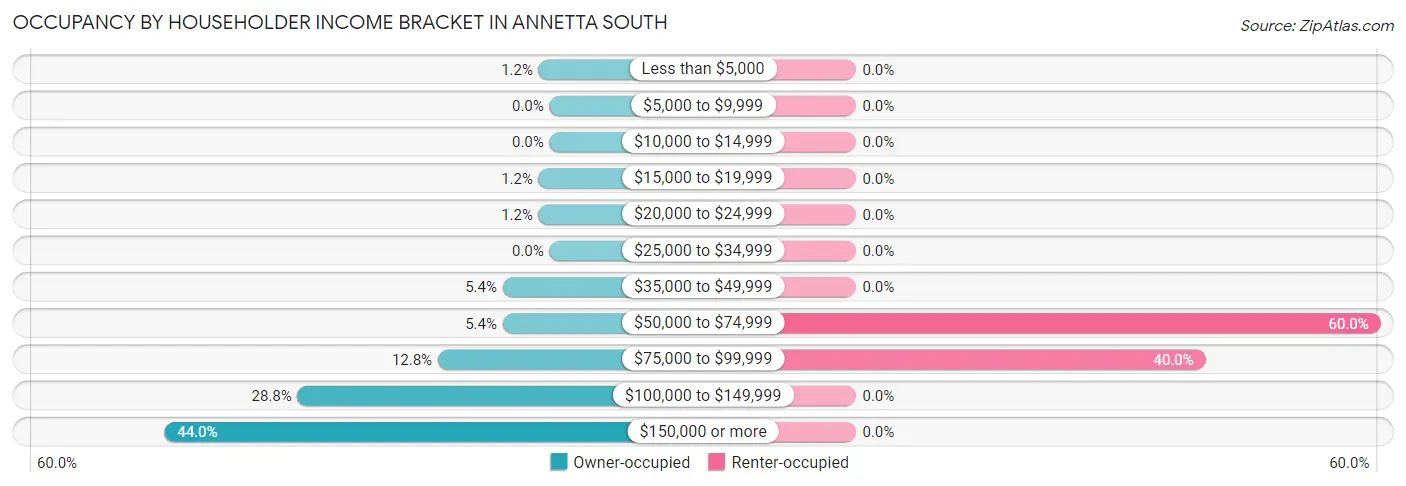
| Income Bracket | Owner-occupied | Renter-occupied |
| Less than $5,000 | 3 (1.2%) | 0 (0.0%) |
| $5,000 to $9,999 | 0 (0.0%) | 0 (0.0%) |
| $10,000 to $14,999 | 0 (0.0%) | 0 (0.0%) |
| $15,000 to $19,999 | 3 (1.2%) | 0 (0.0%) |
| $20,000 to $24,999 | 3 (1.2%) | 0 (0.0%) |
| $25,000 to $34,999 | 0 (0.0%) | 0 (0.0%) |
| $35,000 to $49,999 | 13 (5.3%) | 0 (0.0%) |
| $50,000 to $74,999 | 13 (5.3%) | 3 (60.0%) |
| $75,000 to $99,999 | 31 (12.8%) | 2 (40.0%) |
| $100,000 to $149,999 | 70 (28.8%) | 0 (0.0%) |
| $150,000 or more | 107 (44.0%) | 0 (0.0%) |
| Total | 243 (100.0%) | 5 (100.0%) |
Monthly Housing Cost Tiers in Annetta South
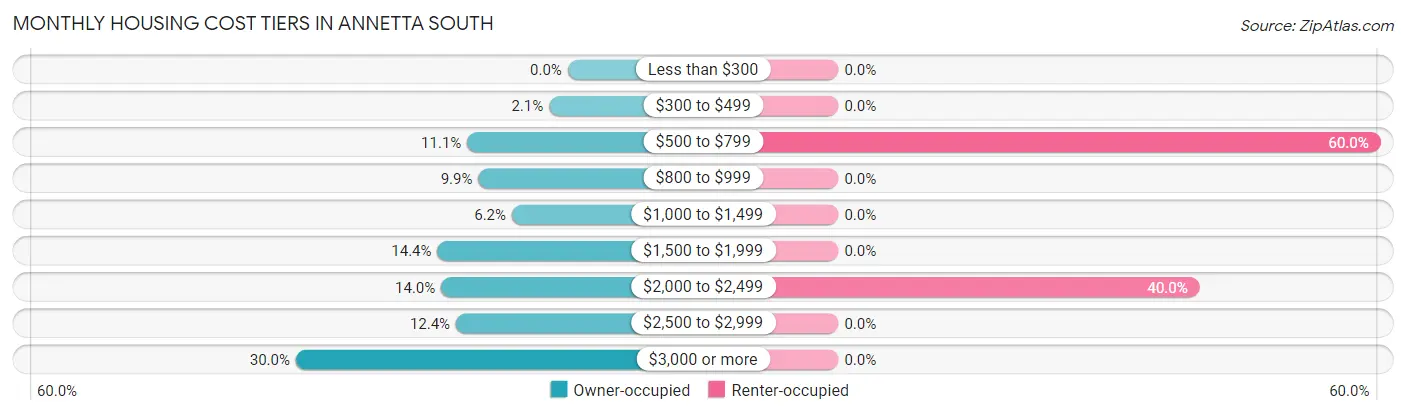
| Monthly Cost | Owner-occupied | Renter-occupied |
| Less than $300 | 0 (0.0%) | 0 (0.0%) |
| $300 to $499 | 5 (2.1%) | 0 (0.0%) |
| $500 to $799 | 27 (11.1%) | 3 (60.0%) |
| $800 to $999 | 24 (9.9%) | 0 (0.0%) |
| $1,000 to $1,499 | 15 (6.2%) | 0 (0.0%) |
| $1,500 to $1,999 | 35 (14.4%) | 0 (0.0%) |
| $2,000 to $2,499 | 34 (14.0%) | 2 (40.0%) |
| $2,500 to $2,999 | 30 (12.3%) | 0 (0.0%) |
| $3,000 or more | 73 (30.0%) | 0 (0.0%) |
| Total | 243 (100.0%) | 5 (100.0%) |
Physical Housing Characteristics in Annetta South
Housing Structures in Annetta South
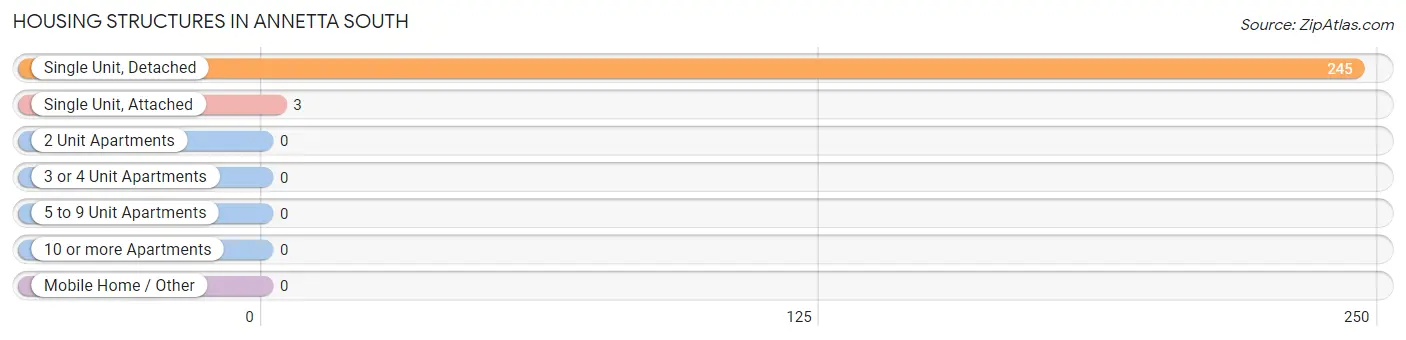
| Structure Type | # Housing Units | % Housing Units |
| Single Unit, Detached | 245 | 98.8% |
| Single Unit, Attached | 3 | 1.2% |
| 2 Unit Apartments | 0 | 0.0% |
| 3 or 4 Unit Apartments | 0 | 0.0% |
| 5 to 9 Unit Apartments | 0 | 0.0% |
| 10 or more Apartments | 0 | 0.0% |
| Mobile Home / Other | 0 | 0.0% |
| Total | 248 | 100.0% |
Housing Structures by Occupancy in Annetta South
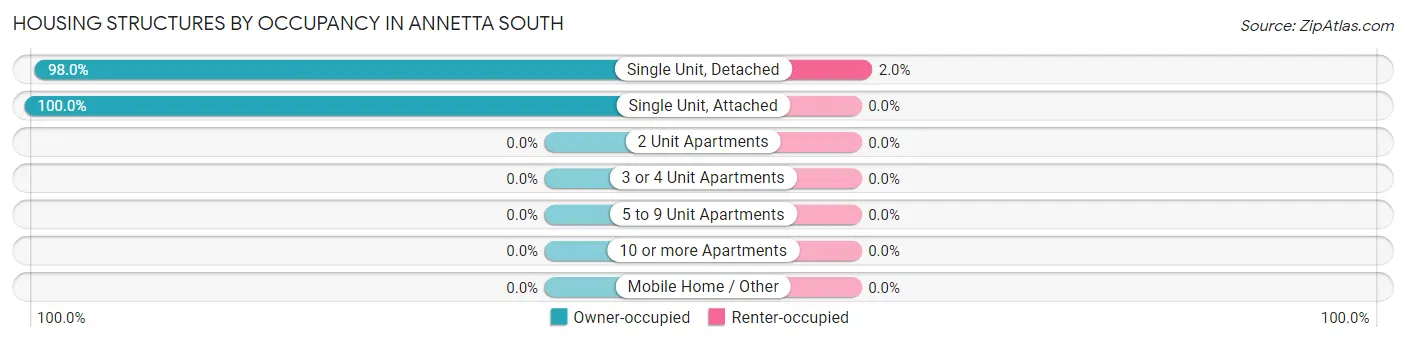
| Structure Type | Owner-occupied | Renter-occupied |
| Single Unit, Detached | 240 (98.0%) | 5 (2.0%) |
| Single Unit, Attached | 3 (100.0%) | 0 (0.0%) |
| 2 Unit Apartments | 0 (0.0%) | 0 (0.0%) |
| 3 or 4 Unit Apartments | 0 (0.0%) | 0 (0.0%) |
| 5 to 9 Unit Apartments | 0 (0.0%) | 0 (0.0%) |
| 10 or more Apartments | 0 (0.0%) | 0 (0.0%) |
| Mobile Home / Other | 0 (0.0%) | 0 (0.0%) |
| Total | 243 (98.0%) | 5 (2.0%) |
Housing Structures by Number of Rooms in Annetta South
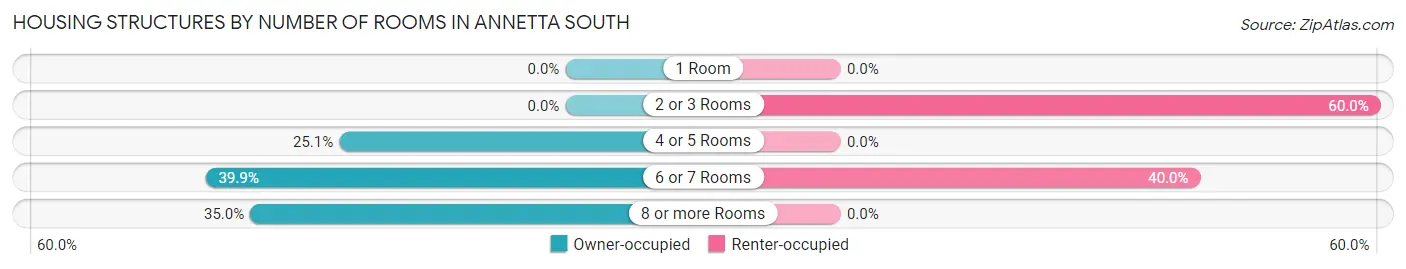
| Number of Rooms | Owner-occupied | Renter-occupied |
| 1 Room | 0 (0.0%) | 0 (0.0%) |
| 2 or 3 Rooms | 0 (0.0%) | 3 (60.0%) |
| 4 or 5 Rooms | 61 (25.1%) | 0 (0.0%) |
| 6 or 7 Rooms | 97 (39.9%) | 2 (40.0%) |
| 8 or more Rooms | 85 (35.0%) | 0 (0.0%) |
| Total | 243 (100.0%) | 5 (100.0%) |
Housing Structure by Heating Type in Annetta South
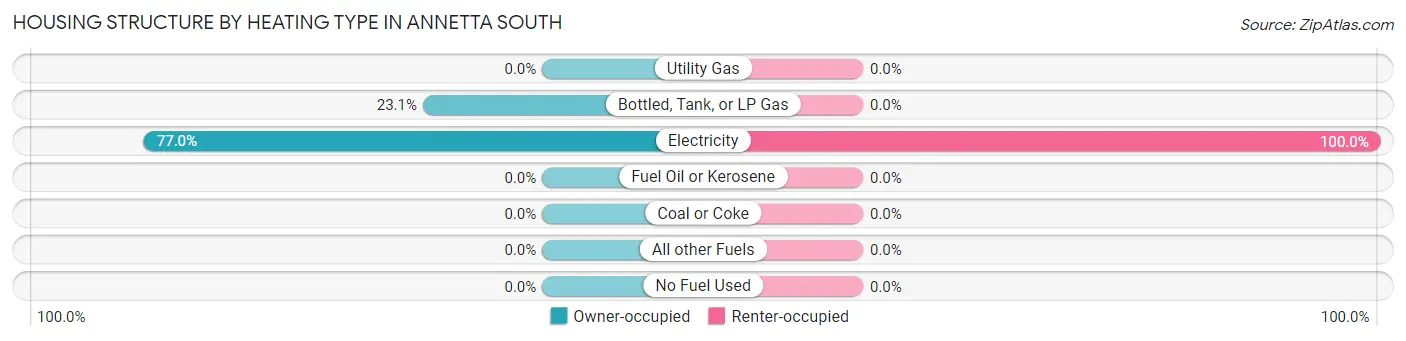
| Heating Type | Owner-occupied | Renter-occupied |
| Utility Gas | 0 (0.0%) | 0 (0.0%) |
| Bottled, Tank, or LP Gas | 56 (23.1%) | 0 (0.0%) |
| Electricity | 187 (76.9%) | 5 (100.0%) |
| Fuel Oil or Kerosene | 0 (0.0%) | 0 (0.0%) |
| Coal or Coke | 0 (0.0%) | 0 (0.0%) |
| All other Fuels | 0 (0.0%) | 0 (0.0%) |
| No Fuel Used | 0 (0.0%) | 0 (0.0%) |
| Total | 243 (100.0%) | 5 (100.0%) |
Household Vehicle Usage in Annetta South
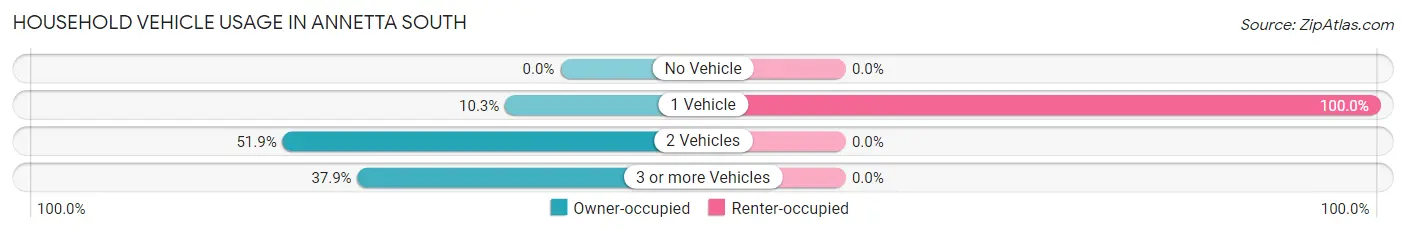
| Vehicles per Household | Owner-occupied | Renter-occupied |
| No Vehicle | 0 (0.0%) | 0 (0.0%) |
| 1 Vehicle | 25 (10.3%) | 5 (100.0%) |
| 2 Vehicles | 126 (51.8%) | 0 (0.0%) |
| 3 or more Vehicles | 92 (37.9%) | 0 (0.0%) |
| Total | 243 (100.0%) | 5 (100.0%) |
Real Estate & Mortgages in Annetta South
Real Estate and Mortgage Overview in Annetta South
| Characteristic | Without Mortgage | With Mortgage |
| Housing Units | 64 | 179 |
| Median Property Value | $366,700 | $426,100 |
| Median Household Income | $91,250 | $89 |
| Monthly Housing Costs | $817 | $73 |
| Real Estate Taxes | $4,286 | $2 |
Property Value by Mortgage Status in Annetta South
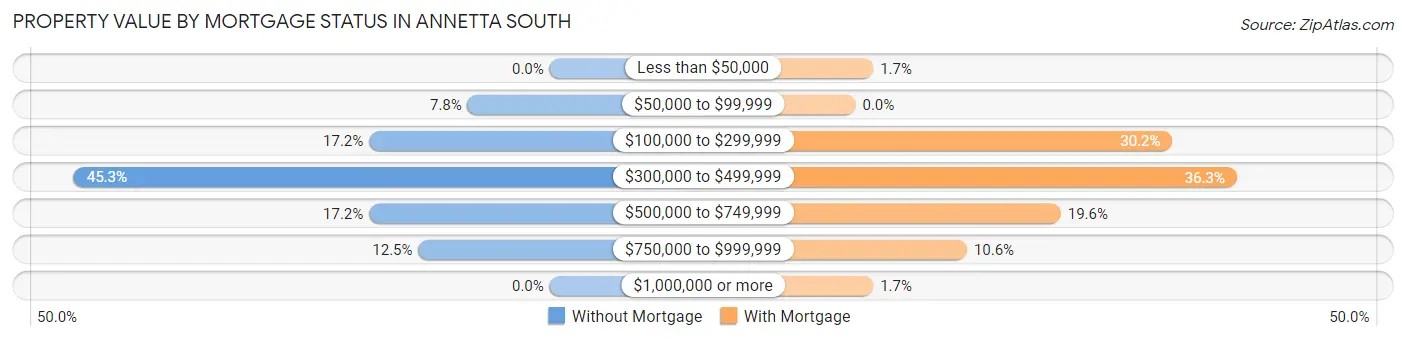
| Property Value | Without Mortgage | With Mortgage |
| Less than $50,000 | 0 (0.0%) | 3 (1.7%) |
| $50,000 to $99,999 | 5 (7.8%) | 0 (0.0%) |
| $100,000 to $299,999 | 11 (17.2%) | 54 (30.2%) |
| $300,000 to $499,999 | 29 (45.3%) | 65 (36.3%) |
| $500,000 to $749,999 | 11 (17.2%) | 35 (19.6%) |
| $750,000 to $999,999 | 8 (12.5%) | 19 (10.6%) |
| $1,000,000 or more | 0 (0.0%) | 3 (1.7%) |
| Total | 64 (100.0%) | 179 (100.0%) |
Household Income by Mortgage Status in Annetta South
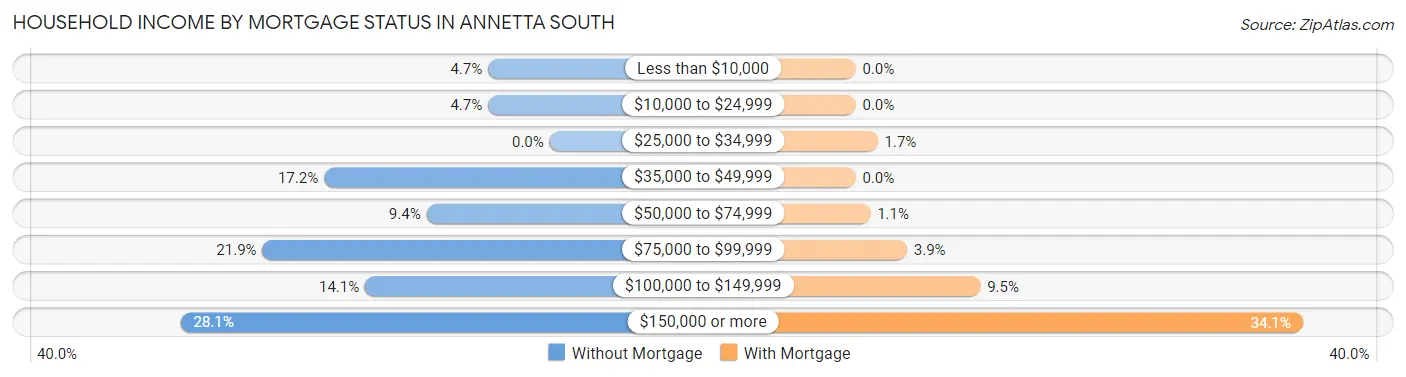
| Household Income | Without Mortgage | With Mortgage |
| Less than $10,000 | 3 (4.7%) | 0 (0.0%) |
| $10,000 to $24,999 | 3 (4.7%) | 0 (0.0%) |
| $25,000 to $34,999 | 0 (0.0%) | 3 (1.7%) |
| $35,000 to $49,999 | 11 (17.2%) | 0 (0.0%) |
| $50,000 to $74,999 | 6 (9.4%) | 2 (1.1%) |
| $75,000 to $99,999 | 14 (21.9%) | 7 (3.9%) |
| $100,000 to $149,999 | 9 (14.1%) | 17 (9.5%) |
| $150,000 or more | 18 (28.1%) | 61 (34.1%) |
| Total | 64 (100.0%) | 179 (100.0%) |
Property Value to Household Income Ratio in Annetta South
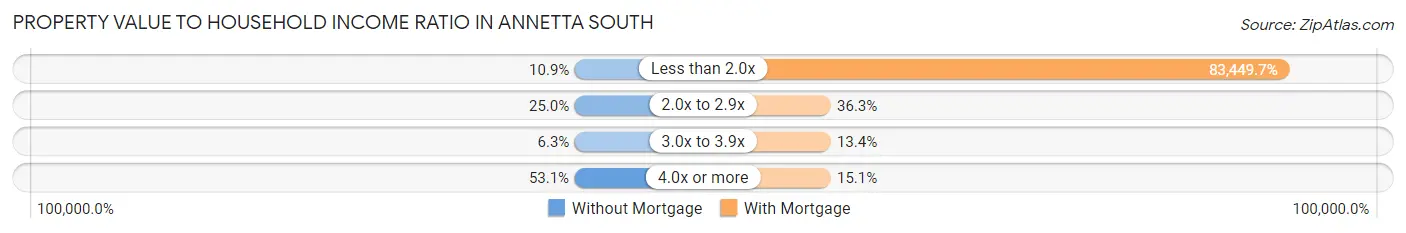
| Value-to-Income Ratio | Without Mortgage | With Mortgage |
| Less than 2.0x | 7 (10.9%) | 149,375 (83,449.7%) |
| 2.0x to 2.9x | 16 (25.0%) | 65 (36.3%) |
| 3.0x to 3.9x | 4 (6.2%) | 24 (13.4%) |
| 4.0x or more | 34 (53.1%) | 27 (15.1%) |
| Total | 64 (100.0%) | 179 (100.0%) |
Real Estate Taxes by Mortgage Status in Annetta South
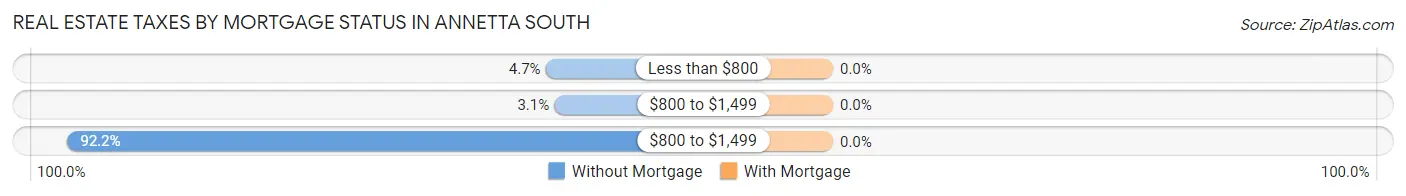
| Property Taxes | Without Mortgage | With Mortgage |
| Less than $800 | 3 (4.7%) | 0 (0.0%) |
| $800 to $1,499 | 2 (3.1%) | 0 (0.0%) |
| $800 to $1,499 | 59 (92.2%) | 0 (0.0%) |
| Total | 64 (100.0%) | 179 (100.0%) |
Health & Disability in Annetta South
Health Insurance Coverage by Age in Annetta South
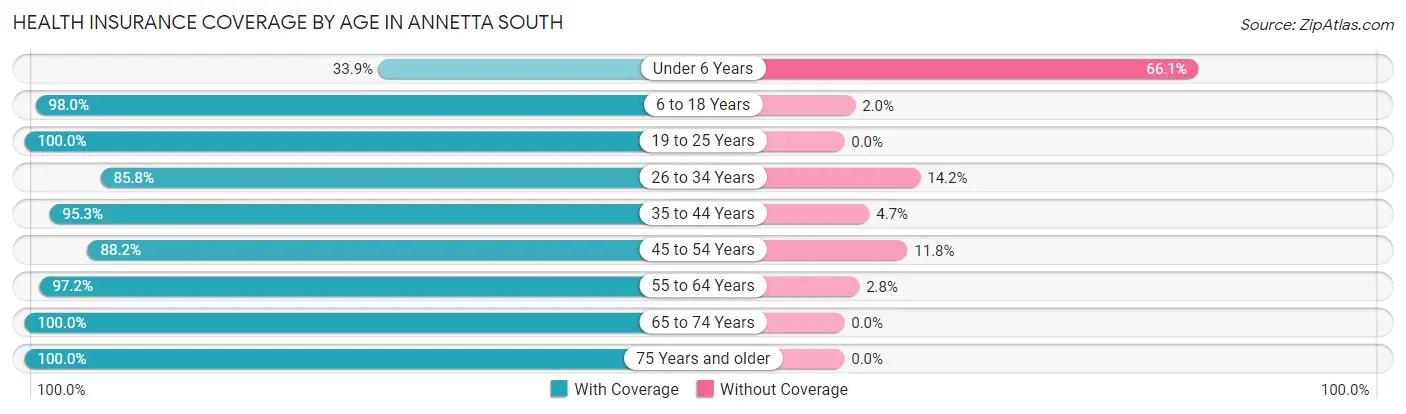
| Age Bracket | With Coverage | Without Coverage |
| Under 6 Years | 19 (33.9%) | 37 (66.1%) |
| 6 to 18 Years | 144 (98.0%) | 3 (2.0%) |
| 19 to 25 Years | 41 (100.0%) | 0 (0.0%) |
| 26 to 34 Years | 109 (85.8%) | 18 (14.2%) |
| 35 to 44 Years | 102 (95.3%) | 5 (4.7%) |
| 45 to 54 Years | 75 (88.2%) | 10 (11.8%) |
| 55 to 64 Years | 105 (97.2%) | 3 (2.8%) |
| 65 to 74 Years | 53 (100.0%) | 0 (0.0%) |
| 75 Years and older | 56 (100.0%) | 0 (0.0%) |
| Total | 704 (90.3%) | 76 (9.7%) |
Health Insurance Coverage by Citizenship Status in Annetta South
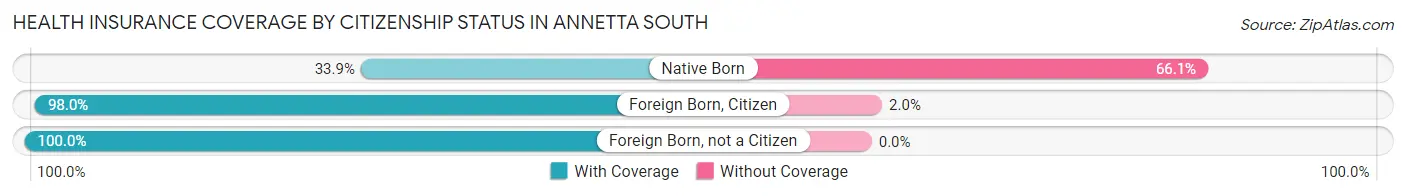
| Citizenship Status | With Coverage | Without Coverage |
| Native Born | 19 (33.9%) | 37 (66.1%) |
| Foreign Born, Citizen | 144 (98.0%) | 3 (2.0%) |
| Foreign Born, not a Citizen | 41 (100.0%) | 0 (0.0%) |
Health Insurance Coverage by Household Income in Annetta South
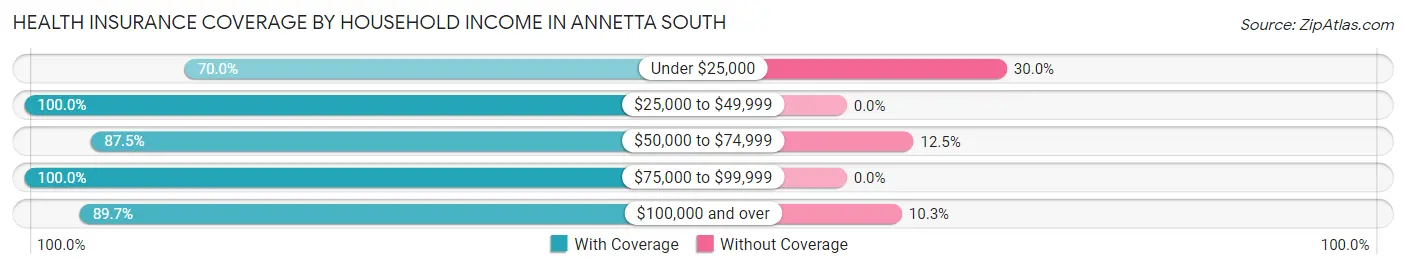
| Household Income | With Coverage | Without Coverage |
| Under $25,000 | 14 (70.0%) | 6 (30.0%) |
| $25,000 to $49,999 | 13 (100.0%) | 0 (0.0%) |
| $50,000 to $74,999 | 28 (87.5%) | 4 (12.5%) |
| $75,000 to $99,999 | 76 (100.0%) | 0 (0.0%) |
| $100,000 and over | 573 (89.7%) | 66 (10.3%) |
Public vs Private Health Insurance Coverage by Age in Annetta South
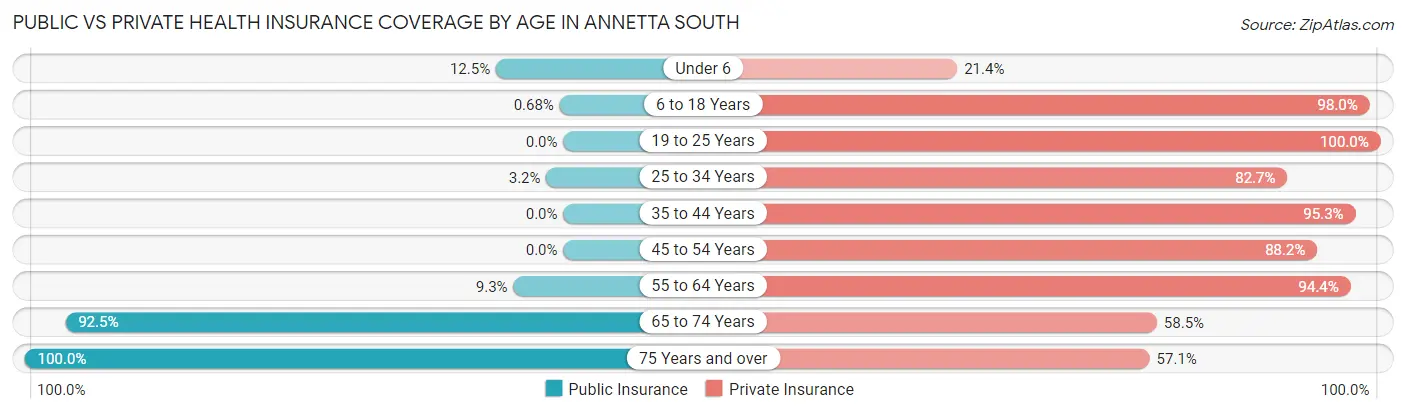
| Age Bracket | Public Insurance | Private Insurance |
| Under 6 | 7 (12.5%) | 12 (21.4%) |
| 6 to 18 Years | 1 (0.7%) | 144 (98.0%) |
| 19 to 25 Years | 0 (0.0%) | 41 (100.0%) |
| 25 to 34 Years | 4 (3.2%) | 105 (82.7%) |
| 35 to 44 Years | 0 (0.0%) | 102 (95.3%) |
| 45 to 54 Years | 0 (0.0%) | 75 (88.2%) |
| 55 to 64 Years | 10 (9.3%) | 102 (94.4%) |
| 65 to 74 Years | 49 (92.4%) | 31 (58.5%) |
| 75 Years and over | 56 (100.0%) | 32 (57.1%) |
| Total | 127 (16.3%) | 644 (82.6%) |
Disability Status by Sex by Age in Annetta South
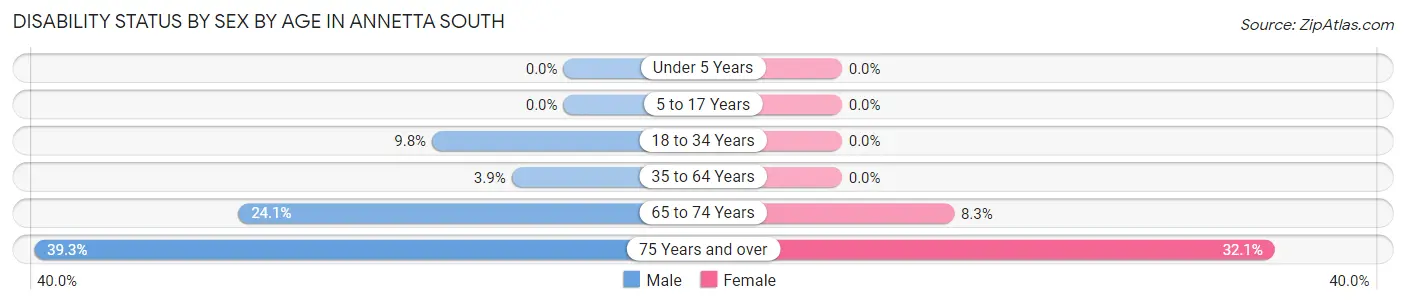
| Age Bracket | Male | Female |
| Under 5 Years | 0 (0.0%) | 0 (0.0%) |
| 5 to 17 Years | 0 (0.0%) | 0 (0.0%) |
| 18 to 34 Years | 8 (9.8%) | 0 (0.0%) |
| 35 to 64 Years | 6 (3.8%) | 0 (0.0%) |
| 65 to 74 Years | 7 (24.1%) | 2 (8.3%) |
| 75 Years and over | 11 (39.3%) | 9 (32.1%) |
Disability Class by Sex by Age in Annetta South
Disability Class: Hearing Difficulty
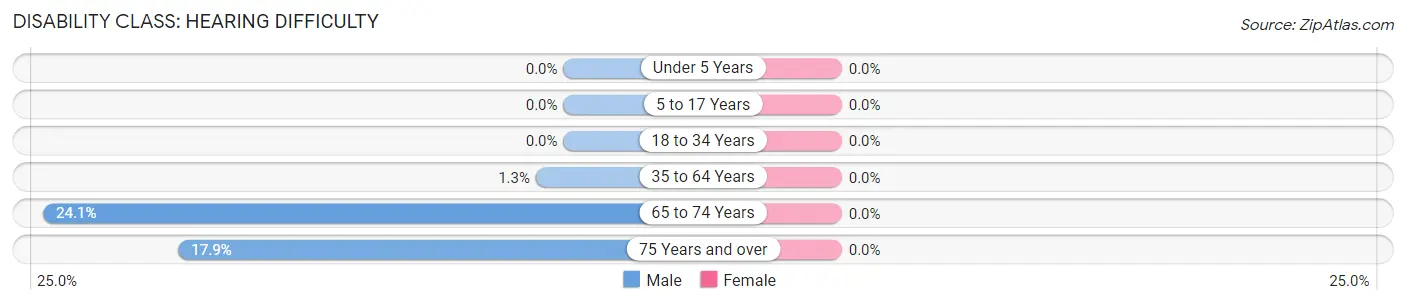
| Age Bracket | Male | Female |
| Under 5 Years | 0 (0.0%) | 0 (0.0%) |
| 5 to 17 Years | 0 (0.0%) | 0 (0.0%) |
| 18 to 34 Years | 0 (0.0%) | 0 (0.0%) |
| 35 to 64 Years | 2 (1.3%) | 0 (0.0%) |
| 65 to 74 Years | 7 (24.1%) | 0 (0.0%) |
| 75 Years and over | 5 (17.9%) | 0 (0.0%) |
Disability Class: Vision Difficulty
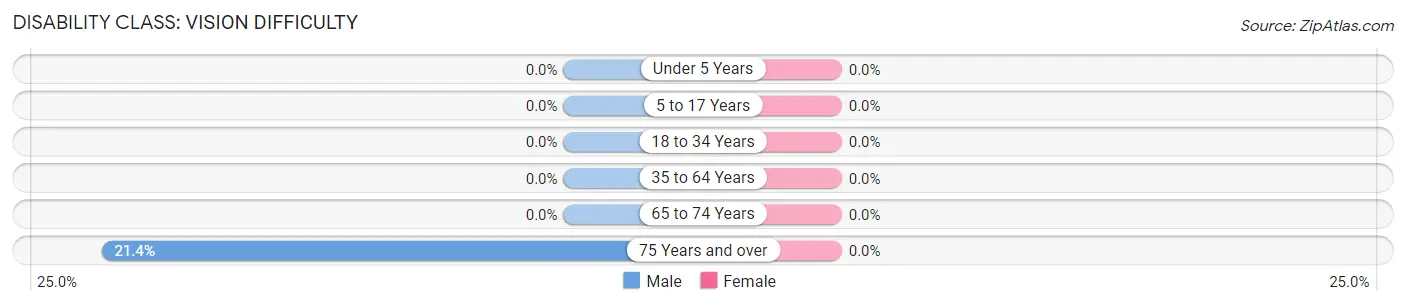
| Age Bracket | Male | Female |
| Under 5 Years | 0 (0.0%) | 0 (0.0%) |
| 5 to 17 Years | 0 (0.0%) | 0 (0.0%) |
| 18 to 34 Years | 0 (0.0%) | 0 (0.0%) |
| 35 to 64 Years | 0 (0.0%) | 0 (0.0%) |
| 65 to 74 Years | 0 (0.0%) | 0 (0.0%) |
| 75 Years and over | 6 (21.4%) | 0 (0.0%) |
Disability Class: Cognitive Difficulty
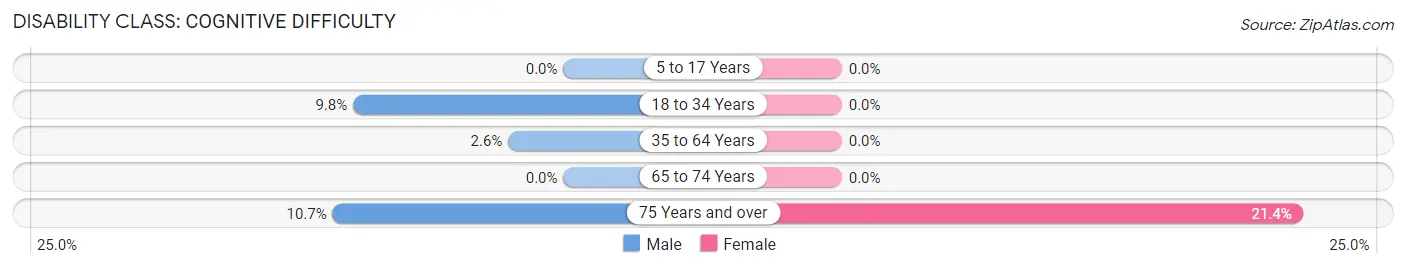
| Age Bracket | Male | Female |
| 5 to 17 Years | 0 (0.0%) | 0 (0.0%) |
| 18 to 34 Years | 8 (9.8%) | 0 (0.0%) |
| 35 to 64 Years | 4 (2.6%) | 0 (0.0%) |
| 65 to 74 Years | 0 (0.0%) | 0 (0.0%) |
| 75 Years and over | 3 (10.7%) | 6 (21.4%) |
Disability Class: Ambulatory Difficulty
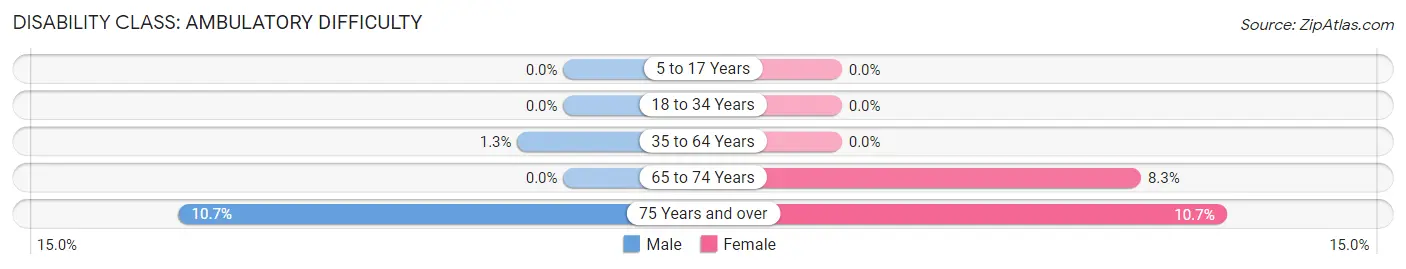
| Age Bracket | Male | Female |
| 5 to 17 Years | 0 (0.0%) | 0 (0.0%) |
| 18 to 34 Years | 0 (0.0%) | 0 (0.0%) |
| 35 to 64 Years | 2 (1.3%) | 0 (0.0%) |
| 65 to 74 Years | 0 (0.0%) | 2 (8.3%) |
| 75 Years and over | 3 (10.7%) | 3 (10.7%) |
Disability Class: Self-Care Difficulty
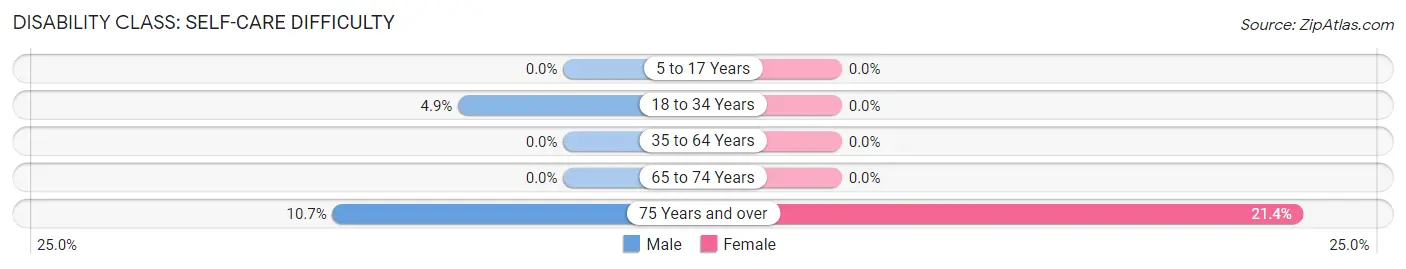
| Age Bracket | Male | Female |
| 5 to 17 Years | 0 (0.0%) | 0 (0.0%) |
| 18 to 34 Years | 4 (4.9%) | 0 (0.0%) |
| 35 to 64 Years | 0 (0.0%) | 0 (0.0%) |
| 65 to 74 Years | 0 (0.0%) | 0 (0.0%) |
| 75 Years and over | 3 (10.7%) | 6 (21.4%) |
Technology Access in Annetta South
Computing Device Access in Annetta South
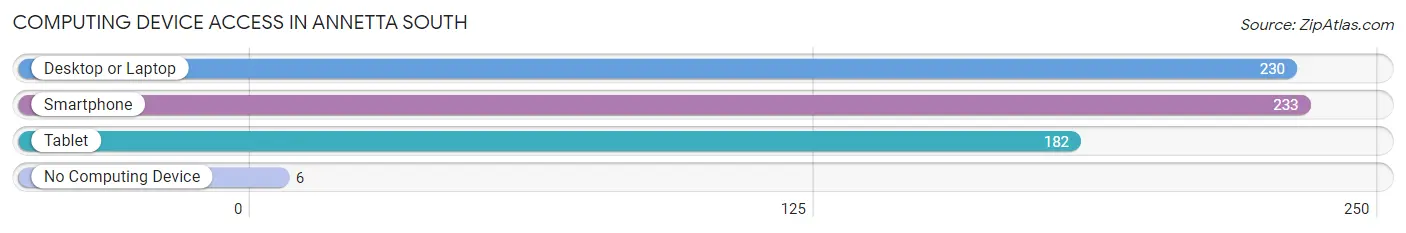
| Device Type | # Households | % Households |
| Desktop or Laptop | 230 | 92.7% |
| Smartphone | 233 | 94.0% |
| Tablet | 182 | 73.4% |
| No Computing Device | 6 | 2.4% |
| Total | 248 | 100.0% |
Internet Access in Annetta South
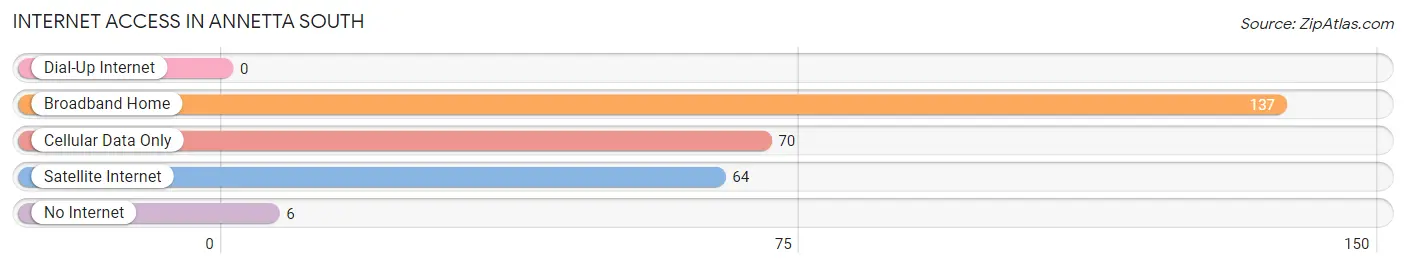
| Internet Type | # Households | % Households |
| Dial-Up Internet | 0 | 0.0% |
| Broadband Home | 137 | 55.2% |
| Cellular Data Only | 70 | 28.2% |
| Satellite Internet | 64 | 25.8% |
| No Internet | 6 | 2.4% |
| Total | 248 | 100.0% |
Annetta South Summary
Anetta South, Texas is a small town located in the southeastern corner of Texas, near the border of Louisiana. It is part of the Beaumont-Port Arthur metropolitan area and is situated in Jefferson County. The town has a population of just over 1,000 people and is known for its rural charm and friendly atmosphere.
Geography
Anetta South is located in the southeastern corner of Texas, near the border of Louisiana. It is situated in Jefferson County, and is part of the Beaumont-Port Arthur metropolitan area. The town is located on the banks of the Neches River, and is surrounded by lush forests and wetlands. The town is located at an elevation of about 30 feet above sea level.
The climate in Anetta South is humid subtropical, with hot summers and mild winters. The average annual temperature is around 70 degrees Fahrenheit, with temperatures reaching as high as 95 degrees in the summer and as low as 40 degrees in the winter. The town receives an average of about 50 inches of rain per year.
Economy
Anetta South is a small, rural town, and its economy is largely based on agriculture. The town is home to several farms, which produce a variety of crops, including corn, soybeans, cotton, and hay. The town also has a few small businesses, including a grocery store, a hardware store, and a few restaurants.
Demographics
As of the 2010 census, Anetta South had a population of 1,072 people. The racial makeup of the town was 94.3% White, 2.2% African American, 0.7% Native American, 0.3% Asian, and 2.5% from other races. The median household income was $37,500, and the median age was 37.
History
Anetta South was founded in 1845 by a group of settlers from Louisiana. The town was originally called “Anetta”, after the wife of one of the settlers. The town was later renamed “Anetta South” to distinguish it from another town in the area called “Anetta North”.
The town grew slowly over the years, and by the early 1900s, it had become a thriving agricultural community. The town was home to several farms, which produced a variety of crops, including corn, soybeans, cotton, and hay.
In the late 20th century, the town began to decline as many of its residents moved away in search of better economic opportunities. However, in recent years, the town has seen a resurgence in population, as people have moved back to the area in search of a more rural lifestyle.
Conclusion
Anetta South, Texas is a small, rural town located in the southeastern corner of Texas, near the border of Louisiana. It is part of the Beaumont-Port Arthur metropolitan area and is situated in Jefferson County. The town has a population of just over 1,000 people and is known for its rural charm and friendly atmosphere. The town’s economy is largely based on agriculture, and it is home to several farms, which produce a variety of crops. The town has seen a resurgence in population in recent years, as people have moved back to the area in search of a more rural lifestyle.
Common Questions
What is the Total Population of Annetta South?
Total Population of Annetta South is 780.
What is the Total Male Population of Annetta South?
Total Male Population of Annetta South is 417.
What is the Total Female Population of Annetta South?
Total Female Population of Annetta South is 363.
What is the Ratio of Males per 100 Females in Annetta South?
There are 114.88 Males per 100 Females in Annetta South.
What is the Ratio of Females per 100 Males in Annetta South?
There are 87.05 Females per 100 Males in Annetta South.
What is the Median Population Age in Annetta South?
Median Population Age in Annetta South is 39.3 Years.
What is the Average Family Size in Annetta South
Average Family Size in Annetta South is 3.5 People.
What is the Average Household Size in Annetta South
Average Household Size in Annetta South is 3.1 People.
What is Per Capita Income in Annetta South?
Per Capita income in Annetta South is $54,112.
What is the Median Family Income in Annetta South?
Median Family Income in Annetta South is $148,750.
What is the Median Household income in Annetta South?
Median Household Income in Annetta South is $131,667.
What is Income or Wage Gap in Annetta South?
Income or Wage Gap in Annetta South is 32.5%.
Women in Annetta South earn 67.5 cents for every dollar earned by a man.
What is Inequality or Gini Index in Annetta South?
Inequality or Gini Index in Annetta South is 0.33.
How Large is the Labor Force in Annetta South?
There are 390 People in the Labor Forcein in Annetta South.
What is the Percentage of People in the Labor Force in Annetta South?
64.4% of People are in the Labor Force in Annetta South.
What is the Unemployment Rate in Annetta South?
Unemployment Rate in Annetta South is 3.1%.