Murphy, TX
Murphy Map
Murphy Overview
20,880
TOTAL POPULATION
10,385
MALE POPULATION
10,495
FEMALE POPULATION
98.95
MALES / 100 FEMALES
101.06
FEMALES / 100 MALES
39.3
MEDIAN AGE
3.8
AVG FAMILY SIZE
3.6
AVG HOUSEHOLD SIZE
$46,829
PER CAPITA INCOME
$158,791
AVG FAMILY INCOME
$152,847
AVG HOUSEHOLD INCOME
66.0%
WAGE / INCOME GAP [ % ]
34.0¢/ $1
WAGE / INCOME GAP [ $ ]
$7,497
FAMILY INCOME DEFICIT
0.34
INEQUALITY / GINI INDEX
10,215
LABOR FORCE [ PEOPLE ]
67.6%
PERCENT IN LABOR FORCE
5.2%
UNEMPLOYMENT RATE
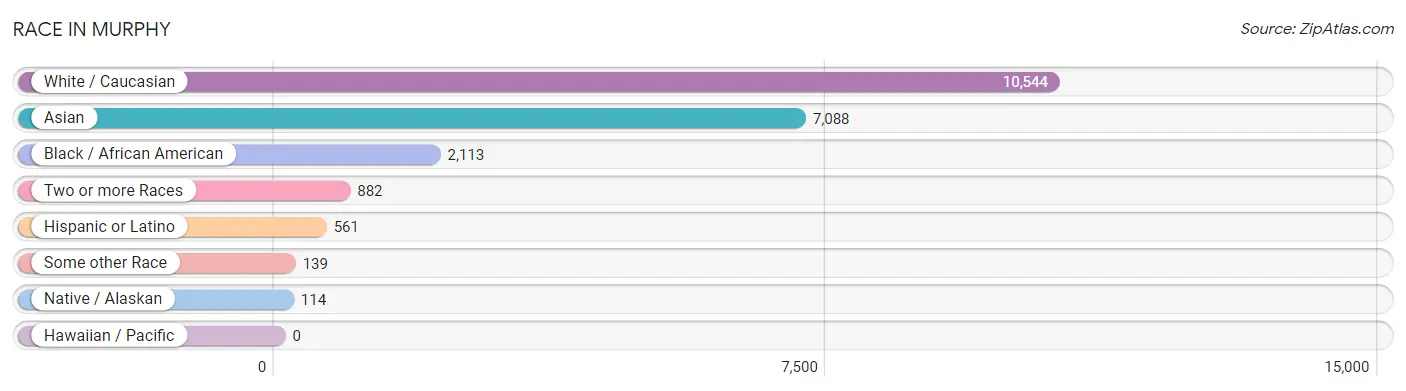
Race in Murphy
The most populous races in Murphy are White / Caucasian (10,544 | 50.5%), Asian (7,088 | 34.0%), and Black / African American (2,113 | 10.1%).
| Race | # Population | % Population |
| Asian | 7,088 | 34.0% |
| Black / African American | 2,113 | 10.1% |
| Hawaiian / Pacific | 0 | 0.0% |
| Hispanic or Latino | 561 | 2.7% |
| Native / Alaskan | 114 | 0.5% |
| White / Caucasian | 10,544 | 50.5% |
| Two or more Races | 882 | 4.2% |
| Some other Race | 139 | 0.7% |
| Total | 20,880 | 100.0% |
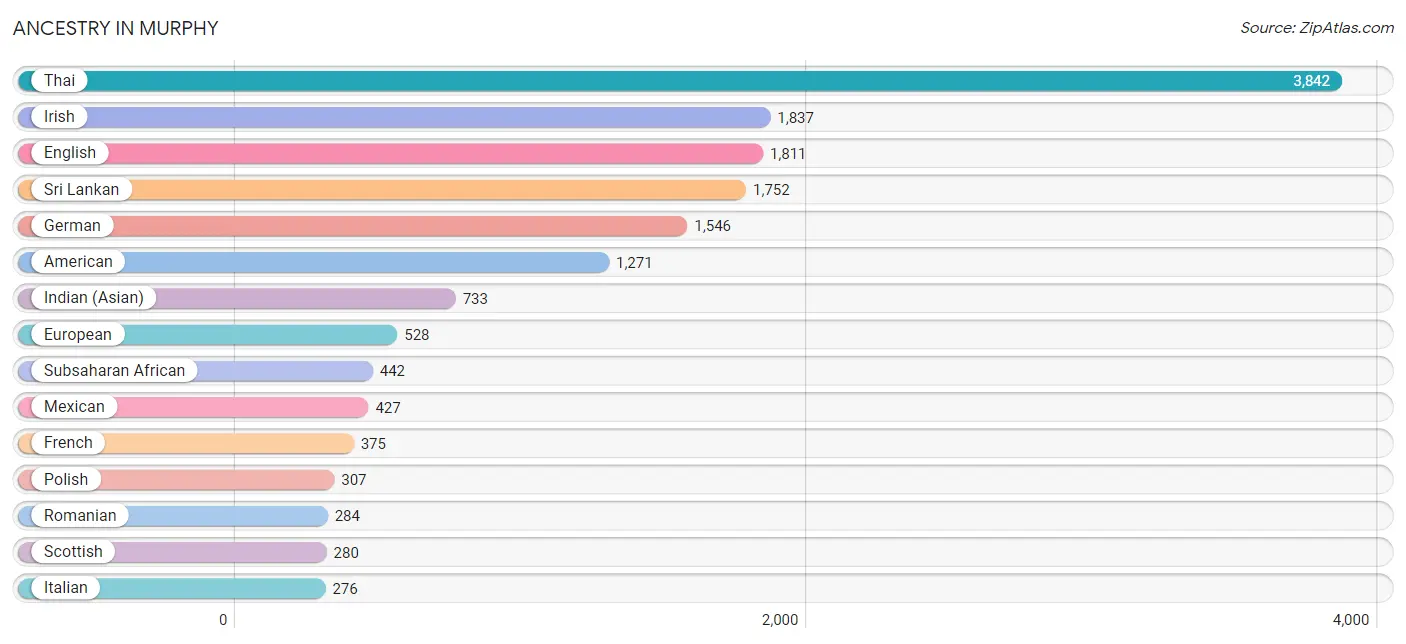
Ancestry in Murphy
The most populous ancestries reported in Murphy are Thai (3,842 | 18.4%), Irish (1,837 | 8.8%), English (1,811 | 8.7%), Sri Lankan (1,752 | 8.4%), and German (1,546 | 7.4%), together accounting for 51.7% of all Murphy residents.
| Ancestry | # Population | % Population |
| African | 250 | 1.2% |
| Aleut | 27 | 0.1% |
| American | 1,271 | 6.1% |
| Arab | 220 | 1.1% |
| Austrian | 33 | 0.2% |
| Bangladeshi | 45 | 0.2% |
| British | 81 | 0.4% |
| Burmese | 52 | 0.3% |
| Canadian | 23 | 0.1% |
| Central American | 15 | 0.1% |
| Cherokee | 112 | 0.5% |
| Colombian | 11 | 0.1% |
| Comanche | 14 | 0.1% |
| Croatian | 25 | 0.1% |
| Czech | 227 | 1.1% |
| Czechoslovakian | 37 | 0.2% |
| Danish | 55 | 0.3% |
| Dutch | 174 | 0.8% |
| Eastern European | 50 | 0.2% |
| Egyptian | 18 | 0.1% |
| English | 1,811 | 8.7% |
| Ethiopian | 152 | 0.7% |
| European | 528 | 2.5% |
| Filipino | 152 | 0.7% |
| French | 375 | 1.8% |
| French Canadian | 48 | 0.2% |
| German | 1,546 | 7.4% |
| Greek | 87 | 0.4% |
| Honduran | 6 | 0.0% |
| Hungarian | 8 | 0.0% |
| Indian (Asian) | 733 | 3.5% |
| Iranian | 275 | 1.3% |
| Irish | 1,837 | 8.8% |
| Italian | 276 | 1.3% |
| Jamaican | 28 | 0.1% |
| Japanese | 77 | 0.4% |
| Korean | 79 | 0.4% |
| Lebanese | 127 | 0.6% |
| Lithuanian | 22 | 0.1% |
| Mexican | 427 | 2.1% |
| Nigerian | 74 | 0.4% |
| Norwegian | 142 | 0.7% |
| Pakistani | 28 | 0.1% |
| Polish | 307 | 1.5% |
| Portuguese | 73 | 0.4% |
| Puerto Rican | 24 | 0.1% |
| Romanian | 284 | 1.4% |
| Russian | 75 | 0.4% |
| Salvadoran | 9 | 0.0% |
| Scandinavian | 13 | 0.1% |
| Scotch-Irish | 101 | 0.5% |
| Scottish | 280 | 1.3% |
| South American | 36 | 0.2% |
| Sri Lankan | 1,752 | 8.4% |
| Subsaharan African | 442 | 2.1% |
| Swedish | 108 | 0.5% |
| Swiss | 20 | 0.1% |
| Syrian | 37 | 0.2% |
| Thai | 3,842 | 18.4% |
| Ukrainian | 141 | 0.7% |
| Uruguayan | 25 | 0.1% |
| Welsh | 240 | 1.1% |
| West Indian | 4 | 0.0% | View All 63 Rows |
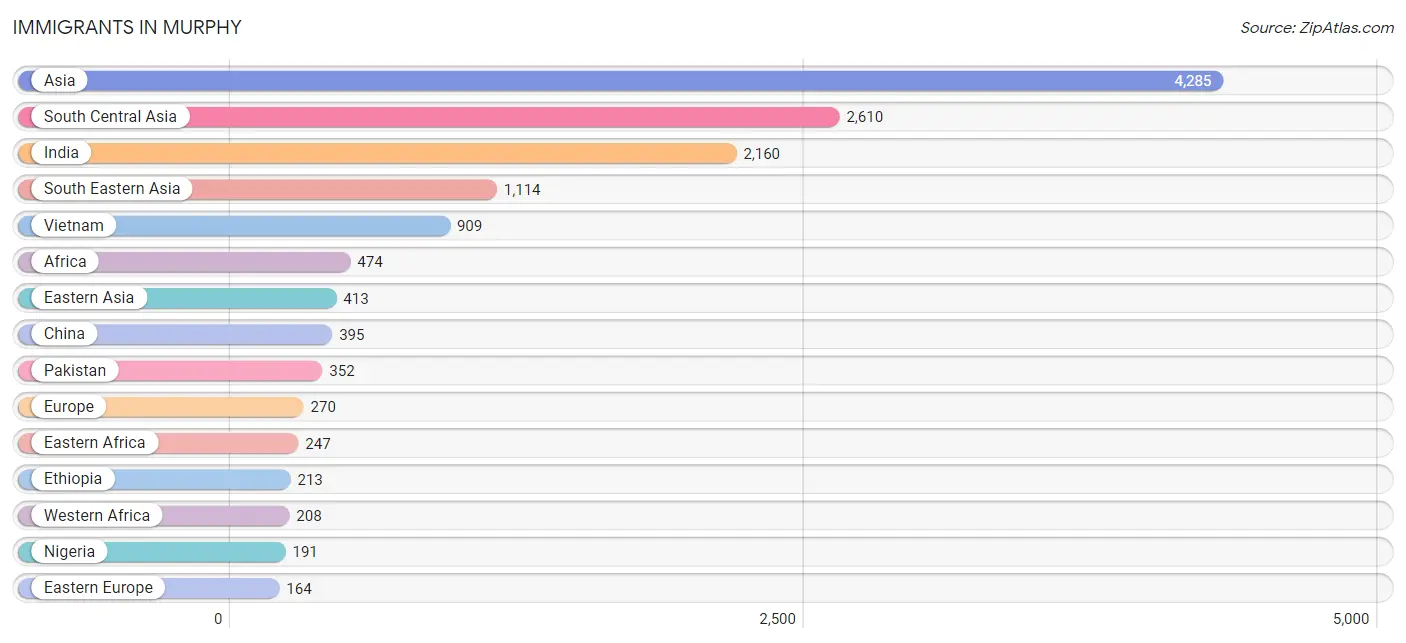
Immigrants in Murphy
The most numerous immigrant groups reported in Murphy came from Asia (4,285 | 20.5%), South Central Asia (2,610 | 12.5%), India (2,160 | 10.3%), South Eastern Asia (1,114 | 5.3%), and Vietnam (909 | 4.3%), together accounting for 53.0% of all Murphy residents.
| Immigration Origin | # Population | % Population |
| Africa | 474 | 2.3% |
| Asia | 4,285 | 20.5% |
| Austria | 50 | 0.2% |
| Cambodia | 52 | 0.3% |
| Canada | 98 | 0.5% |
| Caribbean | 11 | 0.1% |
| Central America | 37 | 0.2% |
| China | 395 | 1.9% |
| Czechoslovakia | 15 | 0.1% |
| Denmark | 22 | 0.1% |
| Eastern Africa | 247 | 1.2% |
| Eastern Asia | 413 | 2.0% |
| Eastern Europe | 164 | 0.8% |
| El Salvador | 9 | 0.0% |
| England | 14 | 0.1% |
| Eritrea | 34 | 0.2% |
| Ethiopia | 213 | 1.0% |
| Europe | 270 | 1.3% |
| Honduras | 6 | 0.0% |
| Hong Kong | 56 | 0.3% |
| India | 2,160 | 10.3% |
| Indonesia | 11 | 0.1% |
| Iran | 98 | 0.5% |
| Jamaica | 11 | 0.1% |
| Korea | 18 | 0.1% |
| Latin America | 48 | 0.2% |
| Latvia | 24 | 0.1% |
| Lebanon | 43 | 0.2% |
| Malaysia | 12 | 0.1% |
| Mexico | 22 | 0.1% |
| Morocco | 10 | 0.1% |
| Nigeria | 191 | 0.9% |
| Northern Africa | 10 | 0.1% |
| Northern Europe | 36 | 0.2% |
| Pakistan | 352 | 1.7% |
| Philippines | 56 | 0.3% |
| Romania | 8 | 0.0% |
| Russia | 44 | 0.2% |
| South Africa | 9 | 0.0% |
| South Central Asia | 2,610 | 12.5% |
| South Eastern Asia | 1,114 | 5.3% |
| Switzerland | 20 | 0.1% |
| Taiwan | 70 | 0.3% |
| Thailand | 74 | 0.4% |
| Ukraine | 73 | 0.4% |
| Vietnam | 909 | 4.3% |
| Western Africa | 208 | 1.0% |
| Western Asia | 124 | 0.6% |
| Western Europe | 70 | 0.3% | View All 49 Rows |
Sex and Age in Murphy
Sex and Age in Murphy
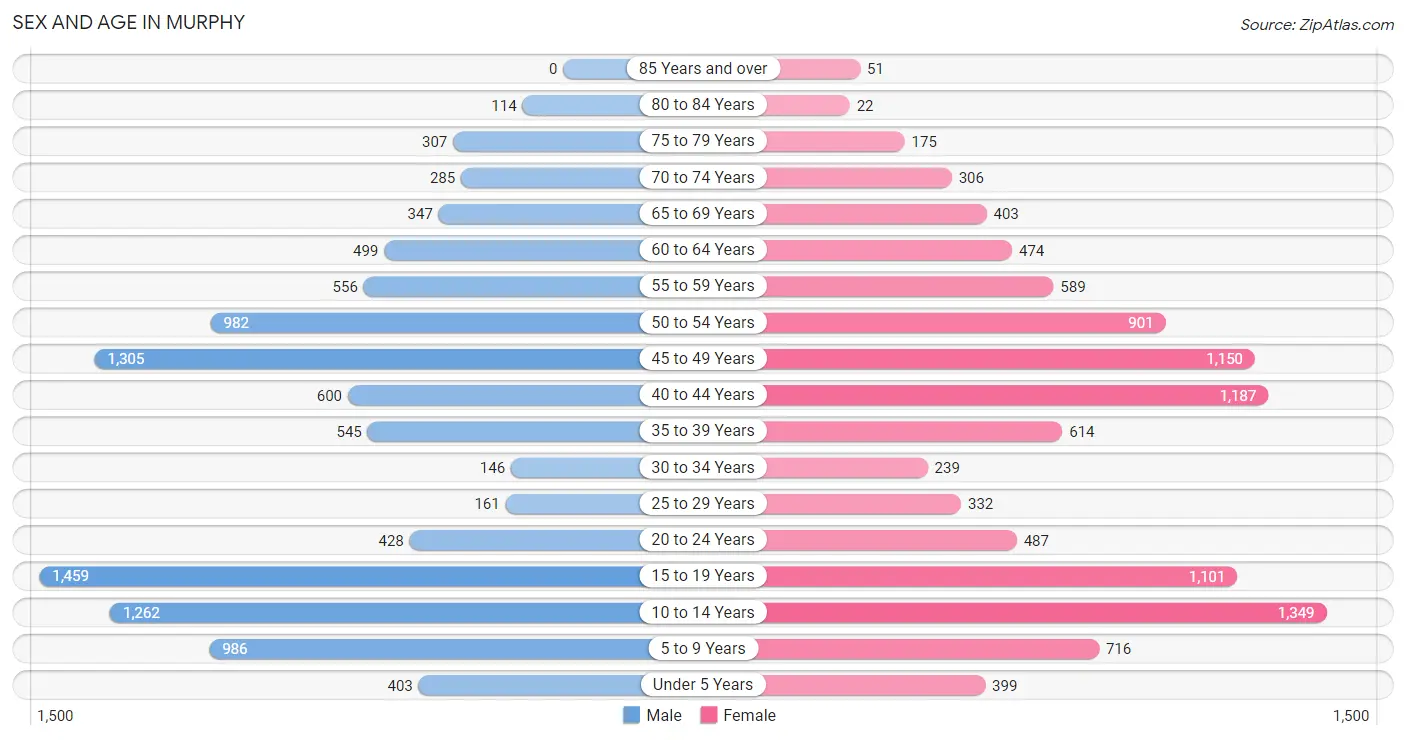
The most populous age groups in Murphy are 15 to 19 Years (1,459 | 14.1%) for men and 10 to 14 Years (1,349 | 12.9%) for women.
| Age Bracket | Male | Female |
| Under 5 Years | 403 (3.9%) | 399 (3.8%) |
| 5 to 9 Years | 986 (9.5%) | 716 (6.8%) |
| 10 to 14 Years | 1,262 (12.1%) | 1,349 (12.9%) |
| 15 to 19 Years | 1,459 (14.1%) | 1,101 (10.5%) |
| 20 to 24 Years | 428 (4.1%) | 487 (4.6%) |
| 25 to 29 Years | 161 (1.5%) | 332 (3.2%) |
| 30 to 34 Years | 146 (1.4%) | 239 (2.3%) |
| 35 to 39 Years | 545 (5.2%) | 614 (5.9%) |
| 40 to 44 Years | 600 (5.8%) | 1,187 (11.3%) |
| 45 to 49 Years | 1,305 (12.6%) | 1,150 (11.0%) |
| 50 to 54 Years | 982 (9.5%) | 901 (8.6%) |
| 55 to 59 Years | 556 (5.3%) | 589 (5.6%) |
| 60 to 64 Years | 499 (4.8%) | 474 (4.5%) |
| 65 to 69 Years | 347 (3.3%) | 403 (3.8%) |
| 70 to 74 Years | 285 (2.7%) | 306 (2.9%) |
| 75 to 79 Years | 307 (3.0%) | 175 (1.7%) |
| 80 to 84 Years | 114 (1.1%) | 22 (0.2%) |
| 85 Years and over | 0 (0.0%) | 51 (0.5%) |
| Total | 10,385 (100.0%) | 10,495 (100.0%) |
Families and Households in Murphy
Median Family Size in Murphy
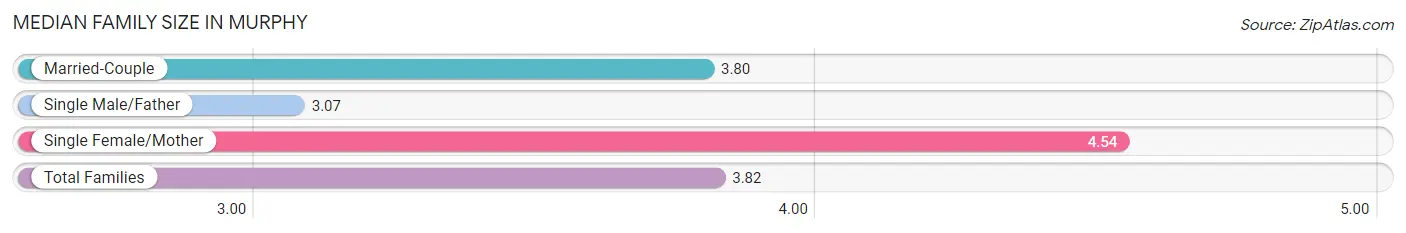
The median family size in Murphy is 3.82 persons per family, with single female/mother families (426 | 8.1%) accounting for the largest median family size of 4.54 persons per family. On the other hand, single male/father families (259 | 4.9%) represent the smallest median family size with 3.07 persons per family.
| Family Type | # Families | Family Size |
| Married-Couple | 4,572 (87.0%) | 3.80 |
| Single Male/Father | 259 (4.9%) | 3.07 |
| Single Female/Mother | 426 (8.1%) | 4.54 |
| Total Families | 5,257 (100.0%) | 3.82 |
Median Household Size in Murphy
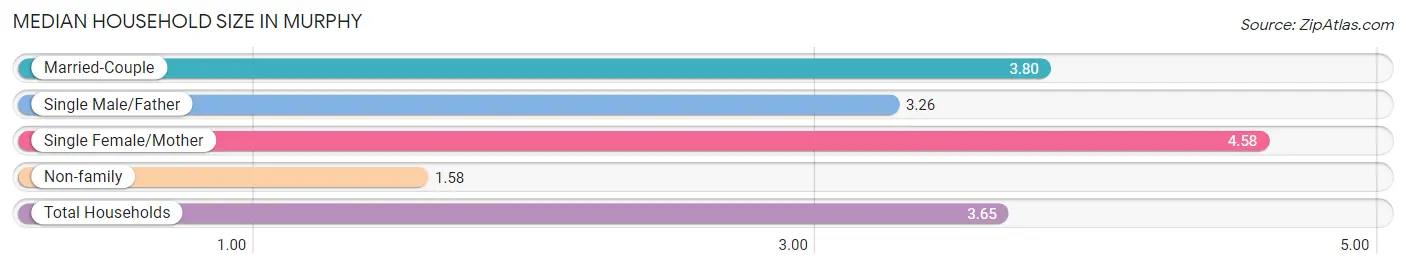
The median household size in Murphy is 3.65 persons per household, with single female/mother households (426 | 7.4%) accounting for the largest median household size of 4.58 persons per household. non-family households (466 | 8.1%) represent the smallest median household size with 1.58 persons per household.
| Household Type | # Households | Household Size |
| Married-Couple | 4,572 (79.9%) | 3.80 |
| Single Male/Father | 259 (4.5%) | 3.26 |
| Single Female/Mother | 426 (7.4%) | 4.58 |
| Non-family | 466 (8.1%) | 1.58 |
| Total Households | 5,723 (100.0%) | 3.65 |
Household Size by Marriage Status in Murphy
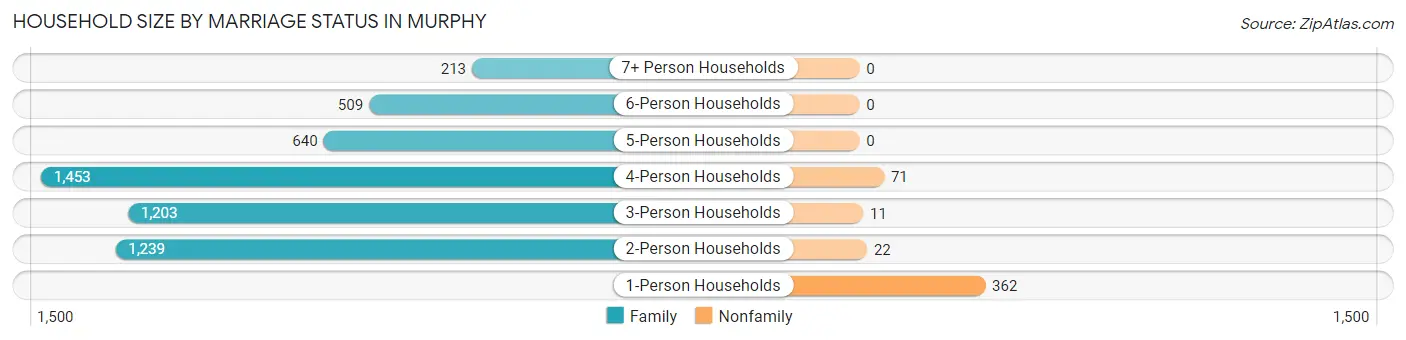
Out of a total of 5,723 households in Murphy, 5,257 (91.9%) are family households, while 466 (8.1%) are nonfamily households. The most numerous type of family households are 4-person households, comprising 1,453, and the most common type of nonfamily households are 1-person households, comprising 362.
| Household Size | Family Households | Nonfamily Households |
| 1-Person Households | - | 362 (6.3%) |
| 2-Person Households | 1,239 (21.6%) | 22 (0.4%) |
| 3-Person Households | 1,203 (21.0%) | 11 (0.2%) |
| 4-Person Households | 1,453 (25.4%) | 71 (1.2%) |
| 5-Person Households | 640 (11.2%) | 0 (0.0%) |
| 6-Person Households | 509 (8.9%) | 0 (0.0%) |
| 7+ Person Households | 213 (3.7%) | 0 (0.0%) |
| Total | 5,257 (91.9%) | 466 (8.1%) |
Female Fertility in Murphy
Fertility by Age in Murphy
Average fertility rate in Murphy is 26.0 births per 1,000 women. Women in the age bracket of 20 to 34 years have the highest fertility rate with 55.0 births per 1,000 women. Women in the age bracket of 35 to 50 years acount for 57.7% of all women with births.
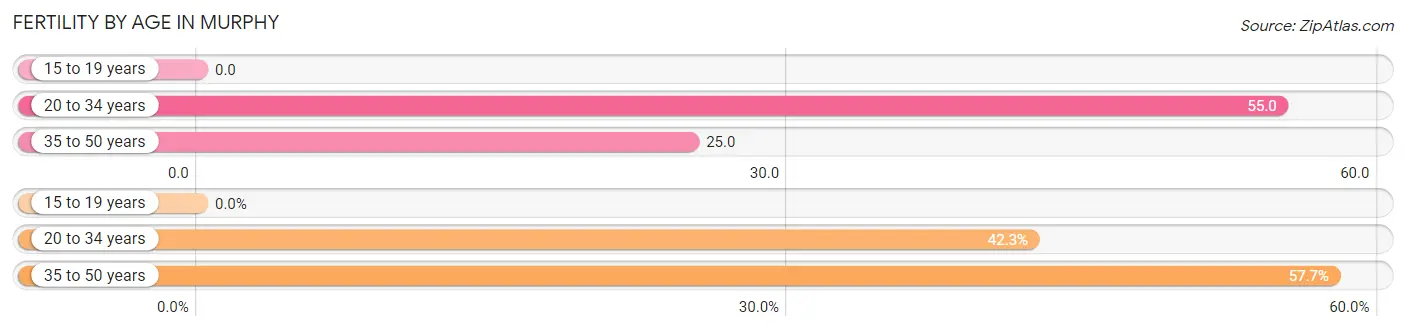
| Age Bracket | Women with Births | Births / 1,000 Women |
| 15 to 19 years | 0 (0.0%) | 0.0 |
| 20 to 34 years | 58 (42.3%) | 55.0 |
| 35 to 50 years | 79 (57.7%) | 25.0 |
| Total | 137 (100.0%) | 26.0 |
Fertility by Age by Marriage Status in Murphy
92.7% of women with births (137) in Murphy are married. The highest percentage of unmarried women with births falls into 35 to 50 years age bracket with 12.7% of them unmarried at the time of birth, while the lowest percentage of unmarried women with births belong to 20 to 34 years age bracket with 0.0% of them unmarried.
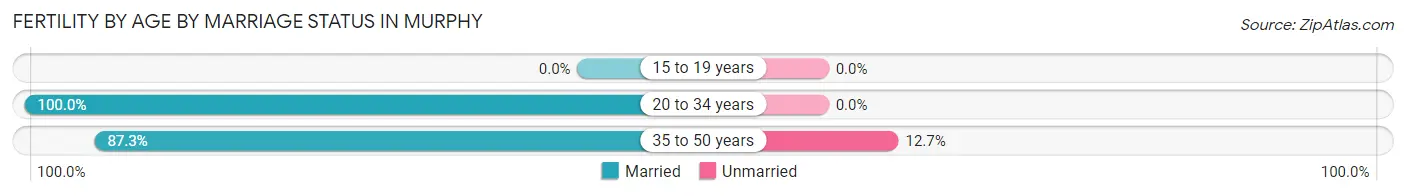
| Age Bracket | Married | Unmarried |
| 15 to 19 years | 0 (0.0%) | 0 (0.0%) |
| 20 to 34 years | 58 (100.0%) | 0 (0.0%) |
| 35 to 50 years | 69 (87.3%) | 10 (12.7%) |
| Total | 127 (92.7%) | 10 (7.3%) |
Fertility by Education in Murphy
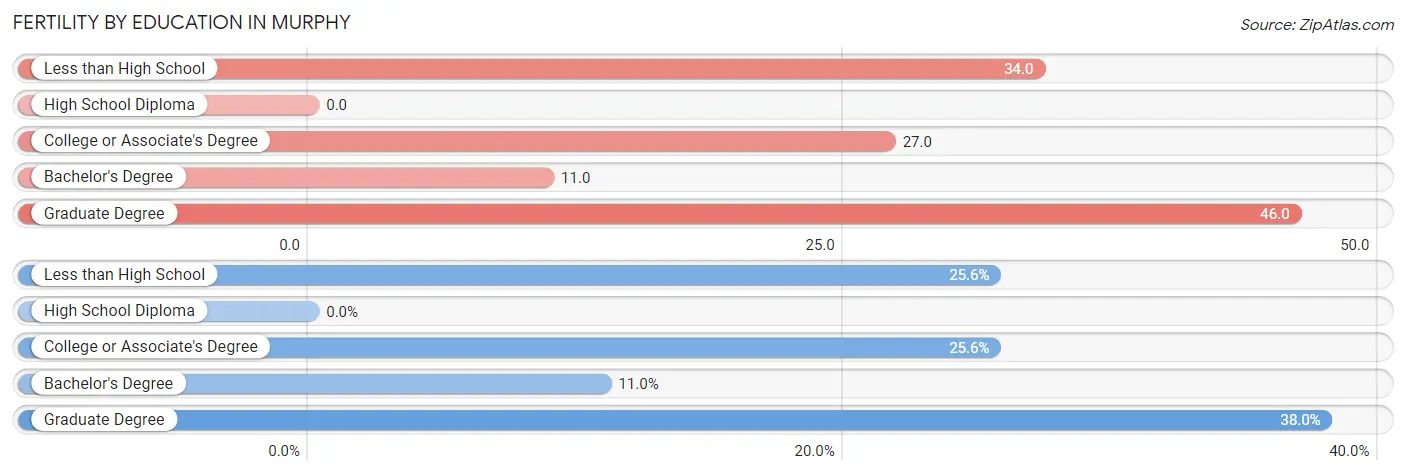
| Educational Attainment | Women with Births | Births / 1,000 Women |
| Less than High School | 35 (25.6%) | 34.0 |
| High School Diploma | 0 (0.0%) | 0.0 |
| College or Associate's Degree | 35 (25.6%) | 27.0 |
| Bachelor's Degree | 15 (11.0%) | 11.0 |
| Graduate Degree | 52 (38.0%) | 46.0 |
| Total | 137 (100.0%) | 26.0 |
Fertility by Education by Marriage Status in Murphy
7.3% of women with births in Murphy are unmarried. Women with the educational attainment of less than high school are most likely to be married with 100.0% of them married at childbirth, while women with the educational attainment of graduate degree are least likely to be married with 19.2% of them unmarried at childbirth.
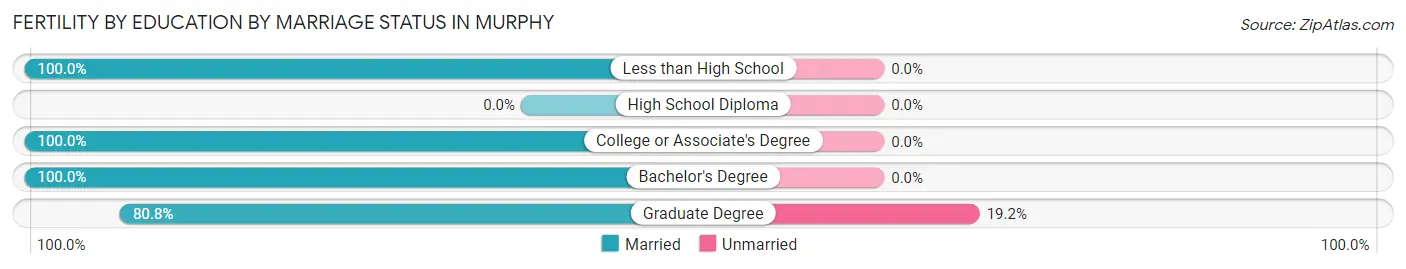
| Educational Attainment | Married | Unmarried |
| Less than High School | 35 (100.0%) | 0 (0.0%) |
| High School Diploma | 0 (0.0%) | 0 (0.0%) |
| College or Associate's Degree | 35 (100.0%) | 0 (0.0%) |
| Bachelor's Degree | 15 (100.0%) | 0 (0.0%) |
| Graduate Degree | 42 (80.8%) | 10 (19.2%) |
| Total | 127 (92.7%) | 10 (7.3%) |
Income in Murphy
Income Overview in Murphy
Per Capita Income in Murphy is $46,829, while median incomes of families and households are $158,791 and $152,847 respectively.
| Characteristic | Number | Measure |
| Per Capita Income | 20,880 | $46,829 |
| Median Family Income | 5,257 | $158,791 |
| Mean Family Income | 5,257 | $174,291 |
| Median Household Income | 5,723 | $152,847 |
| Mean Household Income | 5,723 | $169,040 |
| Income Deficit | 5,257 | $7,497 |
| Wage / Income Gap (%) | 20,880 | 66.03% |
| Wage / Income Gap ($) | 20,880 | 33.97¢ per $1 |
| Gini / Inequality Index | 20,880 | 0.34 |
Earnings by Sex in Murphy
Average Earnings in Murphy are $60,414, $100,398 for men and $34,105 for women, a difference of 66.0%.
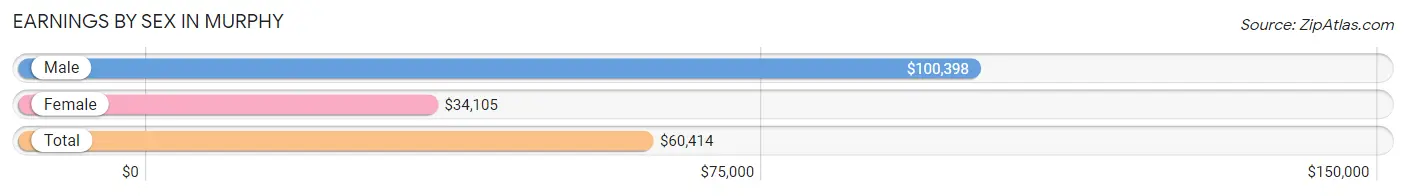
| Sex | Number | Average Earnings |
| Male | 5,559 (51.9%) | $100,398 |
| Female | 5,143 (48.1%) | $34,105 |
| Total | 10,702 (100.0%) | $60,414 |
Earnings by Sex by Income Bracket in Murphy
The most common earnings brackets in Murphy are $100,000+ for men (2,797 | 50.3%) and $100,000+ for women (1,030 | 20.0%).
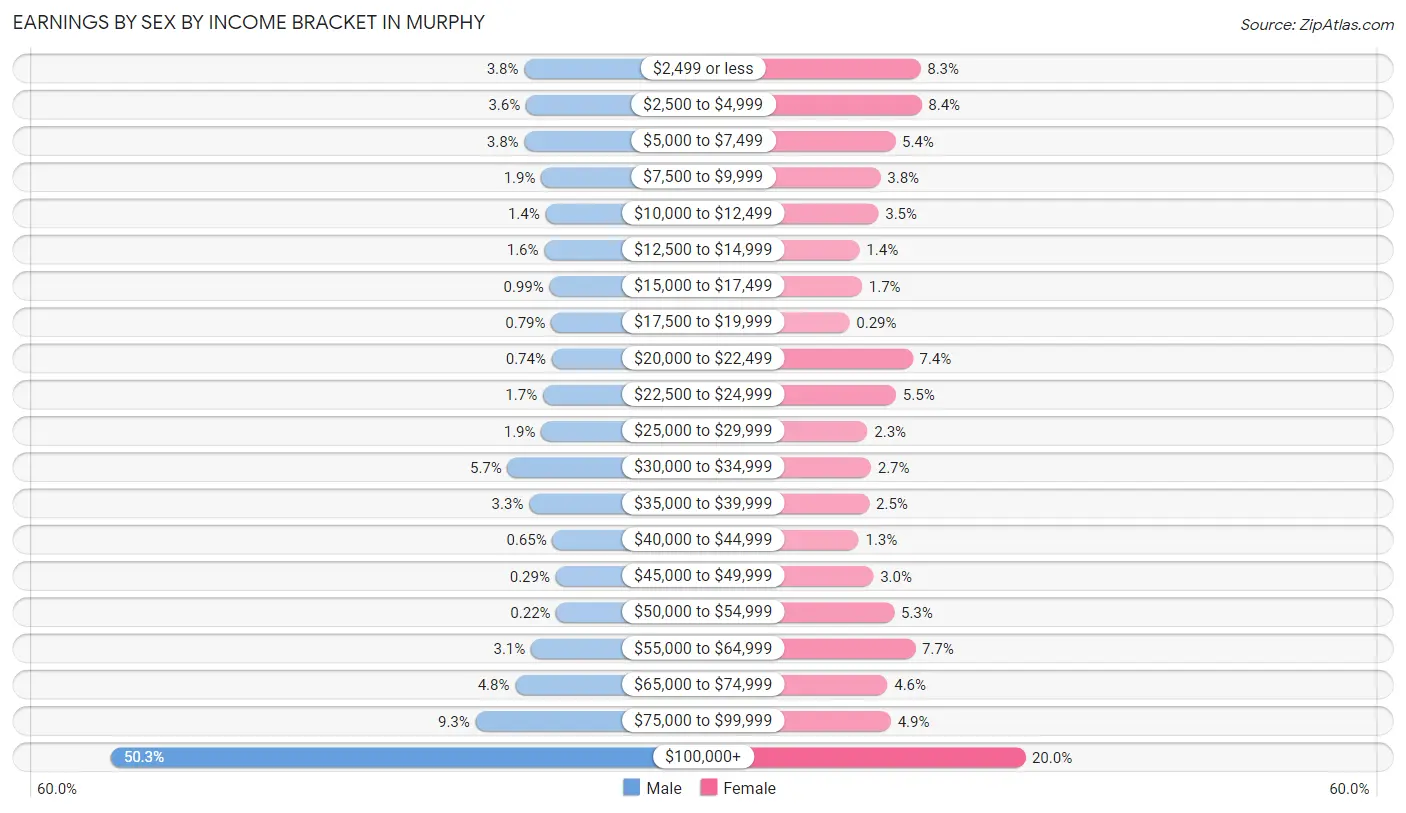
| Income | Male | Female |
| $2,499 or less | 213 (3.8%) | 425 (8.3%) |
| $2,500 to $4,999 | 202 (3.6%) | 431 (8.4%) |
| $5,000 to $7,499 | 212 (3.8%) | 279 (5.4%) |
| $7,500 to $9,999 | 107 (1.9%) | 194 (3.8%) |
| $10,000 to $12,499 | 80 (1.4%) | 182 (3.5%) |
| $12,500 to $14,999 | 87 (1.6%) | 73 (1.4%) |
| $15,000 to $17,499 | 55 (1.0%) | 87 (1.7%) |
| $17,500 to $19,999 | 44 (0.8%) | 15 (0.3%) |
| $20,000 to $22,499 | 41 (0.7%) | 380 (7.4%) |
| $22,500 to $24,999 | 96 (1.7%) | 284 (5.5%) |
| $25,000 to $29,999 | 106 (1.9%) | 119 (2.3%) |
| $30,000 to $34,999 | 317 (5.7%) | 139 (2.7%) |
| $35,000 to $39,999 | 182 (3.3%) | 129 (2.5%) |
| $40,000 to $44,999 | 36 (0.6%) | 68 (1.3%) |
| $45,000 to $49,999 | 16 (0.3%) | 153 (3.0%) |
| $50,000 to $54,999 | 12 (0.2%) | 273 (5.3%) |
| $55,000 to $64,999 | 170 (3.1%) | 394 (7.7%) |
| $65,000 to $74,999 | 269 (4.8%) | 234 (4.5%) |
| $75,000 to $99,999 | 517 (9.3%) | 254 (4.9%) |
| $100,000+ | 2,797 (50.3%) | 1,030 (20.0%) |
| Total | 5,559 (100.0%) | 5,143 (100.0%) |
Earnings by Sex by Educational Attainment in Murphy
Average earnings in Murphy are $106,432 for men and $48,018 for women, a difference of 54.9%. Men with an educational attainment of graduate degree enjoy the highest average annual earnings of $137,137, while those with high school diploma education earn the least with $34,510. Women with an educational attainment of bachelor's degree earn the most with the average annual earnings of $54,205, while those with high school diploma education have the smallest earnings of $23,699.
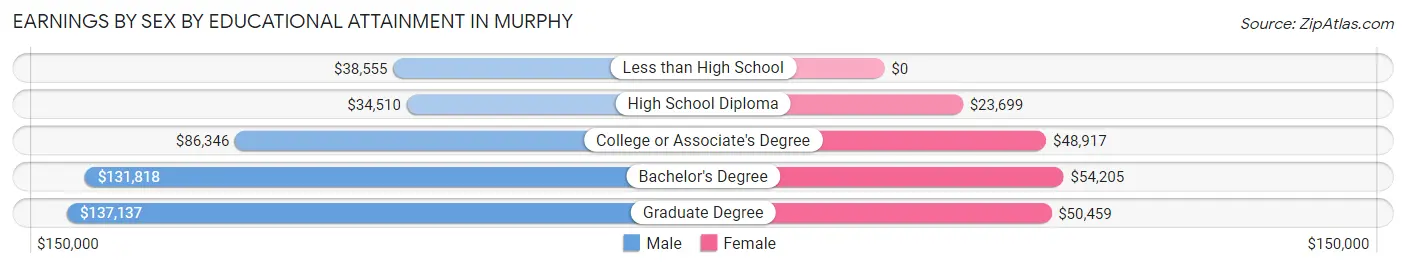
| Educational Attainment | Male Income | Female Income |
| Less than High School | $38,555 | $0 |
| High School Diploma | $34,510 | $23,699 |
| College or Associate's Degree | $86,346 | $48,917 |
| Bachelor's Degree | $131,818 | $54,205 |
| Graduate Degree | $137,137 | $50,459 |
| Total | $106,432 | $48,018 |
Family Income in Murphy
Family Income Brackets in Murphy
According to the Murphy family income data, there are 1,504 families falling into the $200,000+ income range, which is the most common income bracket and makes up 28.6% of all families.
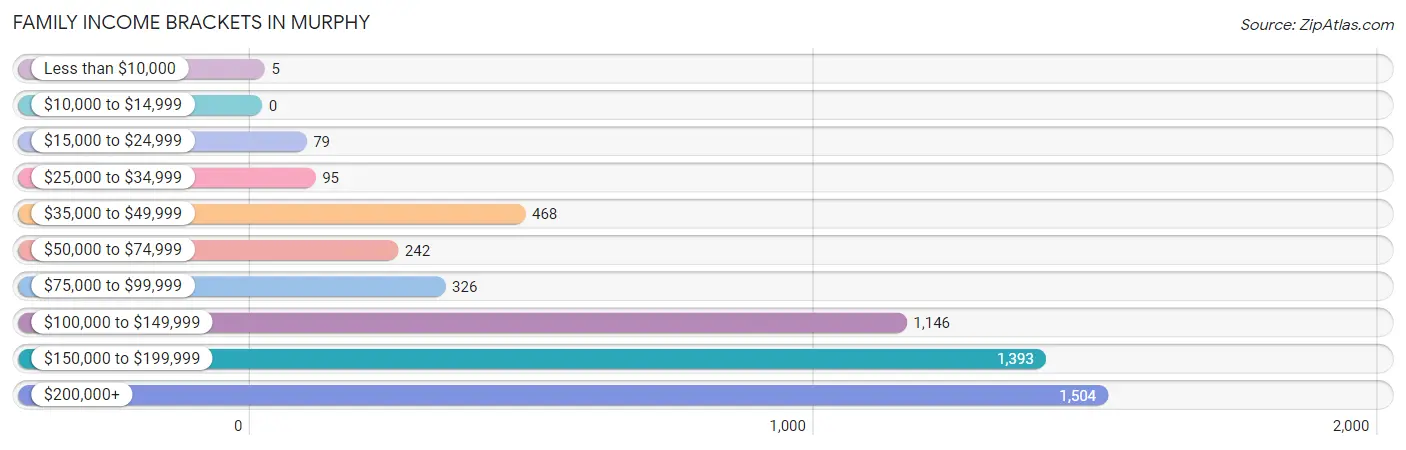
| Income Bracket | # Families | % Families |
| Less than $10,000 | 5 | 0.1% |
| $10,000 to $14,999 | 0 | 0.0% |
| $15,000 to $24,999 | 79 | 1.5% |
| $25,000 to $34,999 | 95 | 1.8% |
| $35,000 to $49,999 | 468 | 8.9% |
| $50,000 to $74,999 | 242 | 4.6% |
| $75,000 to $99,999 | 326 | 6.2% |
| $100,000 to $149,999 | 1,146 | 21.8% |
| $150,000 to $199,999 | 1,393 | 26.5% |
| $200,000+ | 1,504 | 28.6% |
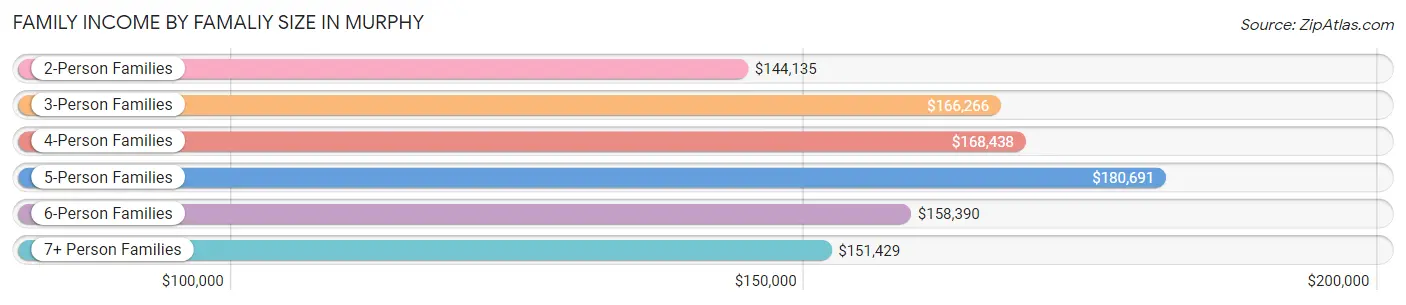
Family Income by Famaliy Size in Murphy
5-person families (631 | 12.0%) account for the highest median family income in Murphy with $180,691 per family, while 2-person families (1,257 | 23.9%) have the highest median income of $72,068 per family member.
| Income Bracket | # Families | Median Income |
| 2-Person Families | 1,257 (23.9%) | $144,135 |
| 3-Person Families | 1,204 (22.9%) | $166,266 |
| 4-Person Families | 1,443 (27.5%) | $168,438 |
| 5-Person Families | 631 (12.0%) | $180,691 |
| 6-Person Families | 530 (10.1%) | $158,390 |
| 7+ Person Families | 192 (3.6%) | $151,429 |
| Total | 5,257 (100.0%) | $158,791 |
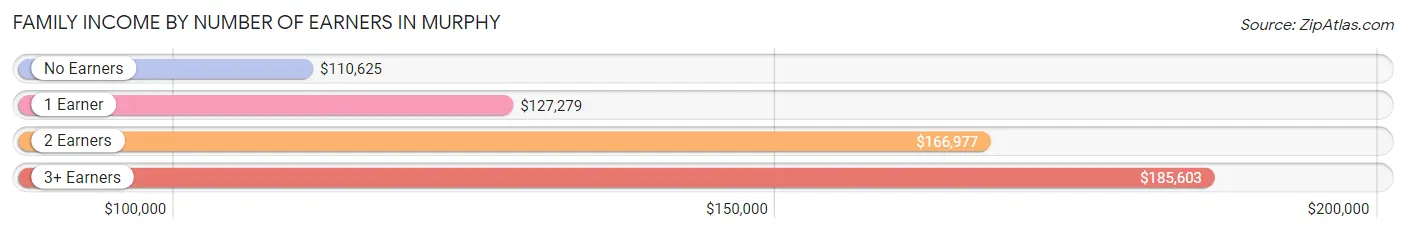
Family Income by Number of Earners in Murphy
The median family income in Murphy is $158,791, with families comprising 3+ earners (830) having the highest median family income of $185,603, while families with no earners (290) have the lowest median family income of $110,625, accounting for 15.8% and 5.5% of families, respectively.
| Number of Earners | # Families | Median Income |
| No Earners | 290 (5.5%) | $110,625 |
| 1 Earner | 1,135 (21.6%) | $127,279 |
| 2 Earners | 3,002 (57.1%) | $166,977 |
| 3+ Earners | 830 (15.8%) | $185,603 |
| Total | 5,257 (100.0%) | $158,791 |
Household Income in Murphy
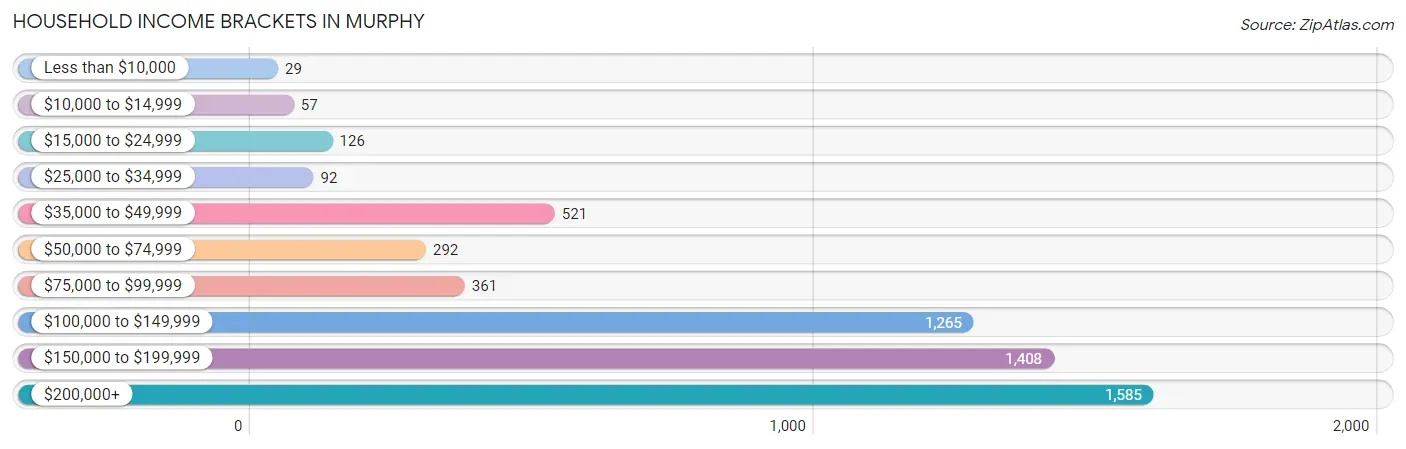
Household Income Brackets in Murphy
With 1,585 households falling in the category, the $200,000+ income range is the most frequent in Murphy, accounting for 27.7% of all households. In contrast, only 29 households (0.5%) fall into the less than $10,000 income bracket, making it the least populous group.
| Income Bracket | # Households | % Households |
| Less than $10,000 | 29 | 0.5% |
| $10,000 to $14,999 | 57 | 1.0% |
| $15,000 to $24,999 | 126 | 2.2% |
| $25,000 to $34,999 | 92 | 1.6% |
| $35,000 to $49,999 | 521 | 9.1% |
| $50,000 to $74,999 | 292 | 5.1% |
| $75,000 to $99,999 | 361 | 6.3% |
| $100,000 to $149,999 | 1,265 | 22.1% |
| $150,000 to $199,999 | 1,408 | 24.6% |
| $200,000+ | 1,585 | 27.7% |
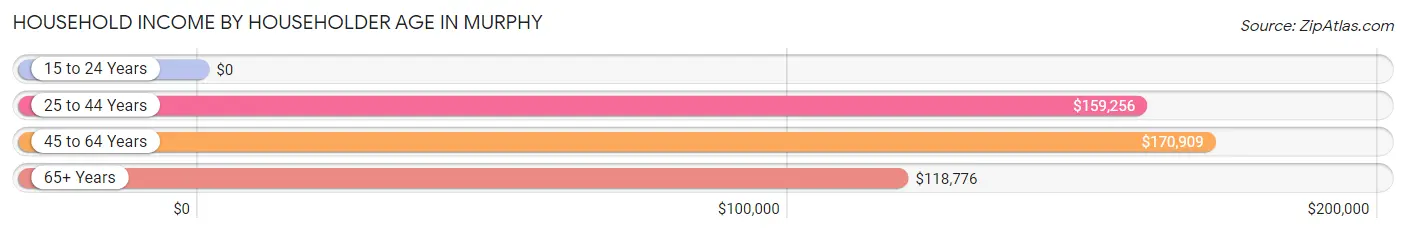
Household Income by Householder Age in Murphy
The median household income in Murphy is $152,847, with the highest median household income of $170,909 found in the 45 to 64 years age bracket for the primary householder. A total of 3,164 households (55.3%) fall into this category. Meanwhile, the 15 to 24 years age bracket for the primary householder has the lowest median household income of $0, with 31 households (0.5%) in this group.
| Income Bracket | # Households | Median Income |
| 15 to 24 Years | 31 (0.5%) | $0 |
| 25 to 44 Years | 1,512 (26.4%) | $159,256 |
| 45 to 64 Years | 3,164 (55.3%) | $170,909 |
| 65+ Years | 1,016 (17.7%) | $118,776 |
| Total | 5,723 (100.0%) | $152,847 |
Poverty in Murphy
Income Below Poverty by Sex and Age in Murphy
With 2.3% poverty level for males and 4.5% for females among the residents of Murphy, 65 to 74 year old males and 25 to 34 year old females are the most vulnerable to poverty, with 49 males (7.7%) and 88 females (15.4%) in their respective age groups living below the poverty level.
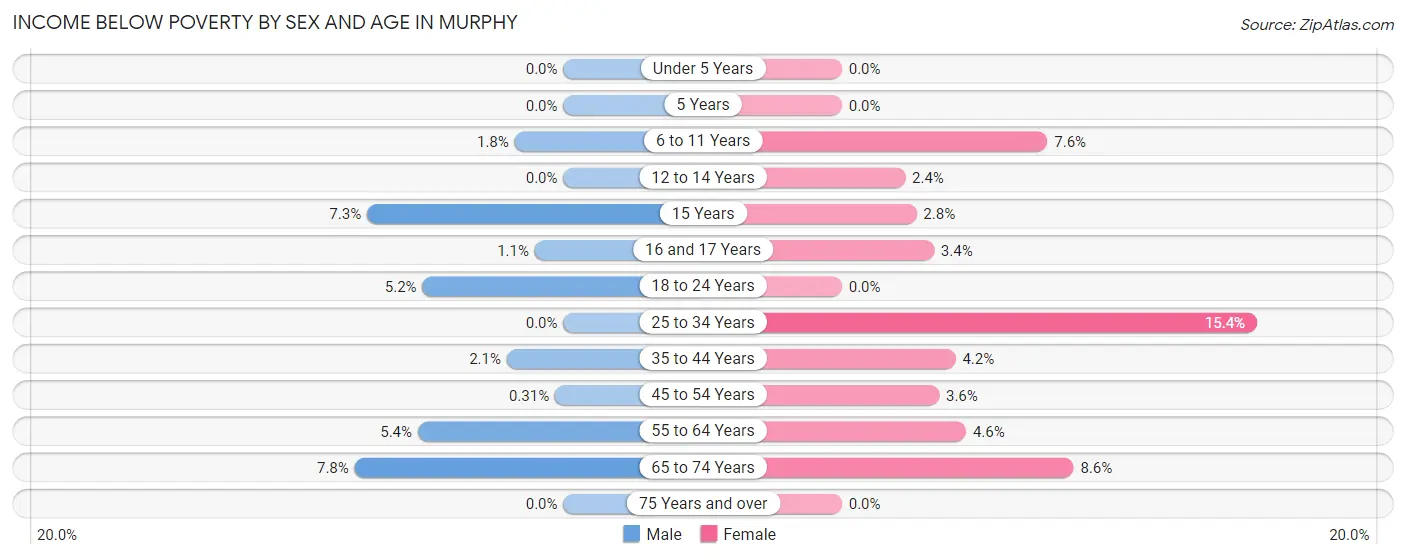
| Age Bracket | Male | Female |
| Under 5 Years | 0 (0.0%) | 0 (0.0%) |
| 5 Years | 0 (0.0%) | 0 (0.0%) |
| 6 to 11 Years | 23 (1.8%) | 70 (7.6%) |
| 12 to 14 Years | 0 (0.0%) | 23 (2.4%) |
| 15 Years | 24 (7.3%) | 9 (2.8%) |
| 16 and 17 Years | 7 (1.1%) | 19 (3.4%) |
| 18 to 24 Years | 47 (5.2%) | 0 (0.0%) |
| 25 to 34 Years | 0 (0.0%) | 88 (15.4%) |
| 35 to 44 Years | 24 (2.1%) | 76 (4.2%) |
| 45 to 54 Years | 7 (0.3%) | 74 (3.6%) |
| 55 to 64 Years | 57 (5.4%) | 49 (4.6%) |
| 65 to 74 Years | 49 (7.7%) | 61 (8.6%) |
| 75 Years and over | 0 (0.0%) | 0 (0.0%) |
| Total | 238 (2.3%) | 469 (4.5%) |
Income Above Poverty by Sex and Age in Murphy
According to the poverty statistics in Murphy, males aged under 5 years and females aged under 5 years are the age groups that are most secure financially, with 100.0% of males and 100.0% of females in these age groups living above the poverty line.
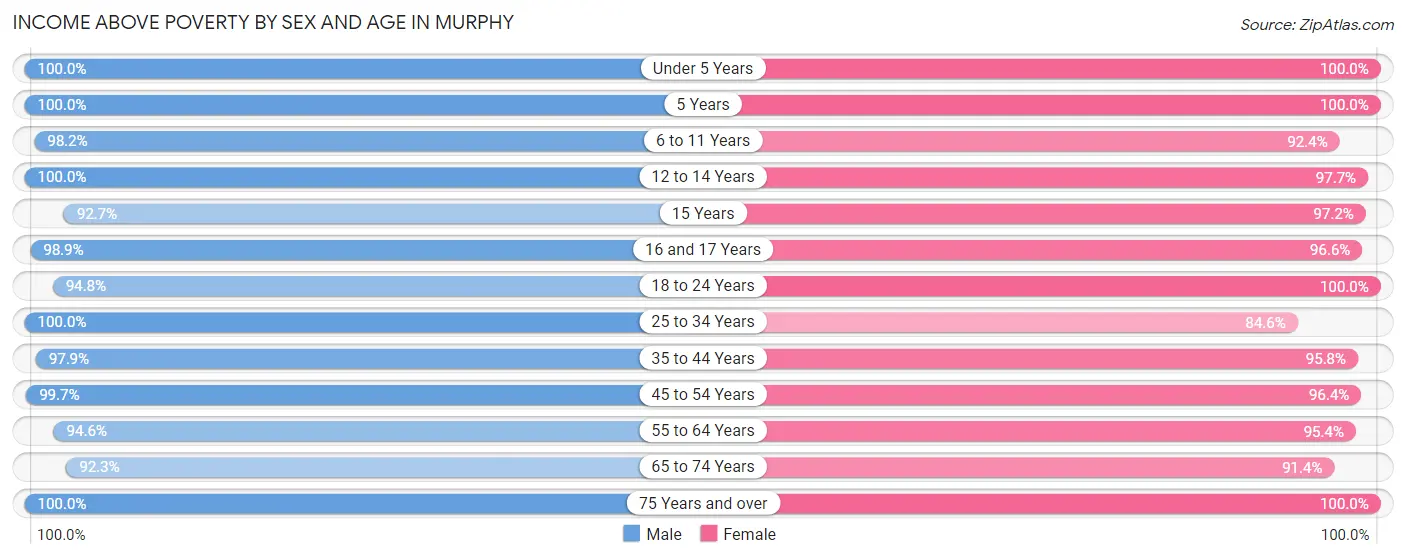
| Age Bracket | Male | Female |
| Under 5 Years | 403 (100.0%) | 399 (100.0%) |
| 5 Years | 60 (100.0%) | 169 (100.0%) |
| 6 to 11 Years | 1,247 (98.2%) | 847 (92.4%) |
| 12 to 14 Years | 850 (100.0%) | 956 (97.7%) |
| 15 Years | 305 (92.7%) | 316 (97.2%) |
| 16 and 17 Years | 653 (98.9%) | 537 (96.6%) |
| 18 to 24 Years | 851 (94.8%) | 707 (100.0%) |
| 25 to 34 Years | 307 (100.0%) | 483 (84.6%) |
| 35 to 44 Years | 1,121 (97.9%) | 1,725 (95.8%) |
| 45 to 54 Years | 2,280 (99.7%) | 1,977 (96.4%) |
| 55 to 64 Years | 998 (94.6%) | 1,014 (95.4%) |
| 65 to 74 Years | 583 (92.2%) | 648 (91.4%) |
| 75 Years and over | 421 (100.0%) | 248 (100.0%) |
| Total | 10,079 (97.7%) | 10,026 (95.5%) |
Income Below Poverty Among Married-Couple Families in Murphy
The poverty statistics for married-couple families in Murphy show that 2.5% or 112 of the total 4,572 families live below the poverty line. Families with 3 or 4 children have the highest poverty rate of 3.4%, comprising of 24 families. On the other hand, families with 5 or more children have the lowest poverty rate of 0.0%, which includes 0 families.
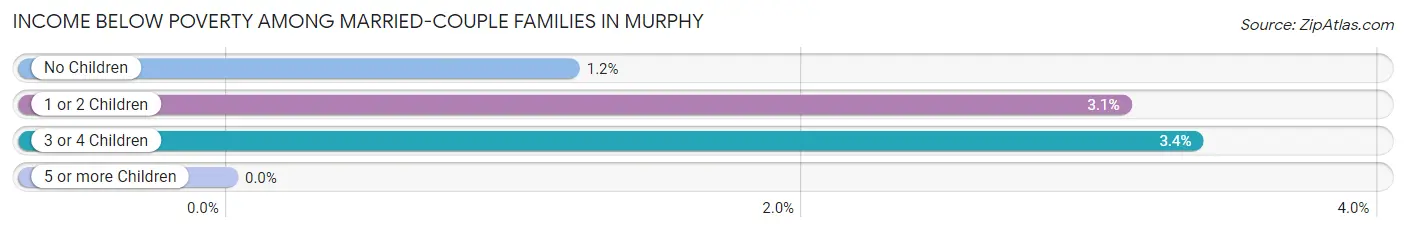
| Children | Above Poverty | Below Poverty |
| No Children | 1,499 (98.8%) | 18 (1.2%) |
| 1 or 2 Children | 2,184 (96.9%) | 70 (3.1%) |
| 3 or 4 Children | 691 (96.6%) | 24 (3.4%) |
| 5 or more Children | 86 (100.0%) | 0 (0.0%) |
| Total | 4,460 (97.6%) | 112 (2.5%) |
Income Below Poverty Among Single-Parent Households in Murphy
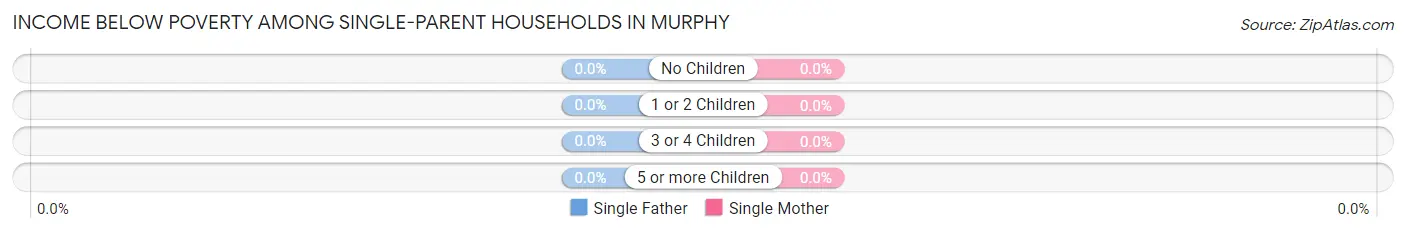
| Children | Single Father | Single Mother |
| No Children | 0 (0.0%) | 0 (0.0%) |
| 1 or 2 Children | 0 (0.0%) | 0 (0.0%) |
| 3 or 4 Children | 0 (0.0%) | 0 (0.0%) |
| 5 or more Children | 0 (0.0%) | 0 (0.0%) |
| Total | 0 (0.0%) | 0 (0.0%) |
Income Below Poverty Among Married-Couple vs Single-Parent Households in Murphy
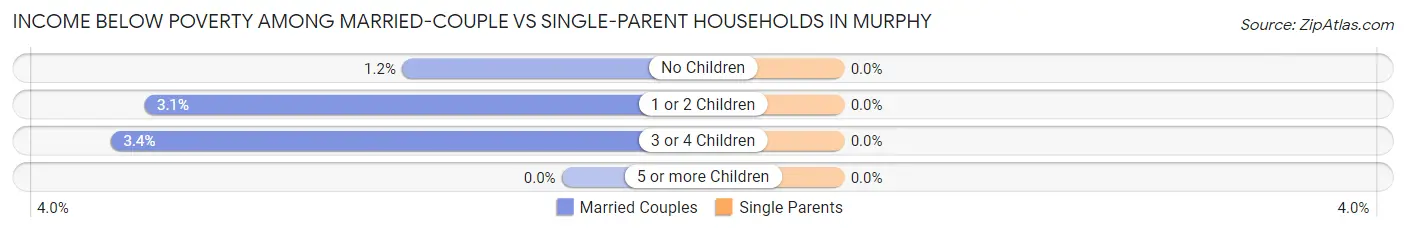
| Children | Married-Couple Families | Single-Parent Households |
| No Children | 18 (1.2%) | 0 (0.0%) |
| 1 or 2 Children | 70 (3.1%) | 0 (0.0%) |
| 3 or 4 Children | 24 (3.4%) | 0 (0.0%) |
| 5 or more Children | 0 (0.0%) | 0 (0.0%) |
| Total | 112 (2.5%) | 0 (0.0%) |
Employment Characteristics in Murphy
Employment by Class of Employer in Murphy
Among the 9,619 employed individuals in Murphy, private company employees (7,197 | 74.8%), self-employed (incorporated) (699 | 7.3%), and not-for-profit organizations (568 | 5.9%) make up the most common classes of employment.
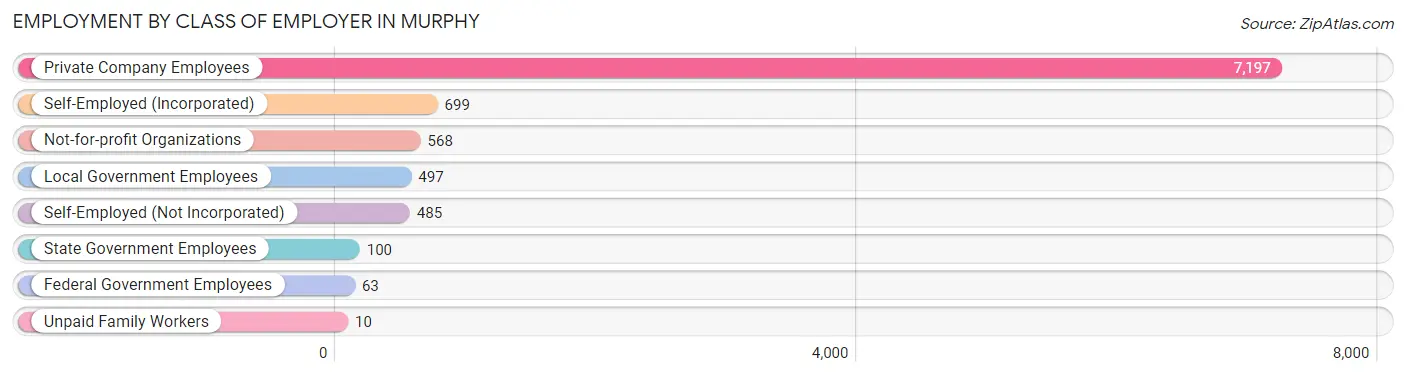
| Employer Class | # Employees | % Employees |
| Private Company Employees | 7,197 | 74.8% |
| Self-Employed (Incorporated) | 699 | 7.3% |
| Self-Employed (Not Incorporated) | 485 | 5.0% |
| Not-for-profit Organizations | 568 | 5.9% |
| Local Government Employees | 497 | 5.2% |
| State Government Employees | 100 | 1.0% |
| Federal Government Employees | 63 | 0.6% |
| Unpaid Family Workers | 10 | 0.1% |
| Total | 9,619 | 100.0% |
Employment Status by Age in Murphy
According to the labor force statistics for Murphy, out of the total population over 16 years of age (15,111), 67.6% or 10,215 individuals are in the labor force, with 5.2% or 531 of them unemployed. The age group with the highest labor force participation rate is 55 to 59 years, with 89.7% or 1,027 individuals in the labor force. Within the labor force, the 25 to 29 years age range has the highest percentage of unemployed individuals, with 40.1% or 146 of them being unemployed.
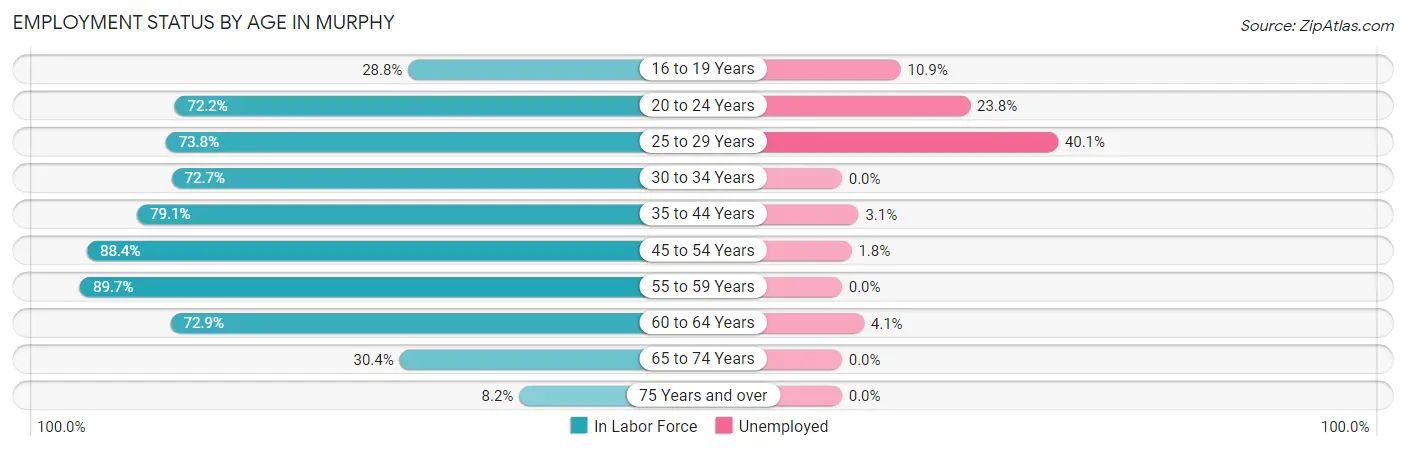
| Age Bracket | In Labor Force | Unemployed |
| 16 to 19 Years | 549 (28.8%) | 60 (10.9%) |
| 20 to 24 Years | 661 (72.2%) | 157 (23.8%) |
| 25 to 29 Years | 364 (73.8%) | 146 (40.1%) |
| 30 to 34 Years | 280 (72.7%) | 0 (0.0%) |
| 35 to 44 Years | 2,330 (79.1%) | 72 (3.1%) |
| 45 to 54 Years | 3,835 (88.4%) | 69 (1.8%) |
| 55 to 59 Years | 1,027 (89.7%) | 0 (0.0%) |
| 60 to 64 Years | 709 (72.9%) | 29 (4.1%) |
| 65 to 74 Years | 408 (30.4%) | 0 (0.0%) |
| 75 Years and over | 55 (8.2%) | 0 (0.0%) |
| Total | 10,215 (67.6%) | 531 (5.2%) |
Employment Status by Educational Attainment in Murphy
According to labor force statistics for Murphy, 83.1% of individuals (8,543) out of the total population between 25 and 64 years of age (10,280) are in the labor force, with 3.7% or 316 of them being unemployed. The group with the highest labor force participation rate are those with the educational attainment of high school diploma, with 88.4% or 1,107 individuals in the labor force. Within the labor force, individuals with less than high school education have the highest percentage of unemployment, with 31.9% or 58 of them being unemployed.
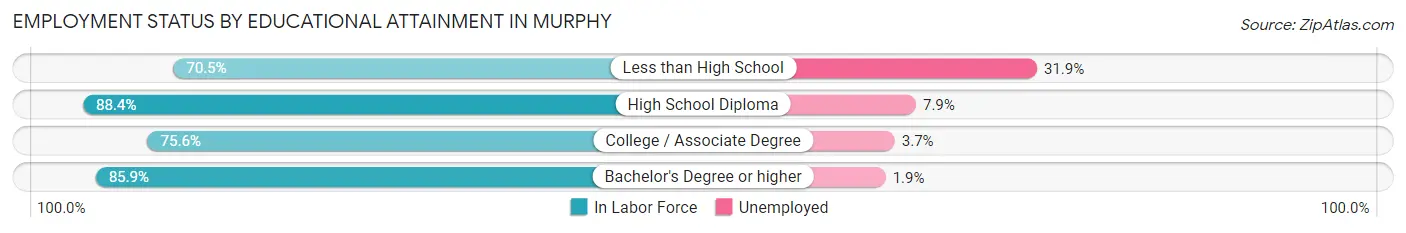
| Educational Attainment | In Labor Force | Unemployed |
| Less than High School | 182 (70.5%) | 82 (31.9%) |
| High School Diploma | 1,107 (88.4%) | 99 (7.9%) |
| College / Associate Degree | 2,024 (75.6%) | 99 (3.7%) |
| Bachelor's Degree or higher | 5,234 (85.9%) | 116 (1.9%) |
| Total | 8,543 (83.1%) | 380 (3.7%) |
Employment Occupations by Sex in Murphy
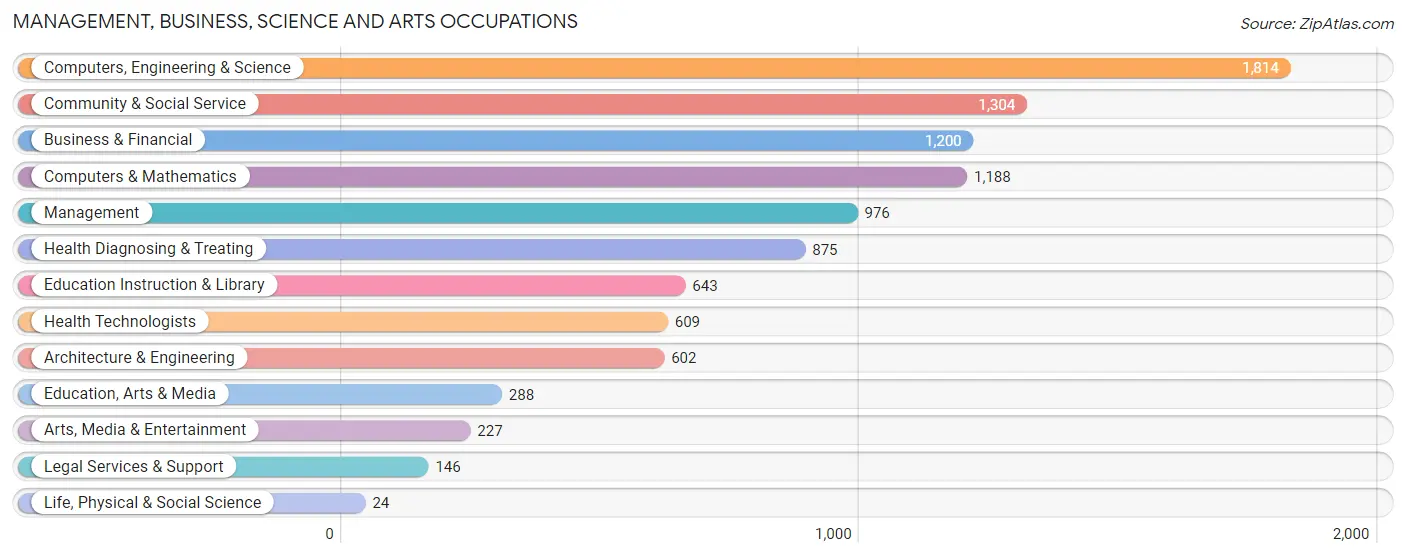
Management, Business, Science and Arts Occupations
The most common Management, Business, Science and Arts occupations in Murphy are Computers, Engineering & Science (1,814 | 18.7%), Community & Social Service (1,304 | 13.5%), Business & Financial (1,200 | 12.4%), Computers & Mathematics (1,188 | 12.3%), and Management (976 | 10.1%).
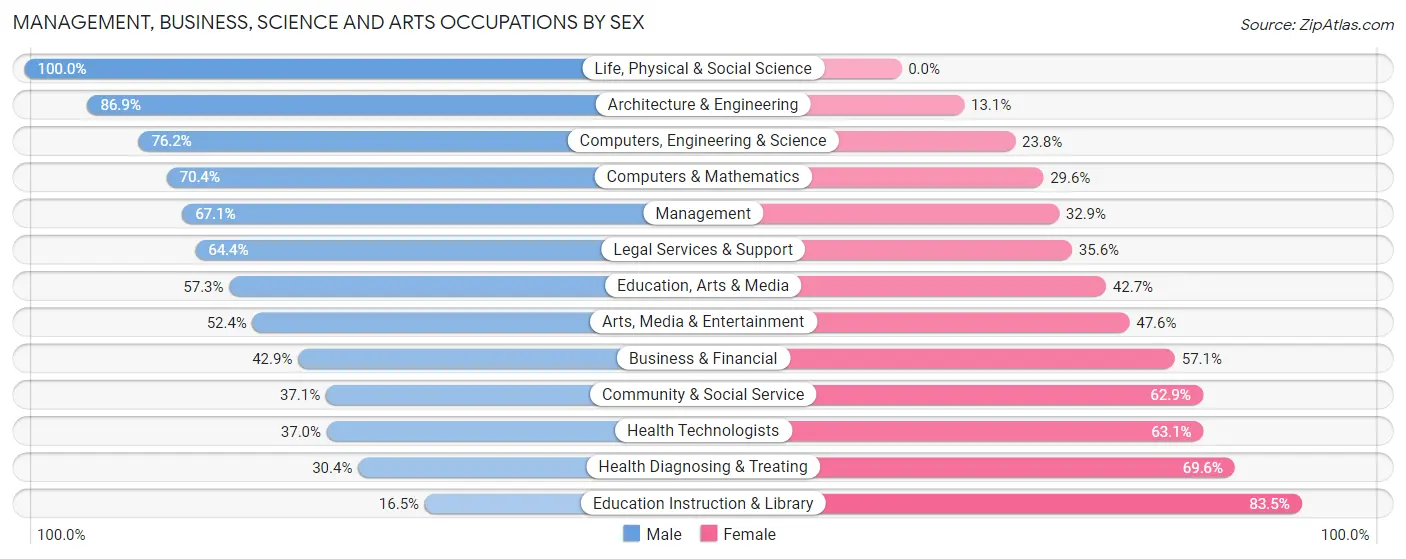
Management, Business, Science and Arts Occupations by Sex
Within the Management, Business, Science and Arts occupations in Murphy, the most male-oriented occupations are Life, Physical & Social Science (100.0%), Architecture & Engineering (86.9%), and Computers, Engineering & Science (76.2%), while the most female-oriented occupations are Education Instruction & Library (83.5%), Health Diagnosing & Treating (69.6%), and Health Technologists (63.0%).
| Occupation | Male | Female |
| Management | 655 (67.1%) | 321 (32.9%) |
| Business & Financial | 515 (42.9%) | 685 (57.1%) |
| Computers, Engineering & Science | 1,383 (76.2%) | 431 (23.8%) |
| Computers & Mathematics | 836 (70.4%) | 352 (29.6%) |
| Architecture & Engineering | 523 (86.9%) | 79 (13.1%) |
| Life, Physical & Social Science | 24 (100.0%) | 0 (0.0%) |
| Community & Social Service | 484 (37.1%) | 820 (62.9%) |
| Education, Arts & Media | 165 (57.3%) | 123 (42.7%) |
| Legal Services & Support | 94 (64.4%) | 52 (35.6%) |
| Education Instruction & Library | 106 (16.5%) | 537 (83.5%) |
| Arts, Media & Entertainment | 119 (52.4%) | 108 (47.6%) |
| Health Diagnosing & Treating | 266 (30.4%) | 609 (69.6%) |
| Health Technologists | 225 (36.9%) | 384 (63.0%) |
| Total (Category) | 3,303 (53.5%) | 2,866 (46.5%) |
| Total (Overall) | 5,166 (53.3%) | 4,517 (46.7%) |
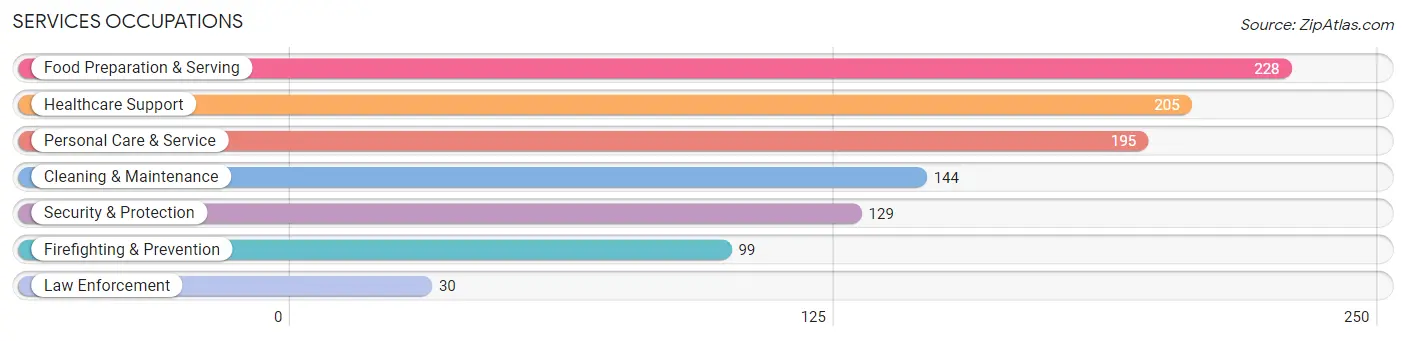
Services Occupations
The most common Services occupations in Murphy are Food Preparation & Serving (228 | 2.4%), Healthcare Support (205 | 2.1%), Personal Care & Service (195 | 2.0%), Cleaning & Maintenance (144 | 1.5%), and Security & Protection (129 | 1.3%).
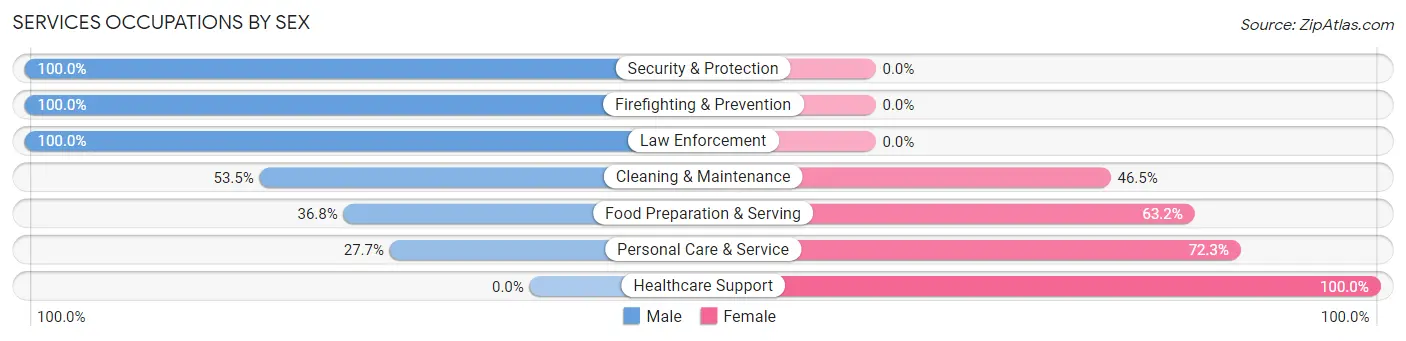
Services Occupations by Sex
Within the Services occupations in Murphy, the most male-oriented occupations are Security & Protection (100.0%), Firefighting & Prevention (100.0%), and Law Enforcement (100.0%), while the most female-oriented occupations are Healthcare Support (100.0%), Personal Care & Service (72.3%), and Food Preparation & Serving (63.2%).
| Occupation | Male | Female |
| Healthcare Support | 0 (0.0%) | 205 (100.0%) |
| Security & Protection | 129 (100.0%) | 0 (0.0%) |
| Firefighting & Prevention | 99 (100.0%) | 0 (0.0%) |
| Law Enforcement | 30 (100.0%) | 0 (0.0%) |
| Food Preparation & Serving | 84 (36.8%) | 144 (63.2%) |
| Cleaning & Maintenance | 77 (53.5%) | 67 (46.5%) |
| Personal Care & Service | 54 (27.7%) | 141 (72.3%) |
| Total (Category) | 344 (38.2%) | 557 (61.8%) |
| Total (Overall) | 5,166 (53.3%) | 4,517 (46.7%) |
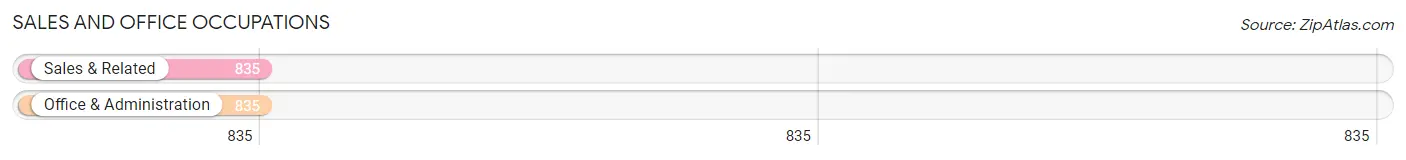
Sales and Office Occupations
The most common Sales and Office occupations in Murphy are Sales & Related (835 | 8.6%), and Office & Administration (835 | 8.6%).
Sales and Office Occupations by Sex
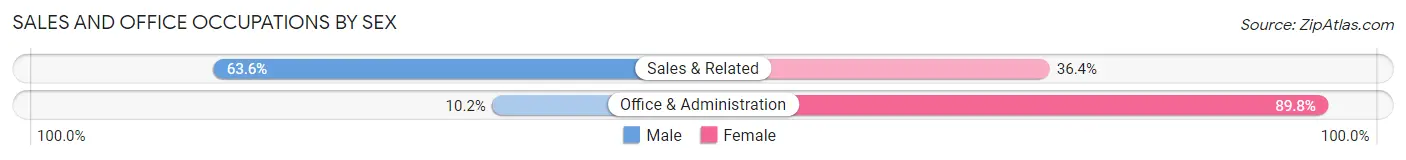
| Occupation | Male | Female |
| Sales & Related | 531 (63.6%) | 304 (36.4%) |
| Office & Administration | 85 (10.2%) | 750 (89.8%) |
| Total (Category) | 616 (36.9%) | 1,054 (63.1%) |
| Total (Overall) | 5,166 (53.3%) | 4,517 (46.7%) |
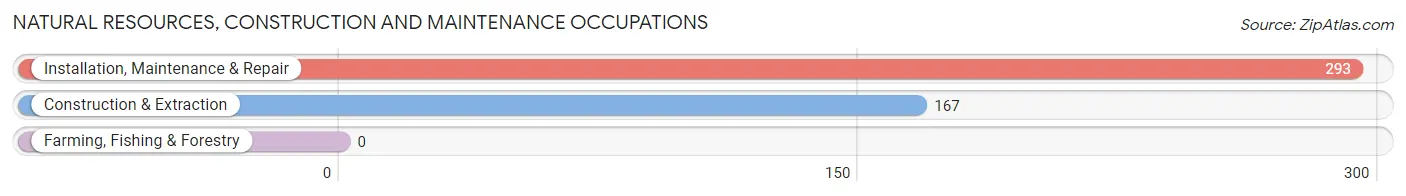
Natural Resources, Construction and Maintenance Occupations
The most common Natural Resources, Construction and Maintenance occupations in Murphy are Installation, Maintenance & Repair (293 | 3.0%), and Construction & Extraction (167 | 1.7%).
Natural Resources, Construction and Maintenance Occupations by Sex
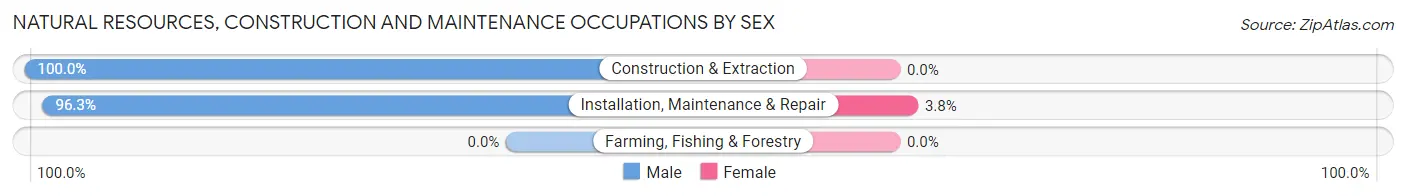
| Occupation | Male | Female |
| Farming, Fishing & Forestry | 0 (0.0%) | 0 (0.0%) |
| Construction & Extraction | 167 (100.0%) | 0 (0.0%) |
| Installation, Maintenance & Repair | 282 (96.3%) | 11 (3.7%) |
| Total (Category) | 449 (97.6%) | 11 (2.4%) |
| Total (Overall) | 5,166 (53.3%) | 4,517 (46.7%) |
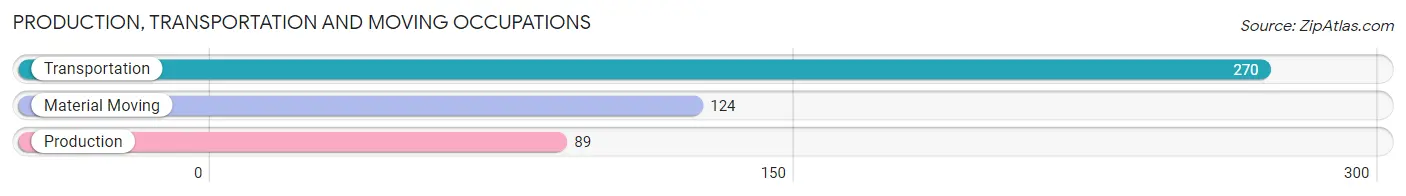
Production, Transportation and Moving Occupations
The most common Production, Transportation and Moving occupations in Murphy are Transportation (270 | 2.8%), Material Moving (124 | 1.3%), and Production (89 | 0.9%).
Production, Transportation and Moving Occupations by Sex
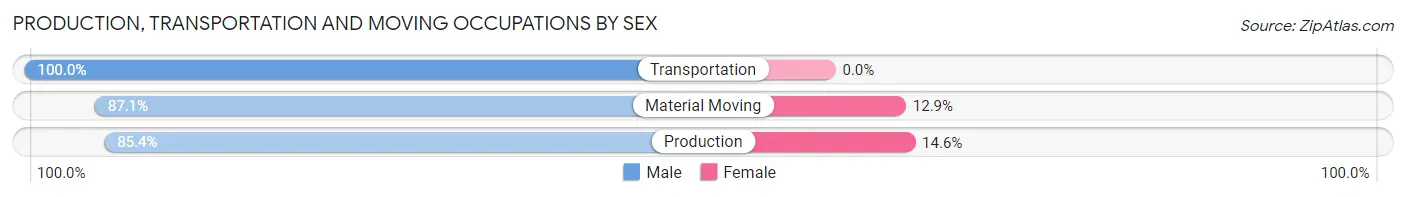
| Occupation | Male | Female |
| Production | 76 (85.4%) | 13 (14.6%) |
| Transportation | 270 (100.0%) | 0 (0.0%) |
| Material Moving | 108 (87.1%) | 16 (12.9%) |
| Total (Category) | 454 (94.0%) | 29 (6.0%) |
| Total (Overall) | 5,166 (53.3%) | 4,517 (46.7%) |
Employment Industries by Sex in Murphy
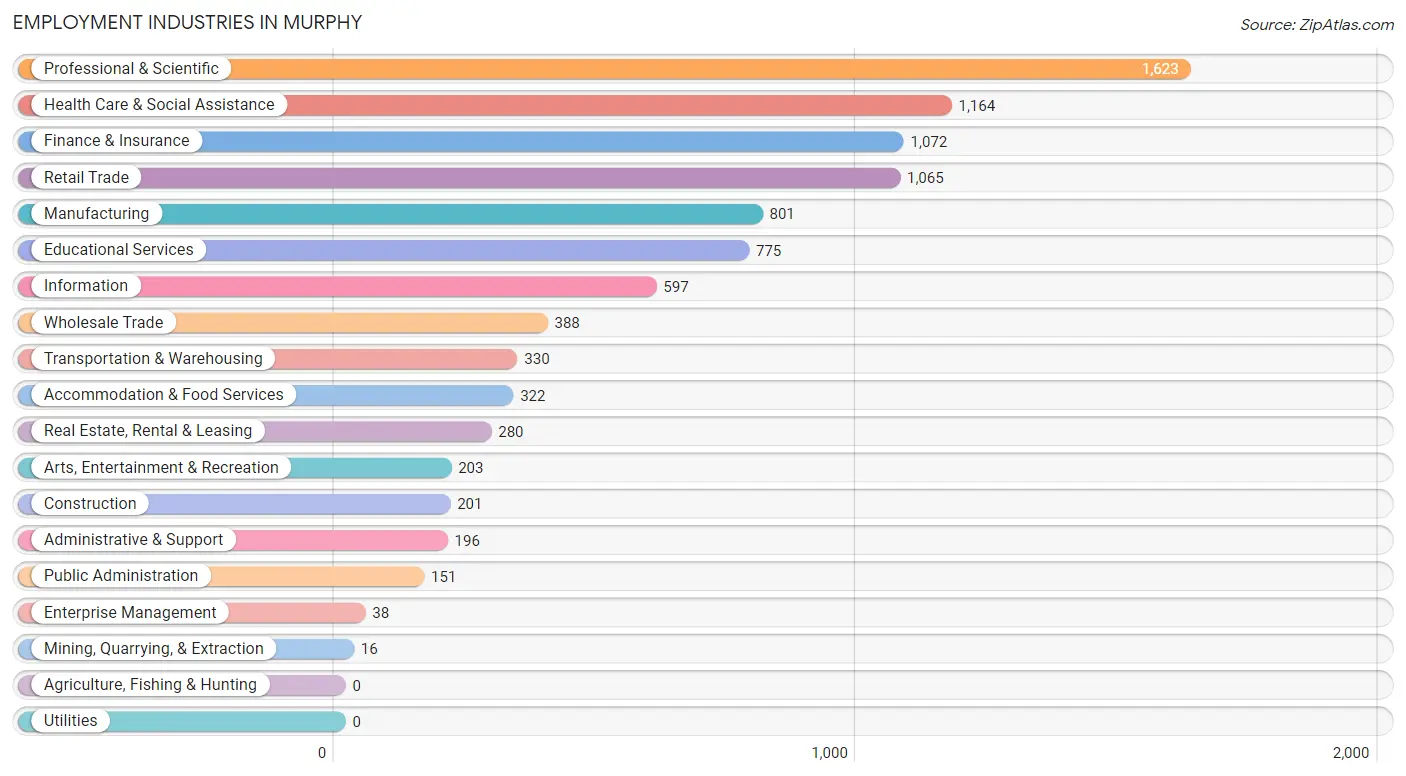
Employment Industries in Murphy
The major employment industries in Murphy include Professional & Scientific (1,623 | 16.8%), Health Care & Social Assistance (1,164 | 12.0%), Finance & Insurance (1,072 | 11.1%), Retail Trade (1,065 | 11.0%), and Manufacturing (801 | 8.3%).
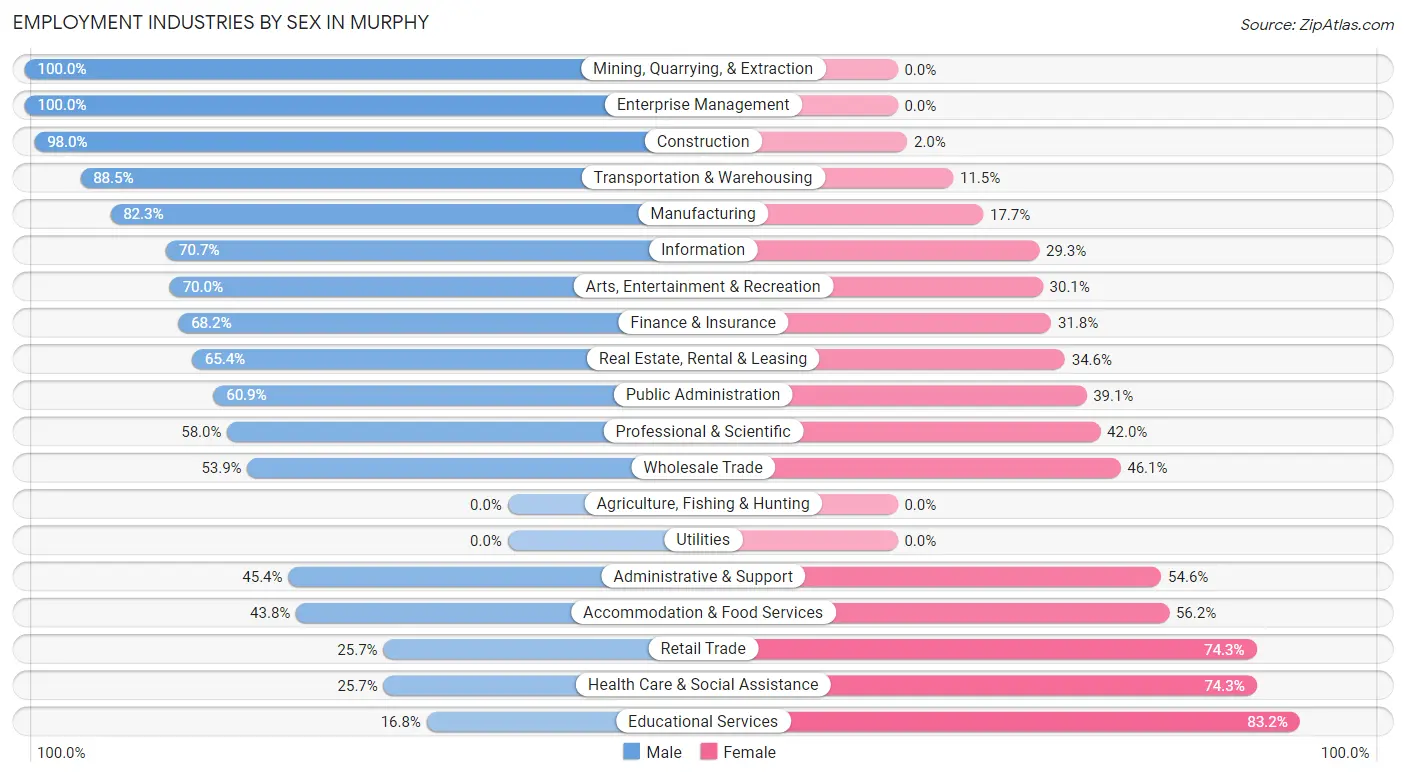
Employment Industries by Sex in Murphy
The Murphy industries that see more men than women are Mining, Quarrying, & Extraction (100.0%), Enterprise Management (100.0%), and Construction (98.0%), whereas the industries that tend to have a higher number of women are Educational Services (83.2%), Health Care & Social Assistance (74.3%), and Retail Trade (74.3%).
| Industry | Male | Female |
| Agriculture, Fishing & Hunting | 0 (0.0%) | 0 (0.0%) |
| Mining, Quarrying, & Extraction | 16 (100.0%) | 0 (0.0%) |
| Construction | 197 (98.0%) | 4 (2.0%) |
| Manufacturing | 659 (82.3%) | 142 (17.7%) |
| Wholesale Trade | 209 (53.9%) | 179 (46.1%) |
| Retail Trade | 274 (25.7%) | 791 (74.3%) |
| Transportation & Warehousing | 292 (88.5%) | 38 (11.5%) |
| Utilities | 0 (0.0%) | 0 (0.0%) |
| Information | 422 (70.7%) | 175 (29.3%) |
| Finance & Insurance | 731 (68.2%) | 341 (31.8%) |
| Real Estate, Rental & Leasing | 183 (65.4%) | 97 (34.6%) |
| Professional & Scientific | 942 (58.0%) | 681 (42.0%) |
| Enterprise Management | 38 (100.0%) | 0 (0.0%) |
| Administrative & Support | 89 (45.4%) | 107 (54.6%) |
| Educational Services | 130 (16.8%) | 645 (83.2%) |
| Health Care & Social Assistance | 299 (25.7%) | 865 (74.3%) |
| Arts, Entertainment & Recreation | 142 (70.0%) | 61 (30.0%) |
| Accommodation & Food Services | 141 (43.8%) | 181 (56.2%) |
| Public Administration | 92 (60.9%) | 59 (39.1%) |
| Total | 5,166 (53.3%) | 4,517 (46.7%) |
Education in Murphy
School Enrollment in Murphy
The most common levels of schooling among the 7,888 students in Murphy are high school (2,848 | 36.1%), elementary school (1,555 | 19.7%), and middle school (1,533 | 19.4%).
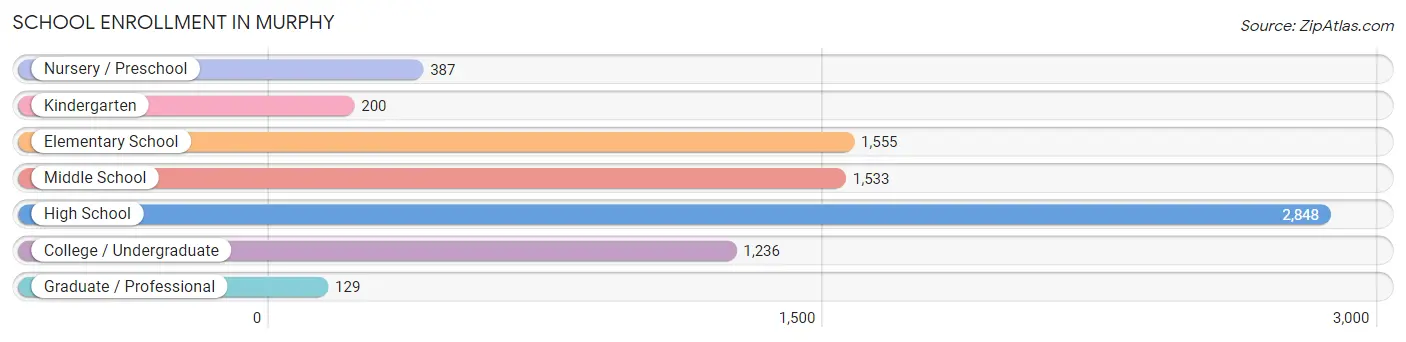
| School Level | # Students | % Students |
| Nursery / Preschool | 387 | 4.9% |
| Kindergarten | 200 | 2.5% |
| Elementary School | 1,555 | 19.7% |
| Middle School | 1,533 | 19.4% |
| High School | 2,848 | 36.1% |
| College / Undergraduate | 1,236 | 15.7% |
| Graduate / Professional | 129 | 1.6% |
| Total | 7,888 | 100.0% |
School Enrollment by Age by Funding Source in Murphy
Out of a total of 7,888 students who are enrolled in schools in Murphy, 860 (10.9%) attend a private institution, while the remaining 7,028 (89.1%) are enrolled in public schools. The age group of 3 to 4 year olds has the highest likelihood of being enrolled in private schools, with 155 (51.0% in the age bracket) enrolled. Conversely, the age group of 18 to 19 year olds has the lowest likelihood of being enrolled in a private school, with 681 (98.7% in the age bracket) attending a public institution.
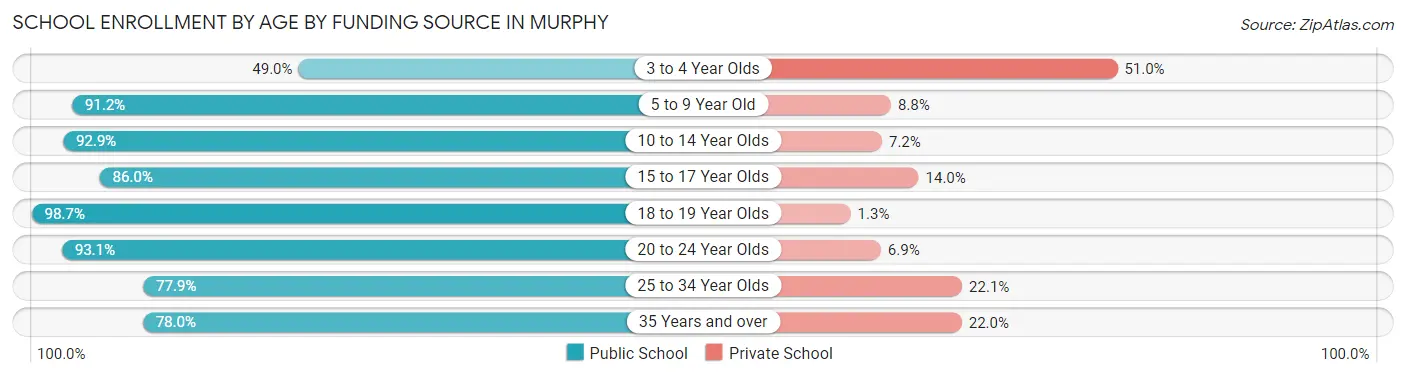
| Age Bracket | Public School | Private School |
| 3 to 4 Year Olds | 149 (49.0%) | 155 (51.0%) |
| 5 to 9 Year Old | 1,448 (91.2%) | 140 (8.8%) |
| 10 to 14 Year Olds | 2,415 (92.8%) | 186 (7.1%) |
| 15 to 17 Year Olds | 1,609 (86.0%) | 261 (14.0%) |
| 18 to 19 Year Olds | 681 (98.7%) | 9 (1.3%) |
| 20 to 24 Year Olds | 456 (93.1%) | 34 (6.9%) |
| 25 to 34 Year Olds | 113 (77.9%) | 32 (22.1%) |
| 35 Years and over | 156 (78.0%) | 44 (22.0%) |
| Total | 7,028 (89.1%) | 860 (10.9%) |
Educational Attainment by Field of Study in Murphy
Business (1,660 | 23.3%), science & technology (968 | 13.6%), engineering (814 | 11.5%), computers & mathematics (720 | 10.1%), and education (626 | 8.8%) are the most common fields of study among 7,112 individuals in Murphy who have obtained a bachelor's degree or higher.
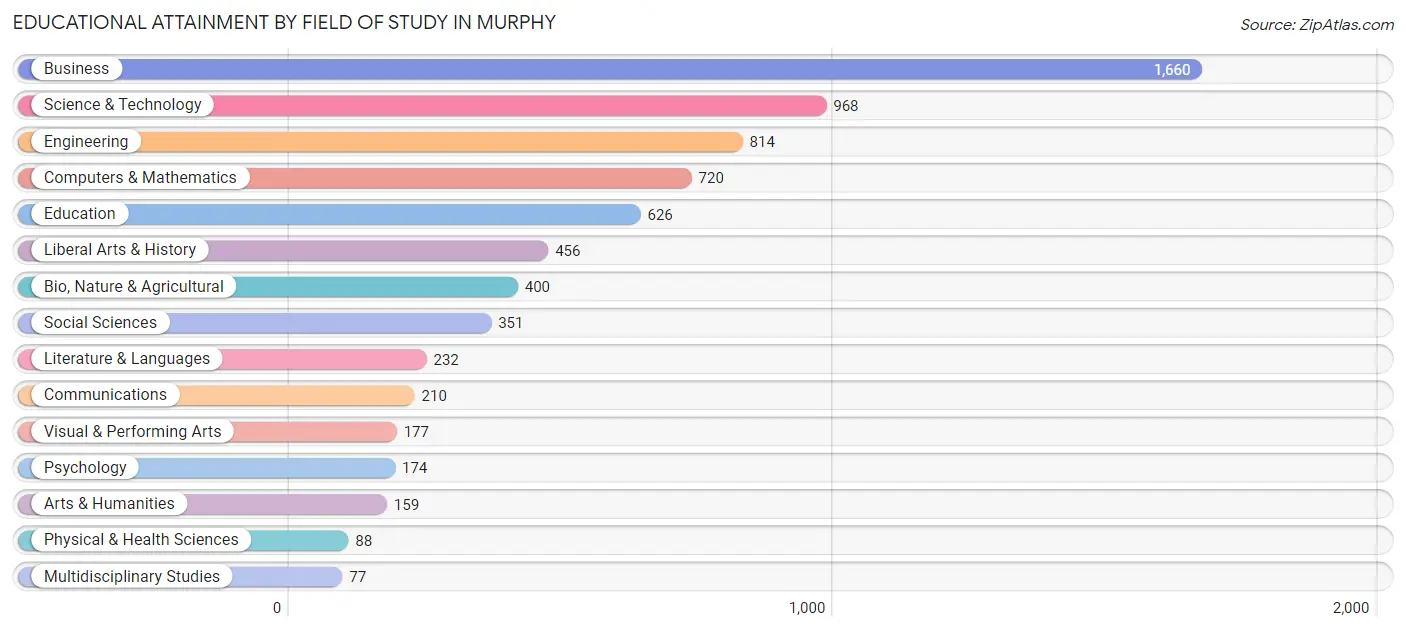
| Field of Study | # Graduates | % Graduates |
| Computers & Mathematics | 720 | 10.1% |
| Bio, Nature & Agricultural | 400 | 5.6% |
| Physical & Health Sciences | 88 | 1.2% |
| Psychology | 174 | 2.5% |
| Social Sciences | 351 | 4.9% |
| Engineering | 814 | 11.5% |
| Multidisciplinary Studies | 77 | 1.1% |
| Science & Technology | 968 | 13.6% |
| Business | 1,660 | 23.3% |
| Education | 626 | 8.8% |
| Literature & Languages | 232 | 3.3% |
| Liberal Arts & History | 456 | 6.4% |
| Visual & Performing Arts | 177 | 2.5% |
| Communications | 210 | 2.9% |
| Arts & Humanities | 159 | 2.2% |
| Total | 7,112 | 100.0% |
Transportation & Commute in Murphy
Vehicle Availability by Sex in Murphy
The most prevalent vehicle ownership categories in Murphy are males with 2 vehicles (2,520, accounting for 49.1%) and females with 2 vehicles (2,036, making up 56.1%).
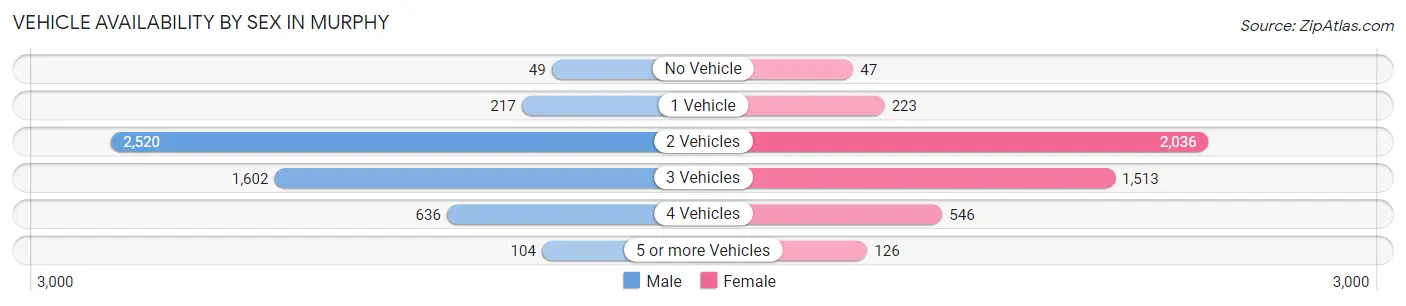
| Vehicles Available | Male | Female |
| No Vehicle | 49 (1.0%) | 47 (1.1%) |
| 1 Vehicle | 217 (4.2%) | 223 (5.0%) |
| 2 Vehicles | 2,520 (49.1%) | 2,036 (45.3%) |
| 3 Vehicles | 1,602 (31.2%) | 1,513 (33.7%) |
| 4 Vehicles | 636 (12.4%) | 546 (12.2%) |
| 5 or more Vehicles | 104 (2.0%) | 126 (2.8%) |
| Total | 5,128 (100.0%) | 4,491 (100.0%) |
Commute Time in Murphy
The most frequently occuring commute durations in Murphy are 30 to 34 minutes (1,001 commuters, 14.4%), 45 to 59 minutes (917 commuters, 13.2%), and 20 to 24 minutes (779 commuters, 11.2%).
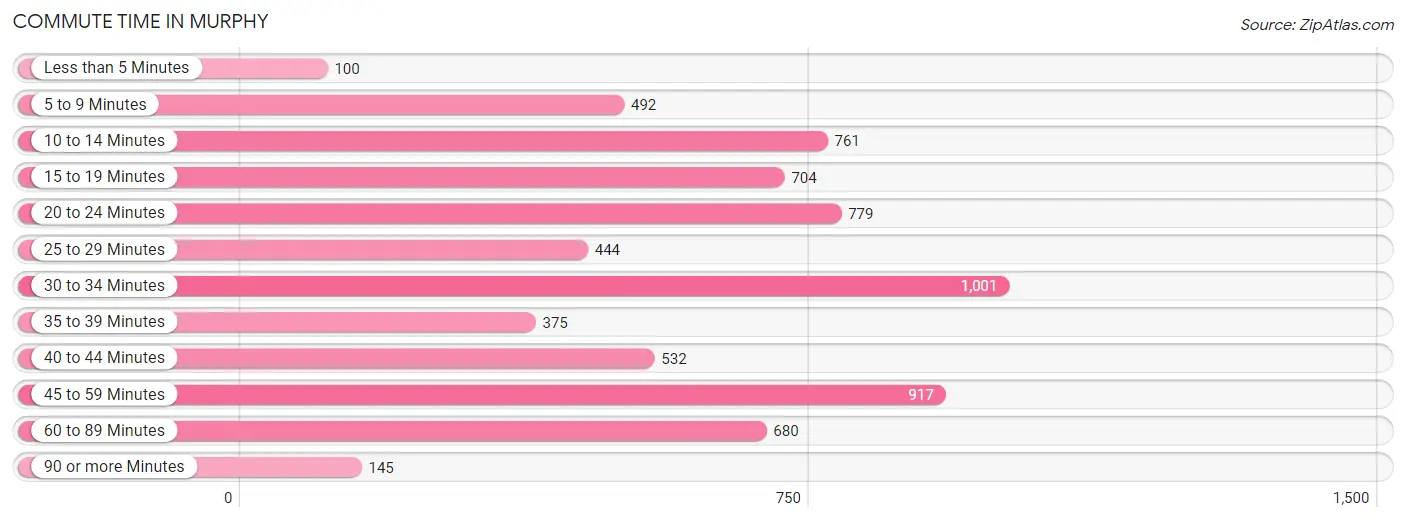
| Commute Time | # Commuters | % Commuters |
| Less than 5 Minutes | 100 | 1.4% |
| 5 to 9 Minutes | 492 | 7.1% |
| 10 to 14 Minutes | 761 | 11.0% |
| 15 to 19 Minutes | 704 | 10.2% |
| 20 to 24 Minutes | 779 | 11.2% |
| 25 to 29 Minutes | 444 | 6.4% |
| 30 to 34 Minutes | 1,001 | 14.4% |
| 35 to 39 Minutes | 375 | 5.4% |
| 40 to 44 Minutes | 532 | 7.7% |
| 45 to 59 Minutes | 917 | 13.2% |
| 60 to 89 Minutes | 680 | 9.8% |
| 90 or more Minutes | 145 | 2.1% |
Commute Time by Sex in Murphy
The most common commute times in Murphy are 30 to 34 minutes (602 commuters, 15.3%) for males and 10 to 14 minutes (485 commuters, 16.1%) for females.
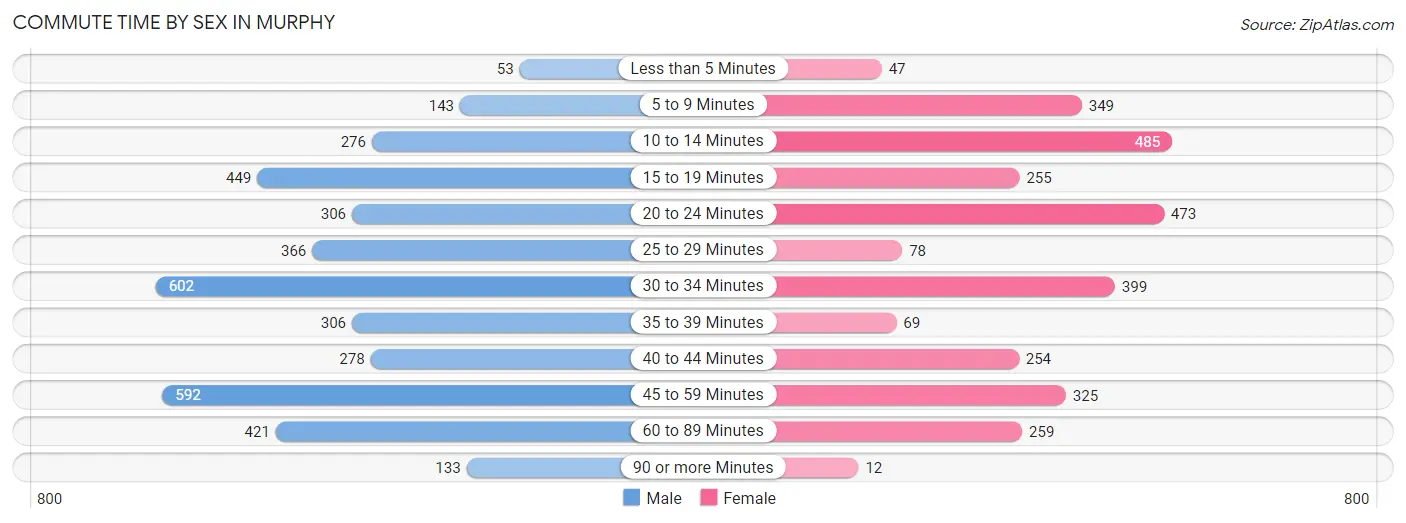
| Commute Time | Male | Female |
| Less than 5 Minutes | 53 (1.3%) | 47 (1.6%) |
| 5 to 9 Minutes | 143 (3.6%) | 349 (11.6%) |
| 10 to 14 Minutes | 276 (7.0%) | 485 (16.1%) |
| 15 to 19 Minutes | 449 (11.4%) | 255 (8.5%) |
| 20 to 24 Minutes | 306 (7.8%) | 473 (15.7%) |
| 25 to 29 Minutes | 366 (9.3%) | 78 (2.6%) |
| 30 to 34 Minutes | 602 (15.3%) | 399 (13.3%) |
| 35 to 39 Minutes | 306 (7.8%) | 69 (2.3%) |
| 40 to 44 Minutes | 278 (7.1%) | 254 (8.5%) |
| 45 to 59 Minutes | 592 (15.1%) | 325 (10.8%) |
| 60 to 89 Minutes | 421 (10.7%) | 259 (8.6%) |
| 90 or more Minutes | 133 (3.4%) | 12 (0.4%) |
Time of Departure to Work by Sex in Murphy
The most frequent times of departure to work in Murphy are 7:00 AM to 7:29 AM (780, 19.9%) for males and 7:00 AM to 7:29 AM (569, 18.9%) for females.
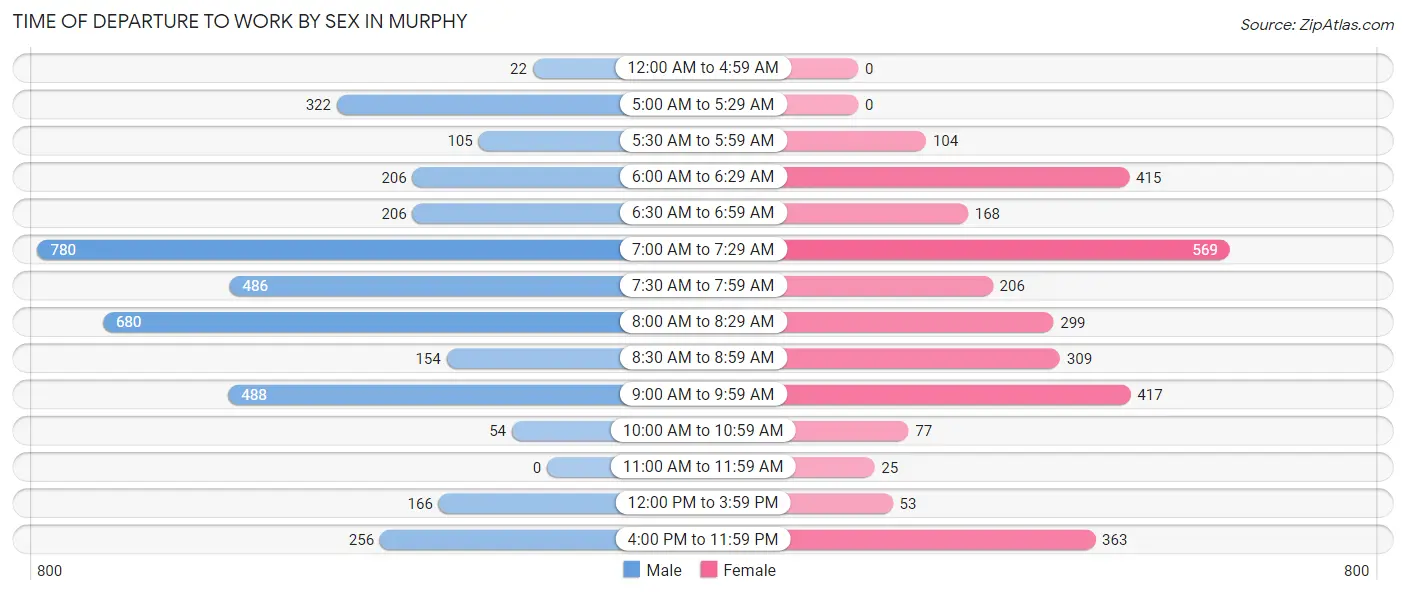
| Time of Departure | Male | Female |
| 12:00 AM to 4:59 AM | 22 (0.6%) | 0 (0.0%) |
| 5:00 AM to 5:29 AM | 322 (8.2%) | 0 (0.0%) |
| 5:30 AM to 5:59 AM | 105 (2.7%) | 104 (3.5%) |
| 6:00 AM to 6:29 AM | 206 (5.2%) | 415 (13.8%) |
| 6:30 AM to 6:59 AM | 206 (5.2%) | 168 (5.6%) |
| 7:00 AM to 7:29 AM | 780 (19.9%) | 569 (18.9%) |
| 7:30 AM to 7:59 AM | 486 (12.4%) | 206 (6.9%) |
| 8:00 AM to 8:29 AM | 680 (17.3%) | 299 (10.0%) |
| 8:30 AM to 8:59 AM | 154 (3.9%) | 309 (10.3%) |
| 9:00 AM to 9:59 AM | 488 (12.4%) | 417 (13.9%) |
| 10:00 AM to 10:59 AM | 54 (1.4%) | 77 (2.6%) |
| 11:00 AM to 11:59 AM | 0 (0.0%) | 25 (0.8%) |
| 12:00 PM to 3:59 PM | 166 (4.2%) | 53 (1.8%) |
| 4:00 PM to 11:59 PM | 256 (6.5%) | 363 (12.1%) |
| Total | 3,925 (100.0%) | 3,005 (100.0%) |
Housing Occupancy in Murphy
Occupancy by Ownership in Murphy
Of the total 5,723 dwellings in Murphy, owner-occupied units account for 5,251 (91.7%), while renter-occupied units make up 472 (8.3%).
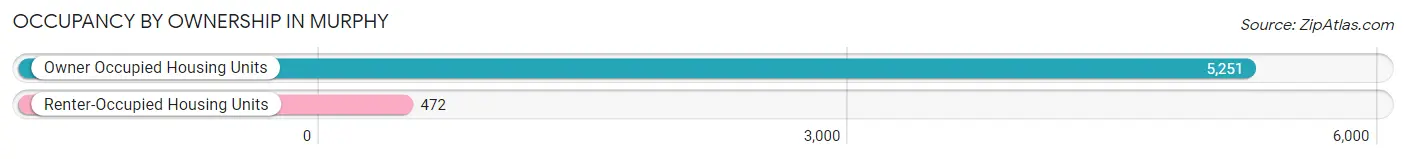
| Occupancy | # Housing Units | % Housing Units |
| Owner Occupied Housing Units | 5,251 | 91.7% |
| Renter-Occupied Housing Units | 472 | 8.3% |
| Total Occupied Housing Units | 5,723 | 100.0% |
Occupancy by Household Size in Murphy
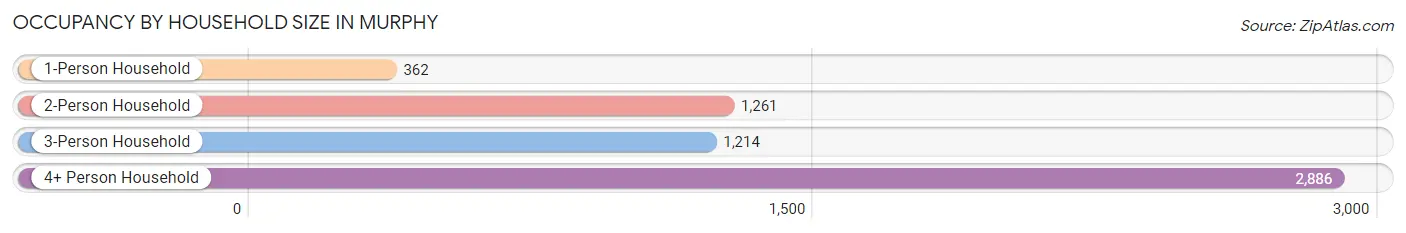
| Household Size | # Housing Units | % Housing Units |
| 1-Person Household | 362 | 6.3% |
| 2-Person Household | 1,261 | 22.0% |
| 3-Person Household | 1,214 | 21.2% |
| 4+ Person Household | 2,886 | 50.4% |
| Total Housing Units | 5,723 | 100.0% |
Occupancy by Ownership by Household Size in Murphy
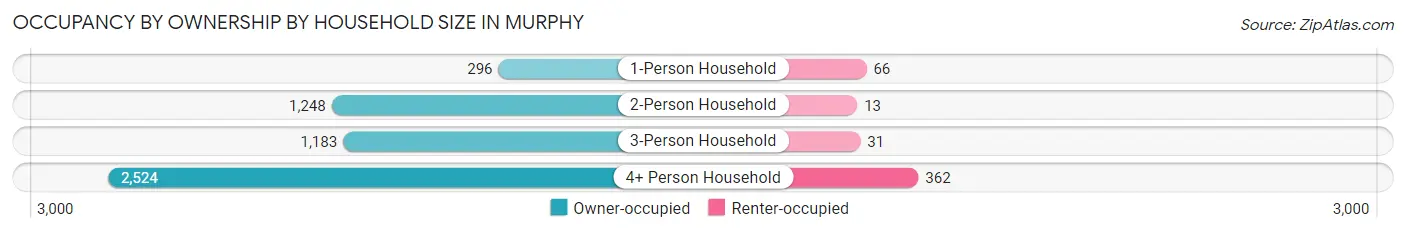
| Household Size | Owner-occupied | Renter-occupied |
| 1-Person Household | 296 (81.8%) | 66 (18.2%) |
| 2-Person Household | 1,248 (99.0%) | 13 (1.0%) |
| 3-Person Household | 1,183 (97.5%) | 31 (2.5%) |
| 4+ Person Household | 2,524 (87.5%) | 362 (12.5%) |
| Total Housing Units | 5,251 (91.7%) | 472 (8.3%) |
Occupancy by Educational Attainment in Murphy
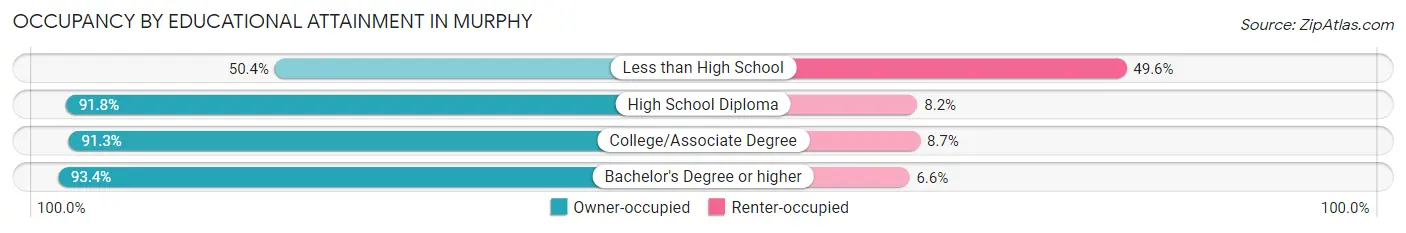
| Household Size | Owner-occupied | Renter-occupied |
| Less than High School | 63 (50.4%) | 62 (49.6%) |
| High School Diploma | 518 (91.8%) | 46 (8.2%) |
| College/Associate Degree | 1,365 (91.3%) | 130 (8.7%) |
| Bachelor's Degree or higher | 3,305 (93.4%) | 234 (6.6%) |
Occupancy by Age of Householder in Murphy
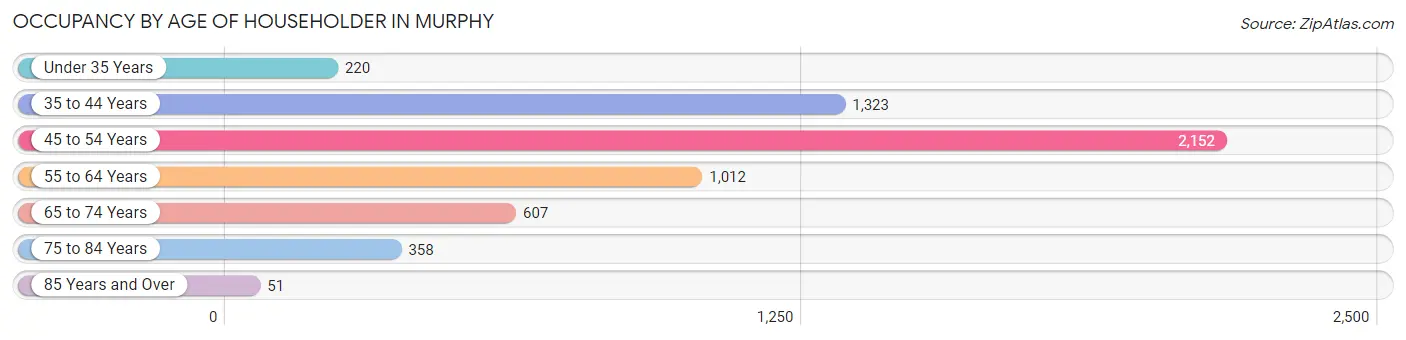
| Age Bracket | # Households | % Households |
| Under 35 Years | 220 | 3.8% |
| 35 to 44 Years | 1,323 | 23.1% |
| 45 to 54 Years | 2,152 | 37.6% |
| 55 to 64 Years | 1,012 | 17.7% |
| 65 to 74 Years | 607 | 10.6% |
| 75 to 84 Years | 358 | 6.3% |
| 85 Years and Over | 51 | 0.9% |
| Total | 5,723 | 100.0% |
Housing Finances in Murphy
Median Income by Occupancy in Murphy
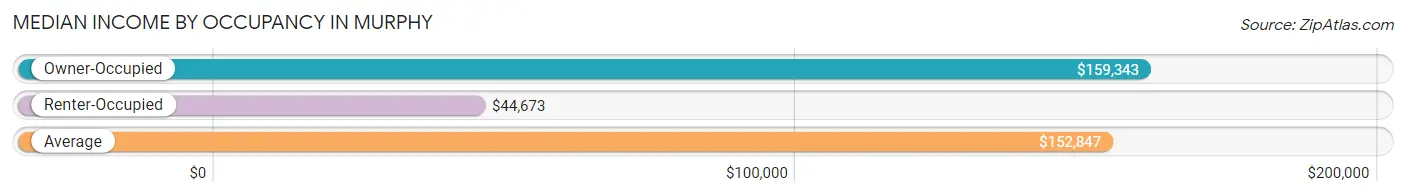
| Occupancy Type | # Households | Median Income |
| Owner-Occupied | 5,251 (91.7%) | $159,343 |
| Renter-Occupied | 472 (8.3%) | $44,673 |
| Average | 5,723 (100.0%) | $152,847 |
Occupancy by Householder Income Bracket in Murphy
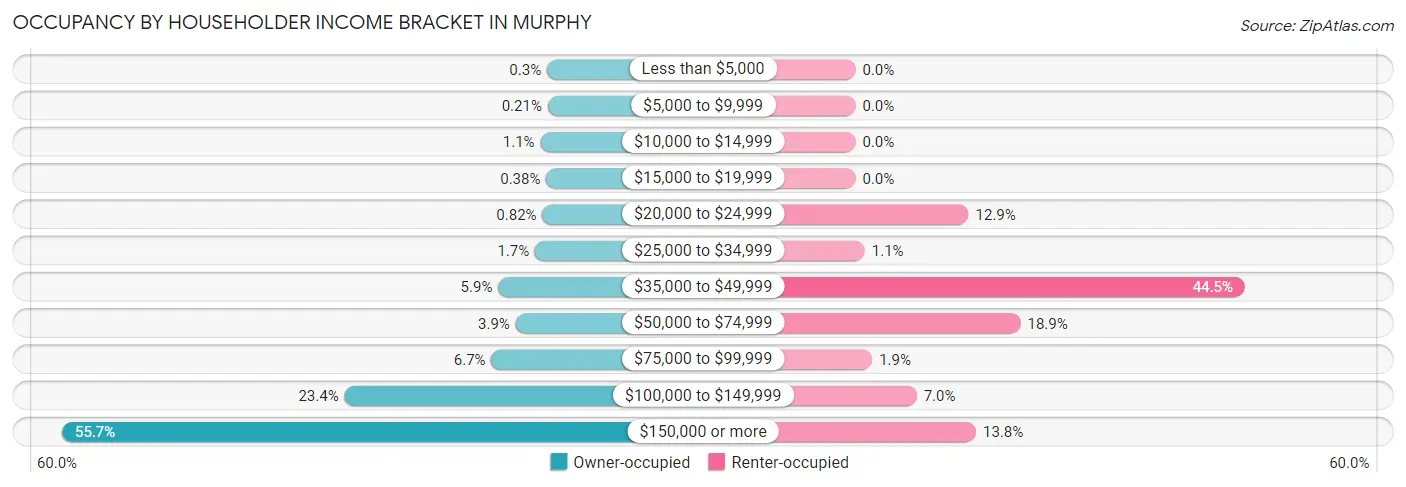
| Income Bracket | Owner-occupied | Renter-occupied |
| Less than $5,000 | 16 (0.3%) | 0 (0.0%) |
| $5,000 to $9,999 | 11 (0.2%) | 0 (0.0%) |
| $10,000 to $14,999 | 55 (1.1%) | 0 (0.0%) |
| $15,000 to $19,999 | 20 (0.4%) | 0 (0.0%) |
| $20,000 to $24,999 | 43 (0.8%) | 61 (12.9%) |
| $25,000 to $34,999 | 87 (1.7%) | 5 (1.1%) |
| $35,000 to $49,999 | 308 (5.9%) | 210 (44.5%) |
| $50,000 to $74,999 | 204 (3.9%) | 89 (18.9%) |
| $75,000 to $99,999 | 349 (6.7%) | 9 (1.9%) |
| $100,000 to $149,999 | 1,231 (23.4%) | 33 (7.0%) |
| $150,000 or more | 2,927 (55.7%) | 65 (13.8%) |
| Total | 5,251 (100.0%) | 472 (100.0%) |
Monthly Housing Cost Tiers in Murphy
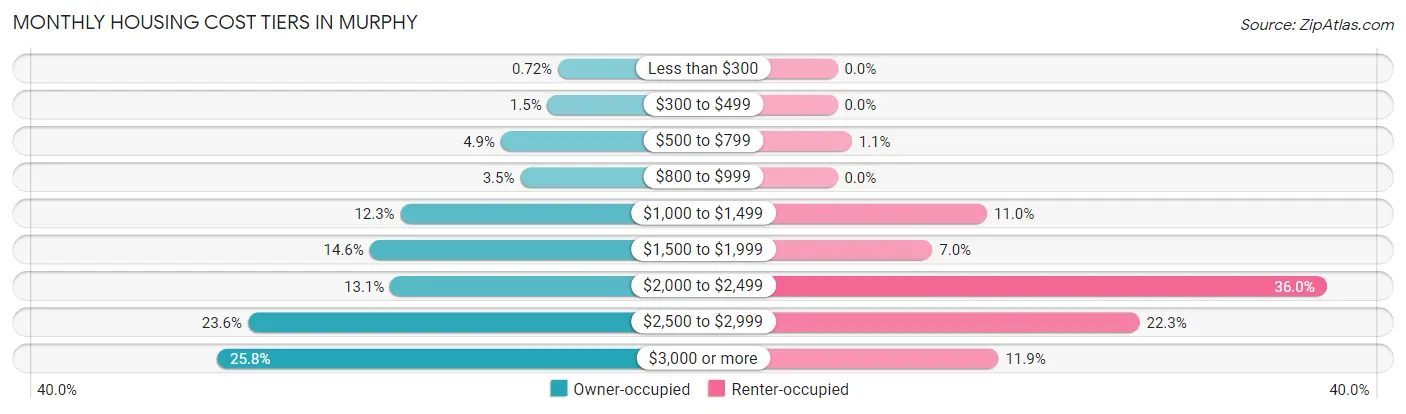
| Monthly Cost | Owner-occupied | Renter-occupied |
| Less than $300 | 38 (0.7%) | 0 (0.0%) |
| $300 to $499 | 78 (1.5%) | 0 (0.0%) |
| $500 to $799 | 259 (4.9%) | 5 (1.1%) |
| $800 to $999 | 183 (3.5%) | 0 (0.0%) |
| $1,000 to $1,499 | 647 (12.3%) | 52 (11.0%) |
| $1,500 to $1,999 | 766 (14.6%) | 33 (7.0%) |
| $2,000 to $2,499 | 687 (13.1%) | 170 (36.0%) |
| $2,500 to $2,999 | 1,237 (23.6%) | 105 (22.3%) |
| $3,000 or more | 1,356 (25.8%) | 56 (11.9%) |
| Total | 5,251 (100.0%) | 472 (100.0%) |
Physical Housing Characteristics in Murphy
Housing Structures in Murphy
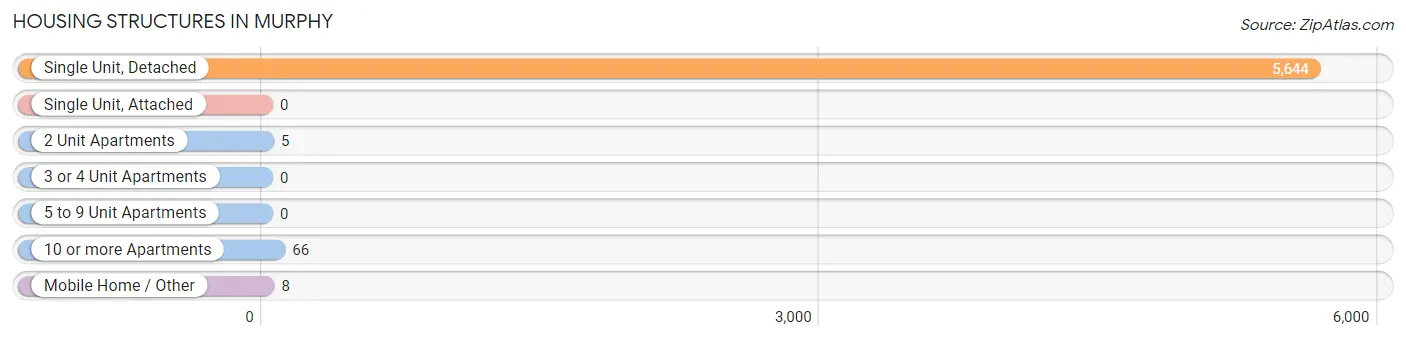
| Structure Type | # Housing Units | % Housing Units |
| Single Unit, Detached | 5,644 | 98.6% |
| Single Unit, Attached | 0 | 0.0% |
| 2 Unit Apartments | 5 | 0.1% |
| 3 or 4 Unit Apartments | 0 | 0.0% |
| 5 to 9 Unit Apartments | 0 | 0.0% |
| 10 or more Apartments | 66 | 1.1% |
| Mobile Home / Other | 8 | 0.1% |
| Total | 5,723 | 100.0% |
Housing Structures by Occupancy in Murphy
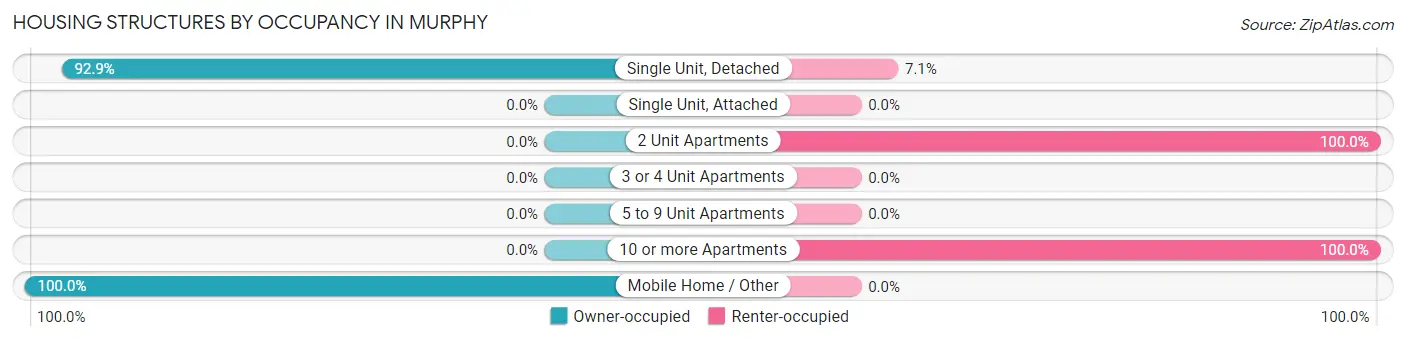
| Structure Type | Owner-occupied | Renter-occupied |
| Single Unit, Detached | 5,243 (92.9%) | 401 (7.1%) |
| Single Unit, Attached | 0 (0.0%) | 0 (0.0%) |
| 2 Unit Apartments | 0 (0.0%) | 5 (100.0%) |
| 3 or 4 Unit Apartments | 0 (0.0%) | 0 (0.0%) |
| 5 to 9 Unit Apartments | 0 (0.0%) | 0 (0.0%) |
| 10 or more Apartments | 0 (0.0%) | 66 (100.0%) |
| Mobile Home / Other | 8 (100.0%) | 0 (0.0%) |
| Total | 5,251 (91.7%) | 472 (8.3%) |
Housing Structures by Number of Rooms in Murphy
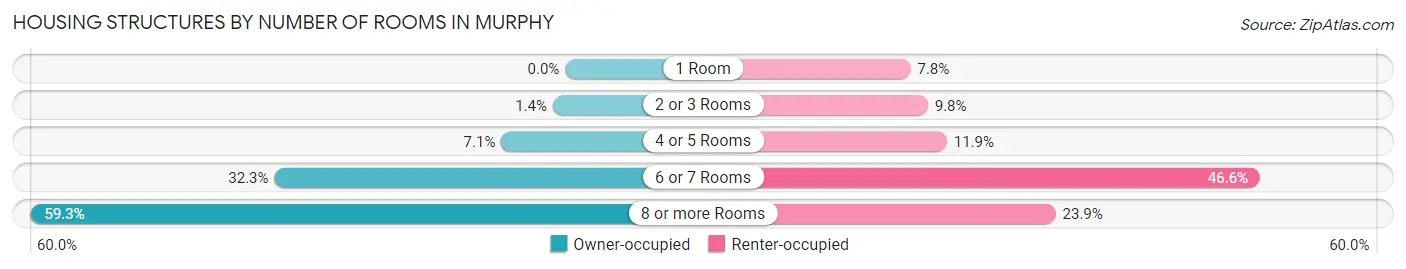
| Number of Rooms | Owner-occupied | Renter-occupied |
| 1 Room | 0 (0.0%) | 37 (7.8%) |
| 2 or 3 Rooms | 72 (1.4%) | 46 (9.8%) |
| 4 or 5 Rooms | 373 (7.1%) | 56 (11.9%) |
| 6 or 7 Rooms | 1,695 (32.3%) | 220 (46.6%) |
| 8 or more Rooms | 3,111 (59.3%) | 113 (23.9%) |
| Total | 5,251 (100.0%) | 472 (100.0%) |
Housing Structure by Heating Type in Murphy
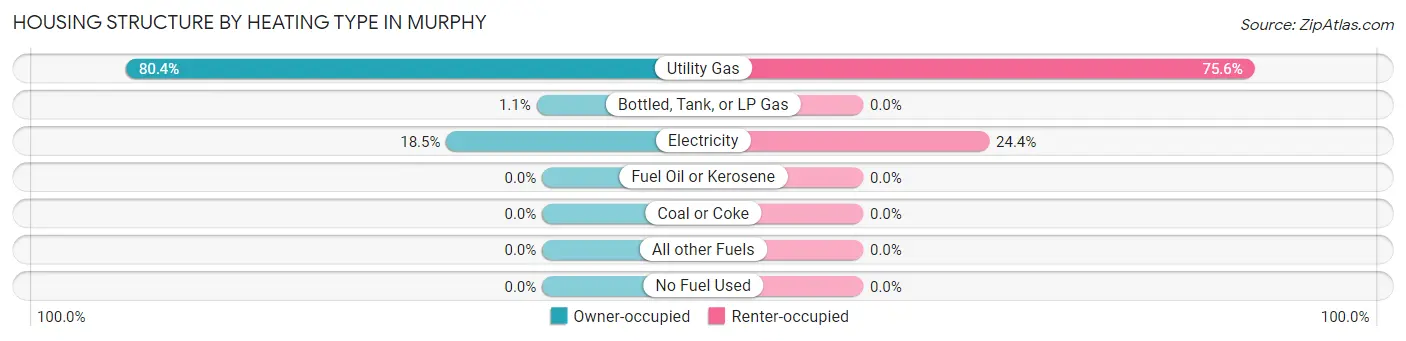
| Heating Type | Owner-occupied | Renter-occupied |
| Utility Gas | 4,223 (80.4%) | 357 (75.6%) |
| Bottled, Tank, or LP Gas | 56 (1.1%) | 0 (0.0%) |
| Electricity | 972 (18.5%) | 115 (24.4%) |
| Fuel Oil or Kerosene | 0 (0.0%) | 0 (0.0%) |
| Coal or Coke | 0 (0.0%) | 0 (0.0%) |
| All other Fuels | 0 (0.0%) | 0 (0.0%) |
| No Fuel Used | 0 (0.0%) | 0 (0.0%) |
| Total | 5,251 (100.0%) | 472 (100.0%) |
Household Vehicle Usage in Murphy
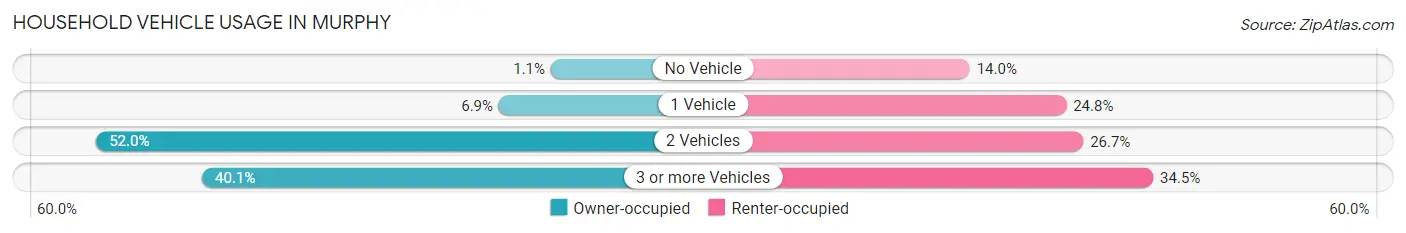
| Vehicles per Household | Owner-occupied | Renter-occupied |
| No Vehicle | 55 (1.1%) | 66 (14.0%) |
| 1 Vehicle | 361 (6.9%) | 117 (24.8%) |
| 2 Vehicles | 2,729 (52.0%) | 126 (26.7%) |
| 3 or more Vehicles | 2,106 (40.1%) | 163 (34.5%) |
| Total | 5,251 (100.0%) | 472 (100.0%) |
Real Estate & Mortgages in Murphy
Real Estate and Mortgage Overview in Murphy
| Characteristic | Without Mortgage | With Mortgage |
| Housing Units | 1,435 | 3,816 |
| Median Property Value | $442,800 | $463,900 |
| Median Household Income | $146,219 | $2,251 |
| Monthly Housing Costs | $1,205 | $1,339 |
| Real Estate Taxes | $7,809 | $13 |
Property Value by Mortgage Status in Murphy
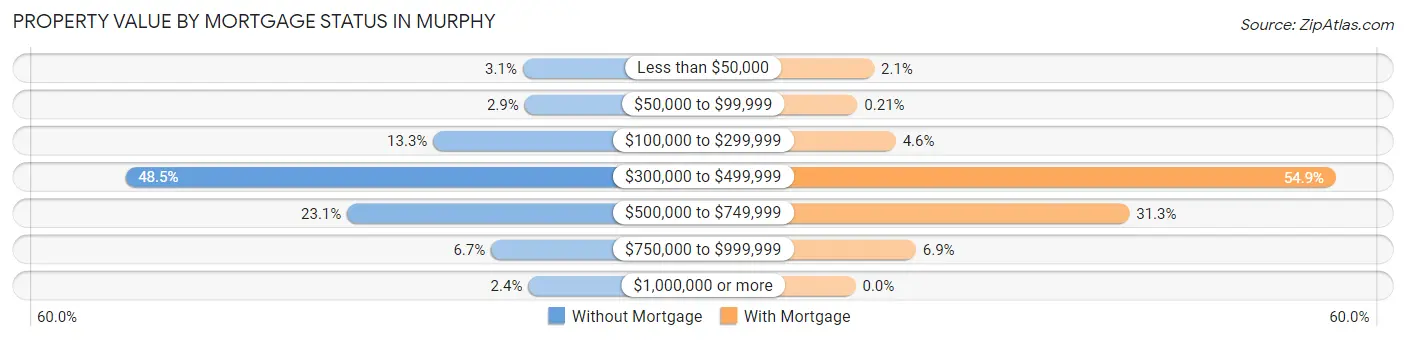
| Property Value | Without Mortgage | With Mortgage |
| Less than $50,000 | 44 (3.1%) | 81 (2.1%) |
| $50,000 to $99,999 | 41 (2.9%) | 8 (0.2%) |
| $100,000 to $299,999 | 191 (13.3%) | 175 (4.6%) |
| $300,000 to $499,999 | 696 (48.5%) | 2,095 (54.9%) |
| $500,000 to $749,999 | 332 (23.1%) | 1,194 (31.3%) |
| $750,000 to $999,999 | 96 (6.7%) | 263 (6.9%) |
| $1,000,000 or more | 35 (2.4%) | 0 (0.0%) |
| Total | 1,435 (100.0%) | 3,816 (100.0%) |
Household Income by Mortgage Status in Murphy
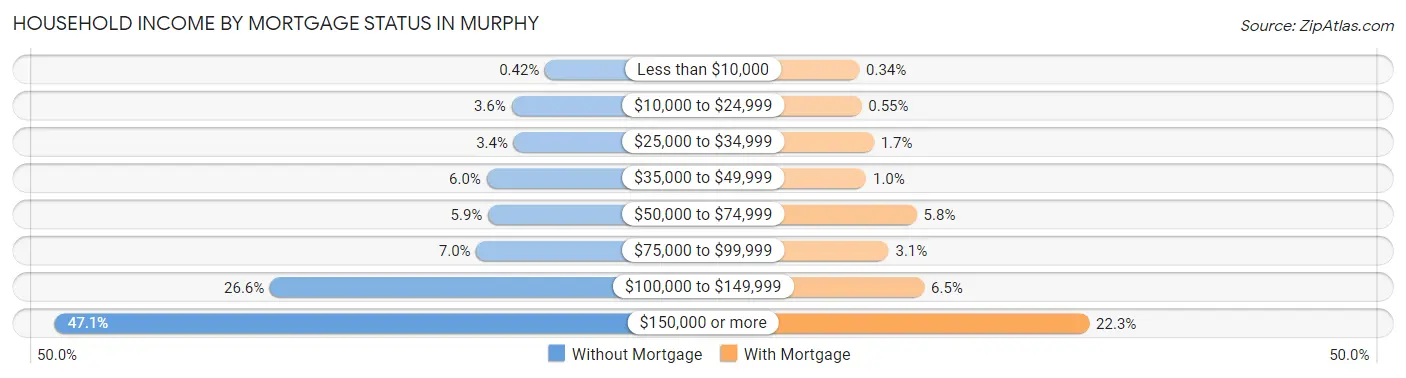
| Household Income | Without Mortgage | With Mortgage |
| Less than $10,000 | 6 (0.4%) | 13 (0.3%) |
| $10,000 to $24,999 | 52 (3.6%) | 21 (0.5%) |
| $25,000 to $34,999 | 49 (3.4%) | 66 (1.7%) |
| $35,000 to $49,999 | 86 (6.0%) | 38 (1.0%) |
| $50,000 to $74,999 | 84 (5.9%) | 222 (5.8%) |
| $75,000 to $99,999 | 100 (7.0%) | 120 (3.1%) |
| $100,000 to $149,999 | 382 (26.6%) | 249 (6.5%) |
| $150,000 or more | 676 (47.1%) | 849 (22.3%) |
| Total | 1,435 (100.0%) | 3,816 (100.0%) |
Property Value to Household Income Ratio in Murphy
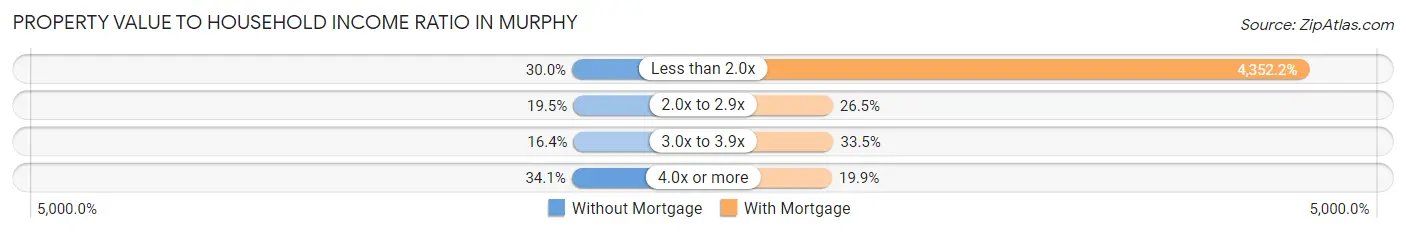
| Value-to-Income Ratio | Without Mortgage | With Mortgage |
| Less than 2.0x | 431 (30.0%) | 166,081 (4,352.2%) |
| 2.0x to 2.9x | 280 (19.5%) | 1,012 (26.5%) |
| 3.0x to 3.9x | 235 (16.4%) | 1,279 (33.5%) |
| 4.0x or more | 489 (34.1%) | 759 (19.9%) |
| Total | 1,435 (100.0%) | 3,816 (100.0%) |
Real Estate Taxes by Mortgage Status in Murphy
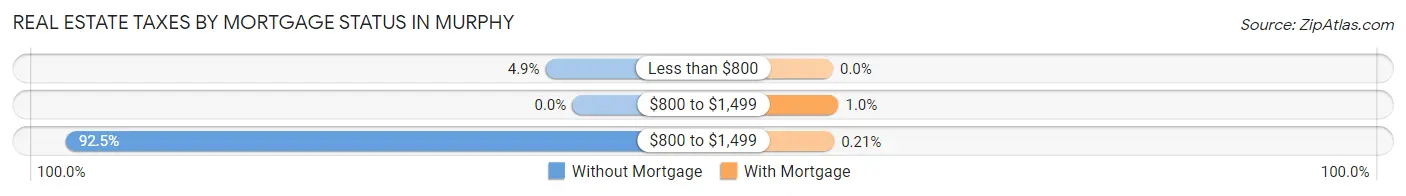
| Property Taxes | Without Mortgage | With Mortgage |
| Less than $800 | 70 (4.9%) | 0 (0.0%) |
| $800 to $1,499 | 0 (0.0%) | 38 (1.0%) |
| $800 to $1,499 | 1,327 (92.5%) | 8 (0.2%) |
| Total | 1,435 (100.0%) | 3,816 (100.0%) |
Health & Disability in Murphy
Health Insurance Coverage by Age in Murphy
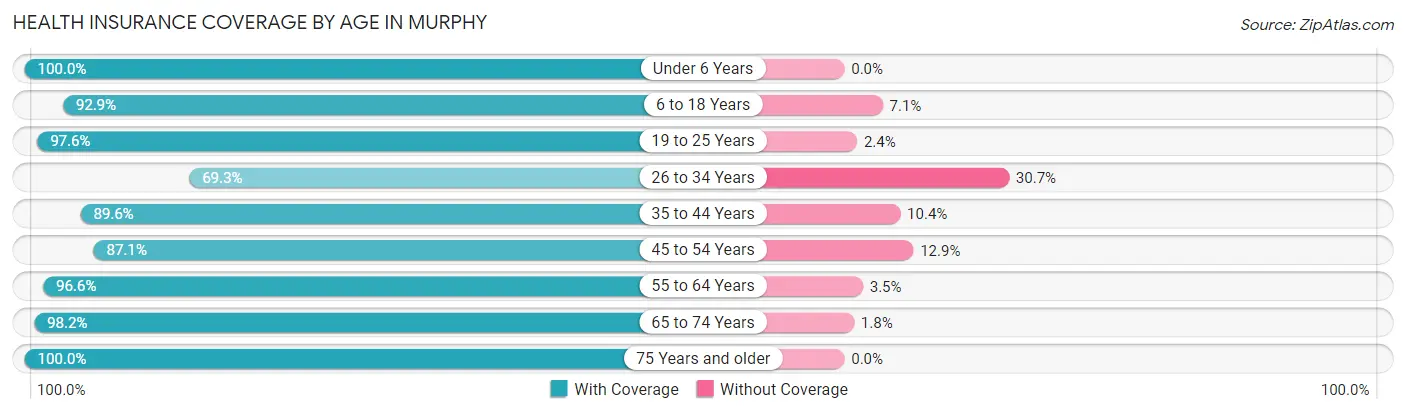
| Age Bracket | With Coverage | Without Coverage |
| Under 6 Years | 1,031 (100.0%) | 0 (0.0%) |
| 6 to 18 Years | 6,006 (92.9%) | 462 (7.1%) |
| 19 to 25 Years | 1,118 (97.6%) | 27 (2.4%) |
| 26 to 34 Years | 571 (69.3%) | 253 (30.7%) |
| 35 to 44 Years | 2,639 (89.6%) | 307 (10.4%) |
| 45 to 54 Years | 3,780 (87.1%) | 558 (12.9%) |
| 55 to 64 Years | 2,045 (96.6%) | 73 (3.5%) |
| 65 to 74 Years | 1,317 (98.2%) | 24 (1.8%) |
| 75 Years and older | 669 (100.0%) | 0 (0.0%) |
| Total | 19,176 (91.8%) | 1,704 (8.2%) |
Health Insurance Coverage by Citizenship Status in Murphy
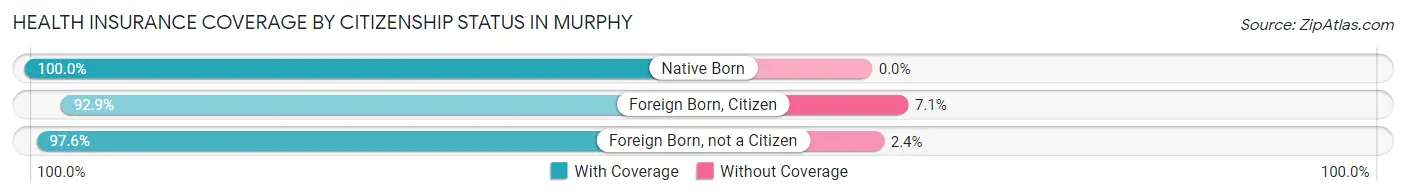
| Citizenship Status | With Coverage | Without Coverage |
| Native Born | 1,031 (100.0%) | 0 (0.0%) |
| Foreign Born, Citizen | 6,006 (92.9%) | 462 (7.1%) |
| Foreign Born, not a Citizen | 1,118 (97.6%) | 27 (2.4%) |
Health Insurance Coverage by Household Income in Murphy
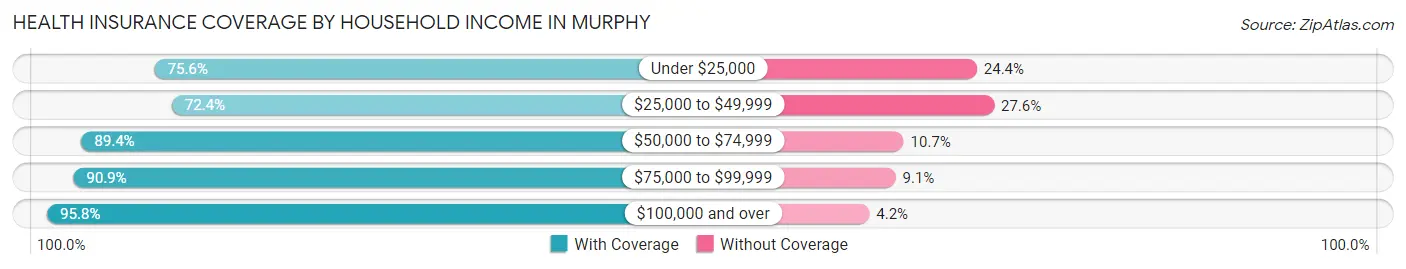
| Household Income | With Coverage | Without Coverage |
| Under $25,000 | 360 (75.6%) | 116 (24.4%) |
| $25,000 to $49,999 | 1,862 (72.4%) | 709 (27.6%) |
| $50,000 to $74,999 | 881 (89.3%) | 105 (10.6%) |
| $75,000 to $99,999 | 1,173 (90.9%) | 118 (9.1%) |
| $100,000 and over | 14,900 (95.8%) | 656 (4.2%) |
Public vs Private Health Insurance Coverage by Age in Murphy
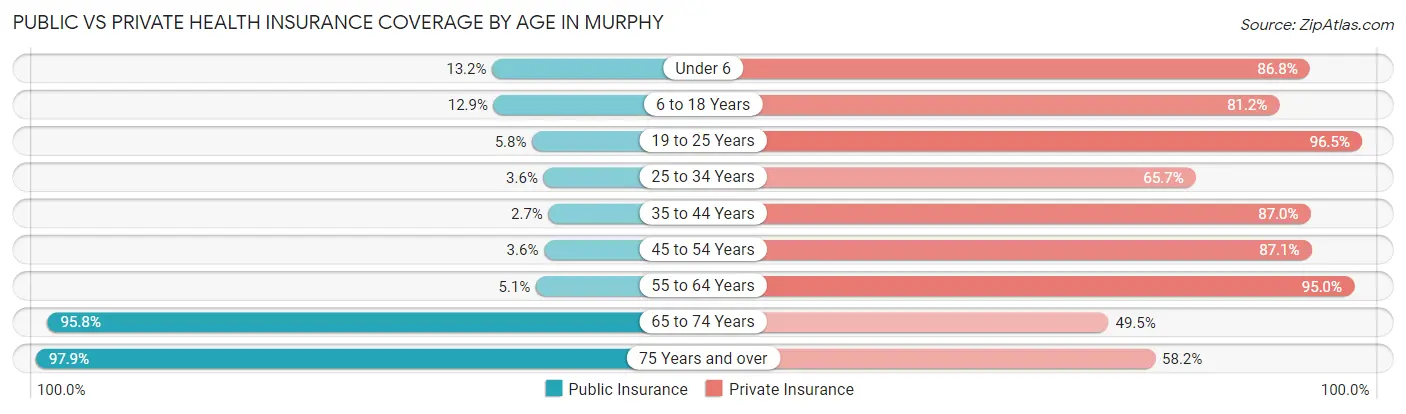
| Age Bracket | Public Insurance | Private Insurance |
| Under 6 | 136 (13.2%) | 895 (86.8%) |
| 6 to 18 Years | 835 (12.9%) | 5,251 (81.2%) |
| 19 to 25 Years | 66 (5.8%) | 1,105 (96.5%) |
| 25 to 34 Years | 30 (3.6%) | 541 (65.7%) |
| 35 to 44 Years | 80 (2.7%) | 2,562 (87.0%) |
| 45 to 54 Years | 154 (3.5%) | 3,780 (87.1%) |
| 55 to 64 Years | 107 (5.1%) | 2,013 (95.0%) |
| 65 to 74 Years | 1,284 (95.8%) | 664 (49.5%) |
| 75 Years and over | 655 (97.9%) | 389 (58.2%) |
| Total | 3,347 (16.0%) | 17,200 (82.4%) |
Disability Status by Sex by Age in Murphy
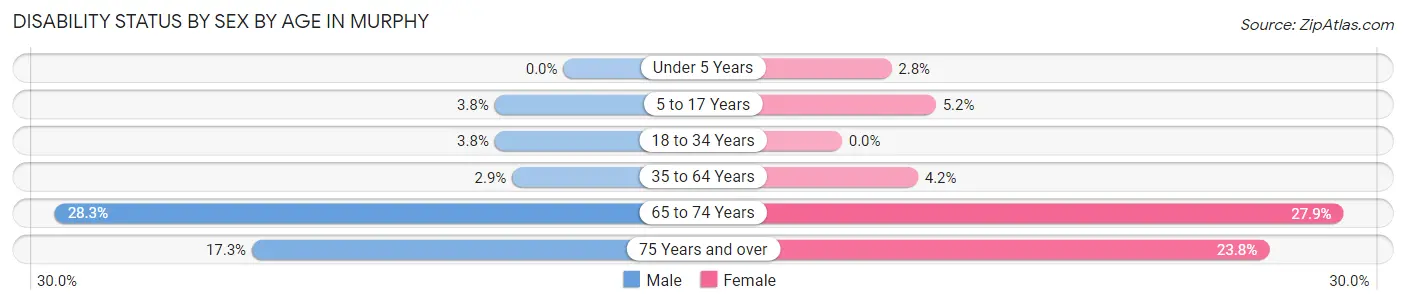
| Age Bracket | Male | Female |
| Under 5 Years | 0 (0.0%) | 11 (2.8%) |
| 5 to 17 Years | 124 (3.8%) | 154 (5.2%) |
| 18 to 34 Years | 46 (3.8%) | 0 (0.0%) |
| 35 to 64 Years | 128 (2.9%) | 208 (4.2%) |
| 65 to 74 Years | 179 (28.3%) | 198 (27.9%) |
| 75 Years and over | 73 (17.3%) | 59 (23.8%) |
Disability Class by Sex by Age in Murphy
Disability Class: Hearing Difficulty
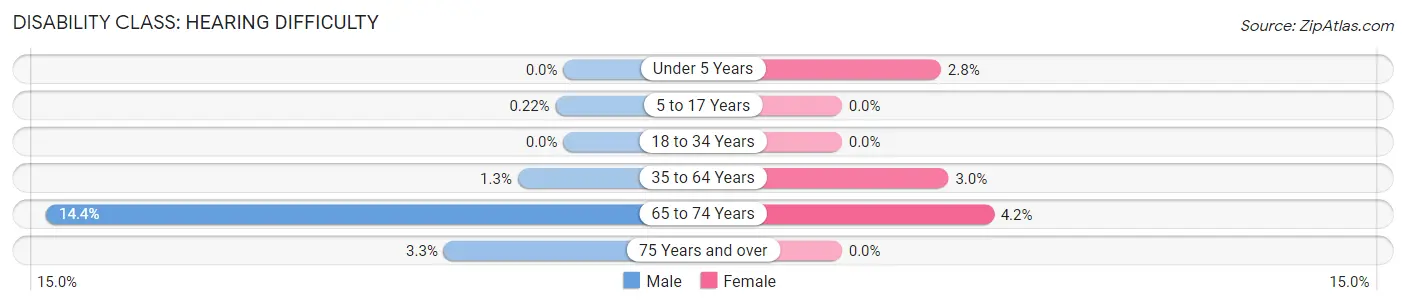
| Age Bracket | Male | Female |
| Under 5 Years | 0 (0.0%) | 11 (2.8%) |
| 5 to 17 Years | 7 (0.2%) | 0 (0.0%) |
| 18 to 34 Years | 0 (0.0%) | 0 (0.0%) |
| 35 to 64 Years | 57 (1.3%) | 146 (3.0%) |
| 65 to 74 Years | 91 (14.4%) | 30 (4.2%) |
| 75 Years and over | 14 (3.3%) | 0 (0.0%) |
Disability Class: Vision Difficulty
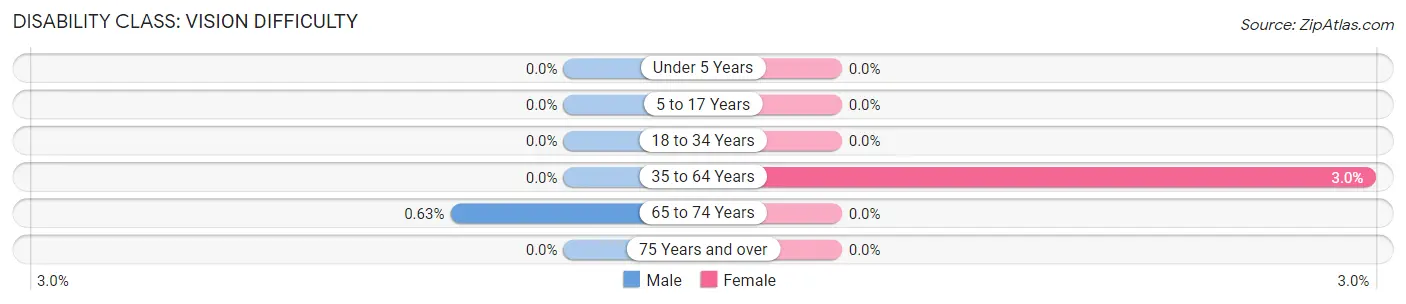
| Age Bracket | Male | Female |
| Under 5 Years | 0 (0.0%) | 0 (0.0%) |
| 5 to 17 Years | 0 (0.0%) | 0 (0.0%) |
| 18 to 34 Years | 0 (0.0%) | 0 (0.0%) |
| 35 to 64 Years | 0 (0.0%) | 146 (3.0%) |
| 65 to 74 Years | 4 (0.6%) | 0 (0.0%) |
| 75 Years and over | 0 (0.0%) | 0 (0.0%) |
Disability Class: Cognitive Difficulty
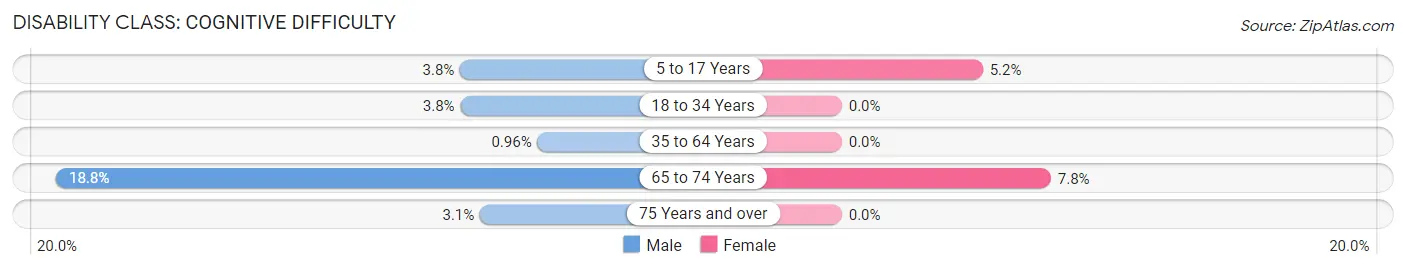
| Age Bracket | Male | Female |
| 5 to 17 Years | 124 (3.8%) | 154 (5.2%) |
| 18 to 34 Years | 46 (3.8%) | 0 (0.0%) |
| 35 to 64 Years | 43 (1.0%) | 0 (0.0%) |
| 65 to 74 Years | 119 (18.8%) | 55 (7.8%) |
| 75 Years and over | 13 (3.1%) | 0 (0.0%) |
Disability Class: Ambulatory Difficulty
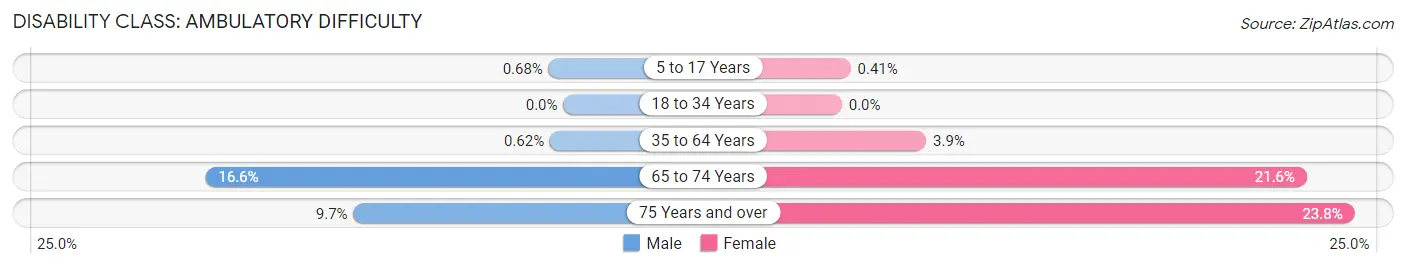
| Age Bracket | Male | Female |
| 5 to 17 Years | 22 (0.7%) | 12 (0.4%) |
| 18 to 34 Years | 0 (0.0%) | 0 (0.0%) |
| 35 to 64 Years | 28 (0.6%) | 192 (3.9%) |
| 65 to 74 Years | 105 (16.6%) | 153 (21.6%) |
| 75 Years and over | 41 (9.7%) | 59 (23.8%) |
Disability Class: Self-Care Difficulty
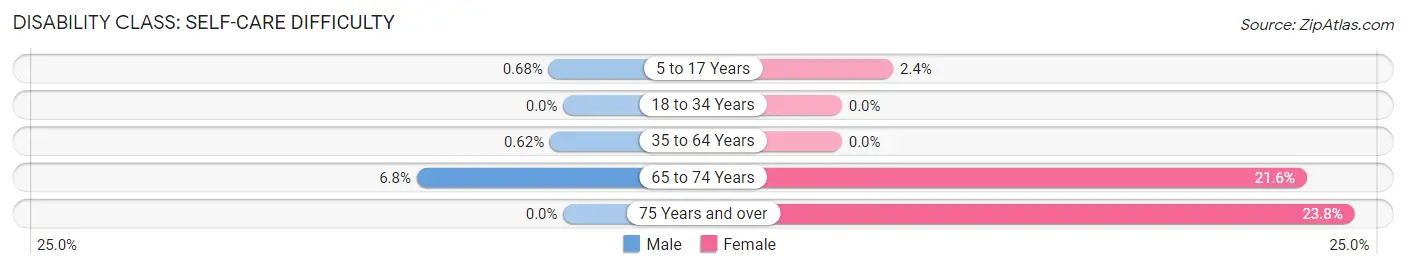
| Age Bracket | Male | Female |
| 5 to 17 Years | 22 (0.7%) | 70 (2.4%) |
| 18 to 34 Years | 0 (0.0%) | 0 (0.0%) |
| 35 to 64 Years | 28 (0.6%) | 0 (0.0%) |
| 65 to 74 Years | 43 (6.8%) | 153 (21.6%) |
| 75 Years and over | 0 (0.0%) | 59 (23.8%) |
Technology Access in Murphy
Computing Device Access in Murphy
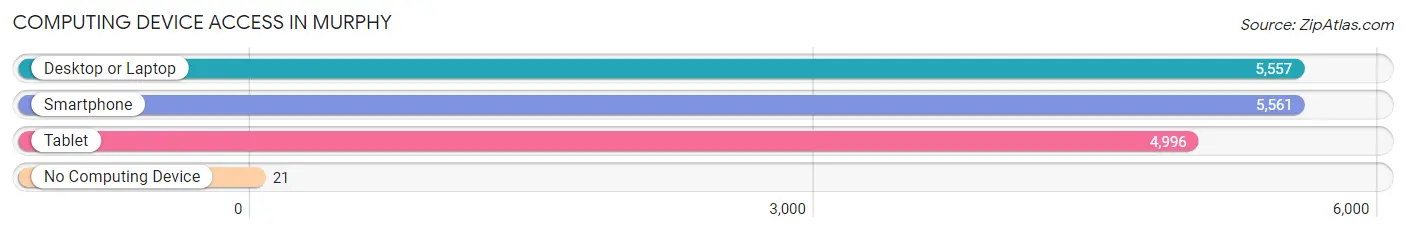
| Device Type | # Households | % Households |
| Desktop or Laptop | 5,557 | 97.1% |
| Smartphone | 5,561 | 97.2% |
| Tablet | 4,996 | 87.3% |
| No Computing Device | 21 | 0.4% |
| Total | 5,723 | 100.0% |
Internet Access in Murphy
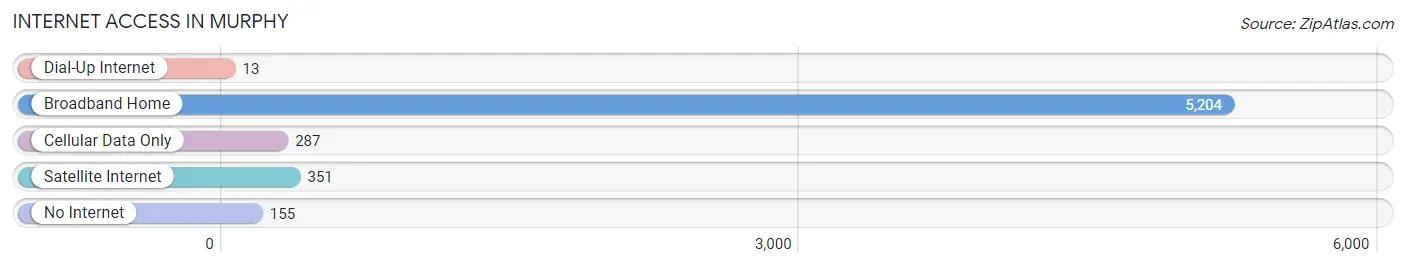
| Internet Type | # Households | % Households |
| Dial-Up Internet | 13 | 0.2% |
| Broadband Home | 5,204 | 90.9% |
| Cellular Data Only | 287 | 5.0% |
| Satellite Internet | 351 | 6.1% |
| No Internet | 155 | 2.7% |
| Total | 5,723 | 100.0% |
Murphy Summary
Murphy, Texas is a small city located in Collin County, Texas, United States. It is part of the Dallas-Fort Worth-Arlington metropolitan area. The population of Murphy was estimated to be 17,708 in 2019.
History
The area that is now Murphy was first settled in the 1840s by a group of settlers from Kentucky. The settlement was originally known as Murphyville, named after the first postmaster, William Murphy. The town was officially incorporated in 1958.
Geography
Murphy is located in Collin County, Texas, approximately 25 miles northeast of Dallas. It is situated at the intersection of U.S. Highway 75 and Farm to Market Road 544. The city has a total area of 8.3 square miles, all of which is land.
Economy
Murphy is a rapidly growing city with a diverse economy. The city is home to a variety of businesses, including retail stores, restaurants, and professional services. The city is also home to several large employers, including Walmart, Home Depot, and Lowe’s.
Demographics
As of the 2019 census, the population of Murphy was estimated to be 17,708. The racial makeup of the city was 79.2% White, 8.2% African American, 0.3% Native American, 5.2% Asian, and 4.3% from other races. The median household income was $90,945, and the median family income was $103,945.
Conclusion
Murphy, Texas is a small city located in Collin County, Texas, United States. It is part of the Dallas-Fort Worth-Arlington metropolitan area. The city has a rich history, diverse geography, and a thriving economy. The population of Murphy was estimated to be 17,708 in 2019, with a median household income of $90,945. Murphy is a rapidly growing city with a variety of businesses and employers, making it an attractive place to live and work.
Common Questions
What is the Total Population of Murphy?
Total Population of Murphy is 20,880.
What is the Total Male Population of Murphy?
Total Male Population of Murphy is 10,385.
What is the Total Female Population of Murphy?
Total Female Population of Murphy is 10,495.
What is the Ratio of Males per 100 Females in Murphy?
There are 98.95 Males per 100 Females in Murphy.
What is the Ratio of Females per 100 Males in Murphy?
There are 101.06 Females per 100 Males in Murphy.
What is the Median Population Age in Murphy?
Median Population Age in Murphy is 39.3 Years.
What is the Average Family Size in Murphy
Average Family Size in Murphy is 3.8 People.
What is the Average Household Size in Murphy
Average Household Size in Murphy is 3.6 People.
What is Per Capita Income in Murphy?
Per Capita income in Murphy is $46,829.
What is the Median Family Income in Murphy?
Median Family Income in Murphy is $158,791.
What is the Median Household income in Murphy?
Median Household Income in Murphy is $152,847.
What is Income or Wage Gap in Murphy?
Income or Wage Gap in Murphy is 66.0%.
Women in Murphy earn 34.0 cents for every dollar earned by a man.
What is Family Income Deficit in Murphy?
Family Income Deficit in Murphy is $7,497.
Families that are below poverty line in Murphy earn $7,497 less on average than the poverty threshold level.
What is Inequality or Gini Index in Murphy?
Inequality or Gini Index in Murphy is 0.34.
How Large is the Labor Force in Murphy?
There are 10,215 People in the Labor Forcein in Murphy.
What is the Percentage of People in the Labor Force in Murphy?
67.6% of People are in the Labor Force in Murphy.
What is the Unemployment Rate in Murphy?
Unemployment Rate in Murphy is 5.2%.